MEMBERS ONLY
S&P 500 Pullbacks Are Changing. What’s Different Now?
by Frank Cappelleri,
Founder & President, CappThesis, LLC
S&P 500 pullbacks are starting to behave differently following a confirmed breakdown and rising volatility. Frank Cappelleri explains what’s changed, what signals are weakening, and what needs to happen next....
READ MORE
MEMBERS ONLY
S&P 500 Pullbacks Keep Getting Bought. Why?
by Frank Cappelleri,
Founder & President, CappThesis, LLC
S&P 500 pullbacks keep attracting buyers, even as momentum signals weaken. Join Frank Cappelleri as he explains why dip-buying continues to support the market in spite of rising volatility and mixed technical signals....
READ MORE
MEMBERS ONLY
S&P 500 Can’t Clear 7000. Who Blinks First?
by Frank Cappelleri,
Founder & President, CappThesis, LLC
The S&P 500 keeps testing 7000, but follow-through has been elusive. Frank Cappelleri breaks down the breakout attempts, failed bearish signals, and internal strength that could determine who gives way first....
READ MORE
MEMBERS ONLY
Tech Leadership Is Rotating. What’s Working Right Now?
by Frank Cappelleri,
Founder & President, CappThesis, LLC
Frank Cappelleri analyzes how leadership within tech is starting to rotate, with some areas holding breakouts while others struggle. Discover which parts of large-cap tech are still working and what patterns investors should be watching....
READ MORE
MEMBERS ONLY
What Staples, Silver, and Semis Are Telling Us Now
by Frank Cappelleri,
Founder & President, CappThesis, LLC
XLP posts its largest 5-day gain since COVID, Silver surges 21% in four days, and sector divergence offers important market clues....
READ MORE
MEMBERS ONLY
Financials, Semiconductors, and Bitcoin Are Moving: Here’s Why
by Frank Cappelleri,
Founder & President, CappThesis, LLC
Frank Cappelleri breaks down why financials and semiconductors are showing strength and how Bitcoin is attempting to regain momentum early in 2026. Failed breakdowns, bullish patterns, and key levels are shaping what happens next in the market....
READ MORE
MEMBERS ONLY
S&P 500 Shows Topping Signs! Financials and Semis at Key Levels
by Frank Cappelleri,
Founder & President, CappThesis, LLC
Frank Cappelleri breaks down a major market inflection point as the S&P 500 tests a topping pattern and several key levels. He also reviews financials and semiconductors where structure shifts and breakdown risks may determine the next move....
READ MORE
MEMBERS ONLY
Market Breadth Weakens — Is the S&P 500 in Trouble??
by Frank Cappelleri,
Founder & President, CappThesis, LLC
Follow along as Frank Cappelleri breaks down the S&P 500’s pullback, small-cap growth momentum, biotech leadership, and Bitcoin’s key support test. See what patterns and sector shifts could define the next market move!...
READ MORE
MEMBERS ONLY
Reading Between the Lines: What RSI and Breadth Are Saying About Stocks
by Frank Cappelleri,
Founder & President, CappThesis, LLC
RSI readings, market breadth, and price patterns can provide directional signals for the stock market. Here's what you should monitor as the market goes through a relatively volatile period....
READ MORE
MEMBERS ONLY
Pre-FOMC Setup: S&P 500 Calm Before the Fed
by Frank Cappelleri,
Founder & President, CappThesis, LLC
Frank Cappelleri analyzes the S&P 500’s unusual calm ahead of the Fed, highlighting trend signals, failed bearish patterns, and key GoNoGo charts....
READ MORE
MEMBERS ONLY
6,555 Target Hit!
by Frank Cappelleri,
Founder & President, CappThesis, LLC
Despite skepticism, the S&P reached Frank's upside target of 6,555. Frank breaks down how we got here and what it means for ongoing market patterns....
READ MORE
MEMBERS ONLY
The Market's Tug-of-War: How to Read the S&P 500's Hammer Signals
by Frank Cappelleri,
Founder & President, CappThesis, LLC
Back-to-back hammer candlesticks in the S&P 500 are sending a message. Here's what these signals mean, why the market feels stuck, and what investors should watch for next....
READ MORE
MEMBERS ONLY
S&P 500 Breakouts, Bitcoin Risks & Uber’s Next Move
by Frank Cappelleri,
Founder & President, CappThesis, LLC
In this market update, Frank takes a close look at the S&P 500, key indices, ETFs, crypto, and a recent trade idea. Frank compares the 2025 market to 2020 patterns, reviewing corrections and highlighting bullish and bearish setups. He focuses on weekly Bollinger Bands, GoNoGo charts, sector performance...
READ MORE
MEMBERS ONLY
Short-Term Market Swings: A Gentle Rhythm of Short-Term Bounces
by Frank Cappelleri,
Founder & President, CappThesis, LLC
Get the latest S&P 500 analysis with a focus on RSI negative divergence, short-term swing setups, and market breadth trends. Learn what current patterns mean and how to spot the next move....
READ MORE
MEMBERS ONLY
Smart Investors are Watching These Chart Signals: Here's Why
by Frank Cappelleri,
Founder & President, CappThesis, LLC
Discover what Bollinger Bands and RSI are signaling for the S&P 500. Learn how low volatility and key momentum indicators could point to the next market breakout....
READ MORE
MEMBERS ONLY
S&P 500 Breaking Out Again: What This Means for Your Portfolio
by Frank Cappelleri,
Founder & President, CappThesis, LLC
The S&P 500 ($SPX) just logged its fifth straight trading box breakout, which means that, of the five trading ranges the index has experienced since the April lows, all have been resolved to the upside.
How much longer can this last? That's been the biggest question...
READ MORE
MEMBERS ONLY
Four Symbols, One Big Message: What the Charts are Telling Us
by Frank Cappelleri,
Founder & President, CappThesis, LLC
From the S&P 500's pause within a bullish trend, to critical support levels in semiconductors, plus bullish breakouts in Ethereum and Bitcoin, Frank highlights how the market's recent consolidation may lead to major upside. In this video, Frank explores how to use StockCharts to...
READ MORE
MEMBERS ONLY
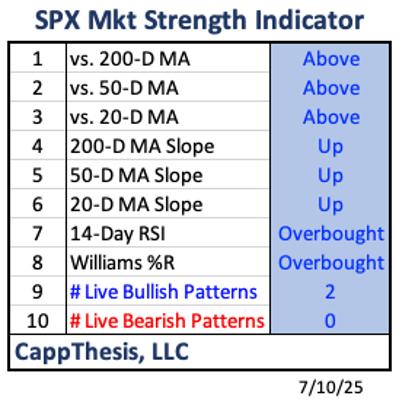
The CappThesis Market Strength Indicator: What It's Telling Us Now
by Frank Cappelleri,
Founder & President, CappThesis, LLC
KEY TAKEAWAYS
* The S&P 500 has been holdign above 6.200 for a week and hte Market Strength Indicator (MSI) is showing strong bullish momentum.
* While the MSI is highly bullish, history tells us that extreme readings often precede a pause or short-term pullback.
* Even with the potential...
READ MORE
MEMBERS ONLY
Market Signals Align - Is a Bigger Move Ahead?
by Frank Cappelleri,
Founder & President, CappThesis, LLC
This week, Frank analyzes recent technical signals from the S&P 500, including overbought RSI levels, key price target completions, and the breakout potential of long-term bullish patterns. He examines past market breakouts and trend shifts, showing how overbought conditions historically play out. Frank also walks through a compelling...
READ MORE
MEMBERS ONLY
Breakdown of NVDA's Stock Price and S&P 500: Actionable Technical Insights
by Frank Cappelleri,
Founder & President, CappThesis, LLC
The S&P 500 ($SPX) just logged its second consecutive 1% gain on Tuesday. That's three solid 1% advances so far in June. And with a few trading days remaining in the month, the index has recorded only one 1% decline so far.
A lot can still...
READ MORE
MEMBERS ONLY
3 S&P 500 Charts That Point to the Next Big Move
by Frank Cappelleri,
Founder & President, CappThesis, LLC
Follow along with Frank as he presents the outlook for the S&P 500, using three key charts to spot bullish breakouts, pullback zones, and MACD signals. Frank compares bearish and bullish setups using his pattern grid, analyzing which of the two is on top, and explains why he&...
READ MORE
MEMBERS ONLY
What the S&P 500, VIX, and ARKK are Telling Us Now
by Frank Cappelleri,
Founder & President, CappThesis, LLC
While the S&P 500 ($SPX) logged a negative reversal on Wednesday, the Cboe Volatility Index ($VIX), Wall Street's fear gauge, logged a positive reversal. This is pretty typical: when the S&P 500 falls, the VIX rises.
Here's what makes it interesting: the...
READ MORE
MEMBERS ONLY
Clusters of Long Winning Streaks: What They're Telling Us
by Frank Cappelleri,
Founder & President, CappThesis, LLC
Recently, the S&P 500 ($SPX) has been racking up a good number of wins.
Since late April, the index has logged its third winning streak of at least five: a nine-day streak from April 22–May 2 and a six-day streak from May 12–May 19. That makes...
READ MORE
MEMBERS ONLY
S&P 500 Bullish Patterns: Are Higher Highs Ahead?
by Frank Cappelleri,
Founder & President, CappThesis, LLC
In this market update, Frank breaks down recent developments across the S&P 500, crypto markets, commodities, and international ETFs. He analyzes bullish and bearish chart patterns, identifies key RSI signals, and demonstrates how "Go No Go Charts" can support your technical analysis. You'll also...
READ MORE
MEMBERS ONLY
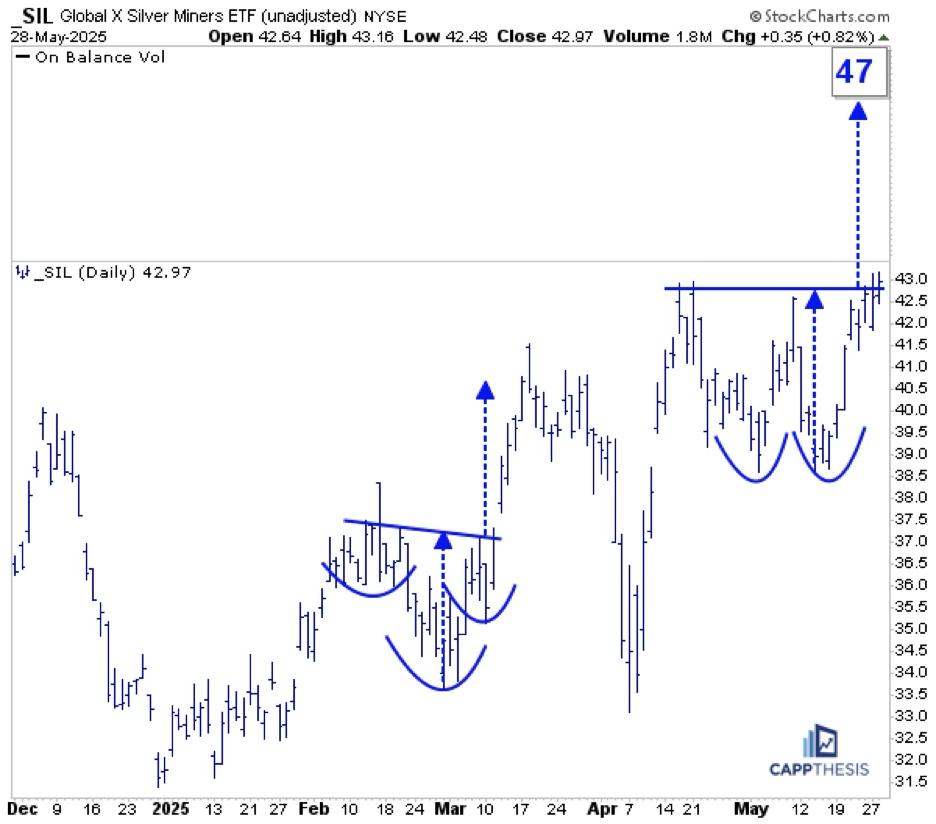
Analyzing SIL, USO, and NVDA: Could These Bullish Patterns Trigger?
by Frank Cappelleri,
Founder & President, CappThesis, LLC
SIL Silver Miners
SIL was among the leaders yesterday and now is close to triggering this double-bottom bullish pattern. Staying above the 43-mark would target 47. That's not a big move, but let's remember that SIL is sporting bullish formations on its longer-term charts, too.
SIL...
READ MORE
MEMBERS ONLY
S&P 500 Slide Explained: What Past Price Action Reveals About Market Dips
by Frank Cappelleri,
Founder & President, CappThesis, LLC
On Wednesday, only 4% of the S&P 500's holdings logged gains — a pretty rare occurrence. Since the start of 2024, this has only happened three other times:
* August 5, 2024: The last day of the summer correction
* December 18, 2024: The Fed's hawkish cut...
READ MORE
MEMBERS ONLY
S&P 500, Bitcoin & XLK: What the Charts Are Saying Now
by Frank Cappelleri,
Founder & President, CappThesis, LLC
In this video, Frank dives into some of his favorite features on StockCharts.com. He then dissects the S&P 500 and Bitcoin price action, before exploring the the XLK Technology ETF's explosive move off the lows. He also highlights a few recent trade ideas and setups...
READ MORE
MEMBERS ONLY
The S&P 500 Snapped Back Hard: Now What?
by Frank Cappelleri,
Founder & President, CappThesis, LLC
KEY TAKEAWAYS
* The S&P 500's 14-week RSI hit its lowest point since the 2008 financial crisis.
* Sector ETFs like XLK (Technology) and XLI (Industrials) are showing bullish patterns.
* While the stock market's rapid reversal is encouraging, historical trends show that pullbacks often follow oversold...
READ MORE
MEMBERS ONLY
Fed Watch: Key Bullish Patterns in the S&P 500, Utilities, and Crypto
by Frank Cappelleri,
Founder & President, CappThesis, LLC
KEY TAKEAWAYS
* Bullish chart patterns, such as the inverse head-and-shoulders and cup with handle, are in play in the S&P 500.
* Utilities are breaking to new 50-day highs.
* Bitcoin and Ethereum continue to signal rising risk appetite.
The S&P 500 ($SPX) wrapped up Tuesday just below...
READ MORE