MEMBERS ONLY
COPPER AND GOLD HAVE BEEN TRENDING IN OPPOSITE DIRECTIONS FOR A YEAR -- BUT THEIR DIRECTION MAY BE CHANGING -- THE COPPER/GOLD RATIO IS BOUNCING OFF LONG-TERM SUPPORT -- RISING BOND YIELDS ALSO FAVOR COPPER OVER GOLD -- THAT'S A SIGN OF GROWING CONFIDENCE
by John Murphy,
Chief Technical Analyst, StockCharts.com
COPPER AND GOLD HAVE BEEN TRENDING IN OPPOSITE DIRECTIONS... A lot of recent intermarket rotations in global markets have started to show more optimism; along with a willingness to favor economically-sensitive and riskier assets at the expense of safe haven defensive ones. That has included the buying of stocks and...
READ MORE
MEMBERS ONLY
TRADE OPTIMISM PUSHES STOCK INDEXES FURTHER INTO RECORD TERRITORY -- SECTOR LEADERS ARE ENERGY, FINANCIALS, INDUSTRIALS, TECHNOLOGY, AND MATERIALS -- TEN-YEAR BOND YIELD TESTS SEPTEMBER HIGH AND PUSHES BOND PROXIES LOWER -- TRANSPORTS HIT 52-WEEK HIGHS
by John Murphy,
Chief Technical Analyst, StockCharts.com
STOCK INDEXES HIT NEW RECORDS... Optimism on trade between the U.S. and China is pushing risk assets higher and defensive ones lower. All three major U.S. stock indexes are hitting new records this morning. Chart 1 shows the S&P 500 in record territory. Eight sector SPDRs...
READ MORE
MEMBERS ONLY
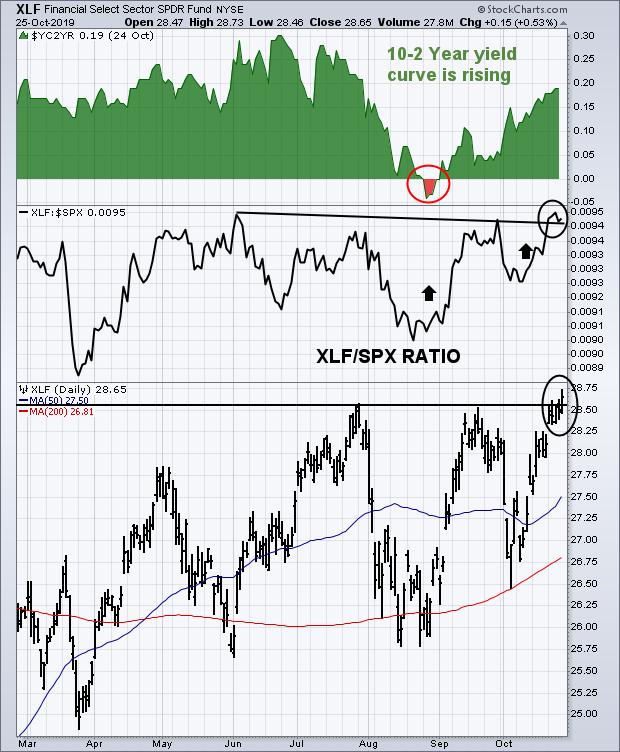
HIGHER BOND YIELDS AND A STEEPER YIELD CURVE PROBABLY ACCOUNT FOR RECENT STOCK ROTATIONS INTO FINANCIALS AND CYCLICAL STOCKS -- THAT MAY ALSO EXPLAIN RECENT BUYING OF SMALL CAPS AND TRANSPORTS -- AND WHY FINANCIALS ARE THE PAST MONTH'S STRONGEST SECTOR
by John Murphy,
Chief Technical Analyst, StockCharts.com
HIGHER BOND YIELDS STARTED ROTATION INTO FINANCIALS AND INDUSTRIALS... My message from two weeks ago (October 25) suggested that the recent rise in bond yields and the steeper yield curve over the last two months may explain several rotations with the stock market. The main focus was on financials which...
READ MORE
MEMBERS ONLY
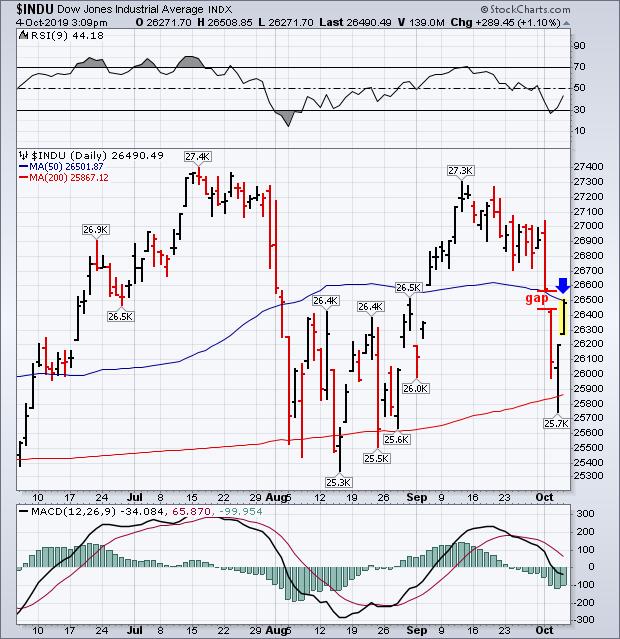
DOW JOINS OTHER MAJOR STOCK INDEXES IN RECORD TERRITORY -- TRANSPORTATION STOCKS NEAR UPSIDE BREAKOUT -- SO DOES THE RUSSELL 2000 SMALL CAP ISHARES -- FINANCIAL SPDR HITS NEW RECORD -- WITH A LOT OF HELP FROM BANKS AND HIGHER BOND YIELDS
by John Murphy,
Chief Technical Analyst, StockCharts.com
DOW JOINS OTHER MAJOR INDEXES IN RECORD TERRITORY...Chart 1 shows the Dow Industrials trading above their July high to put them in record territory. The Nasdaq and S&P 500 hit new records last week. Financials and materials are hitting new records today as well. Other leaders include...
READ MORE
MEMBERS ONLY
NASDAQ JOINS S&P 500 IN RECORD TERRITORY -- HEALTHCARE AND TECHNOLOGY HIT NEW RECORDS -- FINANCIALS NEAR TEST OF EARLY 2018 HIGH -- INDUSTRIAL SPDR HITS NEW RECORD ON FRIDAY -- CATERPILLAR TURNS UP -- FOREIGN STOCK INDEX ACHIEVES BULLISH BREAKOUT
by John Murphy,
Chief Technical Analyst, StockCharts.com
NASDAQ AND S&P 500 END IN RECORD TERRITORY...A strong jobs report on Friday (two days after the Fed cut rates for the third time this year) sent stock prices sharply higher. Chart 1 shows the S&P 500 hitting a new high on Friday for the...
READ MORE
MEMBERS ONLY
STOCKS AND BONDS CLOSE HIGHER ON DOVISH RATE CUT -- S&P 500 CLOSES AT NEW RECORD -- FALLING BOND YIELDS BOOST DIVIDEND-PAYING STOCKS AS BANKS PULL BACK -- DROP IN DOLLAR AND LOWER YIELDS BOOST GOLD -- VOLATILITY INDEX DROPS TO THREE-MONTH LOW
by John Murphy,
Chief Technical Analyst, StockCharts.com
FED RATE CUT AND DOVISH MESSAGE BOOST STOCK PRICES...The Fed lowered rates another quarter point today as expected, which was followed by a dovish sounding message from Mr. Powell. That pushed stock prices higher. Chart 1 shows the S&P 500 closing at another record high today. Chart...
READ MORE
MEMBERS ONLY
HEALTH CARE SPDR NEARS RECORD HIGH -- XLV HAS GONE FROM MARKET LAGGARD TO LEADER IN LAST TWO MONTHS -- ALL GROUPS ARE PARTICIPATING -- STOCK LEADERS INCLUDE HCA HEALTHCARE, INCYTE, BECKTON DICKINSON, AND MERCK
by John Murphy,
Chief Technical Analyst, StockCharts.com
HEALTH CARE SPDR NEARS RECORD HIGH...In a remarkable turnaround, the healthcare sector has gone from one of the year's worst performers to one of the strongest over the last couple of months. Chart 1 shows the Health Care SPDR (XLV) trading above its early July intra-day peak...
READ MORE
MEMBERS ONLY
SECTOR RANKINGS SHOW MORE OPTIMISM -- ENERGY, TECHNOLOGY, INDUSTRIALS, FINANCIALS, AND MATERIALS LEAD MARKET HIGHER -- ALL WORLD STOCK ISHARES HIT NEW RECORD -- FOREIGN STOCK ISHARES ARE CLOSE TO AN UPSIDE BREAKOUT
by John Murphy,
Chief Technical Analyst, StockCharts.com
SECTOR LEADERS...Chart 1 shows the weekly ranking for the eleven stock market sectors.Nine of them closed up for the week with only two losers. That reflects a generally higher market with major stock indexes nearing new records. The rankings also reflect a generally upbeat mood on the market...
READ MORE
MEMBERS ONLY
A Steeper Yield Curve May Explain Recent Rotation into Financial Stocks
by John Murphy,
Chief Technical Analyst, StockCharts.com
Editor's Note: This article was originally published in John Murphy's Market Message on Friday, October 25th at 5:04pm ET.
A lot of positive groups rotations have taken place in the stock market over the past two months.We've seen new money moving into...
READ MORE
MEMBERS ONLY
FINANCIALS AND BANKS ACHIEVE BULLISH BREAKOUTS TO LEAD MARKET HIGHER -- A STEEPER YIELD CURVE MAY EXPLAIN RECENT ROTATION INTO FINANCIAL STOCKS
by John Murphy,
Chief Technical Analyst, StockCharts.com
STEEPER YIELD CURVE SUPPORTS STRONG FINANCIAL STOCKS...A lot of positive group rotations have taken place in the stock market over the past two months.We've seen new money moving into domestic small caps stocks, as well as economically-sensitive transports. We've also seen cheaper value stocks...
READ MORE
MEMBERS ONLY
PHLX SOX INDEX SHOWS TWO ASCENDING TRIANGLES -- THE TECHNOLOGY SPDR AND QQQ SHOW SIMILAR BULLISH PATTERNS -- THE QQQ/SPX RATIO IS ALSO TRIANGULATING BETWEEN ITS APRIL HIGH AND MAY LOW
by John Murphy,
Chief Technical Analyst, StockCharts.com
SEMICONDUCTOR INDEX IS FORMING TWO TRIANGLES... A lot has been written lately about the formation of triangular patterns. Here are couple more applied to the same group. Chart 1 shows the Philadelphia Semiconductor Index ($SOX) moving up to test its flat trendline drawn over its July/September/October highs. The...
READ MORE
MEMBERS ONLY
EQUAL WEIGHT S&P 500 ETF IS ALSO NEARING A TEST OF ITS SUMMER HIGH -- AN UPSIDE BREAKOUT BY BOTH VERSIONS OF THE S&P 500 WOULD BE A POSITIVE SIGN -- RISING SMALL AND MID CAP STOCKS ARE GIVING A BOOST TO THE RSP AND MAY BE SENDING A POSITIVE SIGNAL
by John Murphy,
Chief Technical Analyst, StockCharts.com
BOTH S&P 500 ETFS ARE NEARING OLD HIGHS...Chart 1 shows the S&P 500 SPDR (SPY) moving closer to a test of its July/September highs. It would take a close above its September intra-day high at 301.24 to put it at a record high....
READ MORE
MEMBERS ONLY
S&P 500 NEARS TEST OF OVERHEAD RESISTANCE -- TRANSPORTS ARE OFF TO A STRONG START -- FINANCIALS LEAD MARKET HIGHER -- BANK OF AMERICA MAY BE BREAKING OUT -- STATE STREET SURGES -- STRONG FINANCIALS MAY BE BOOSTING SMALL CAPS
by John Murphy,
Chief Technical Analyst, StockCharts.com
STOCK INDEXES NEAR OLD HIGH...Stocks around the world are trading higher this morning. Chart 1 shows the S&P 500 nearing a test of a trendline drawn over its July/September highs. All other major stock indexes are also trending higher. A big drop in Boeing (BA), however,...
READ MORE
MEMBERS ONLY
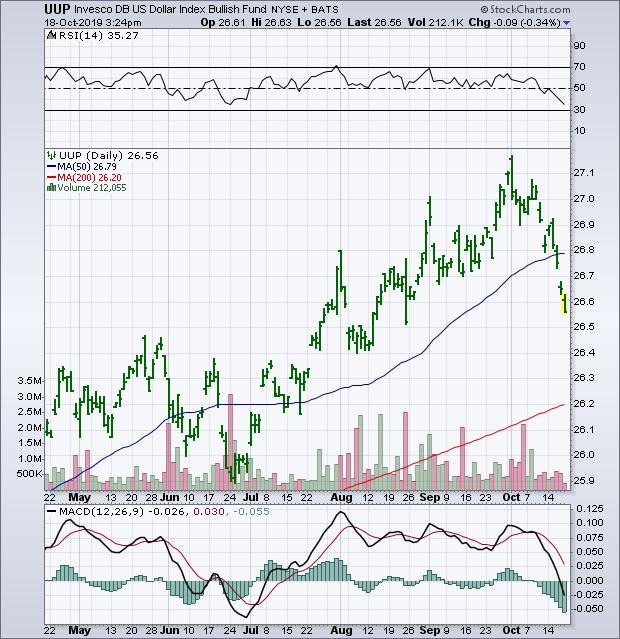
The Dollar Has Fallen This Week Against the Euro and Pound
by John Murphy,
Chief Technical Analyst, StockCharts.com
Editor's Note: This article was originally published in John Murphy's Market Message on Friday, October 18th at 4:23pm ET.
Chart 1 shows the Invesco US Dollar Index Fund (UUP) falling this week to the lowest level in two months. Most of that drop has come...
READ MORE
MEMBERS ONLY
THE DOLLAR HAS FALLEN THIS WEEK AGAINST THE EURO AND POUND -- BOTH CURRENCIES HAVE RALLIED ON HOPES FOR BREXIT SETTLEMENT -- EUROPEAN STOCK ETFS HAVE ALSO BEEN RISING -- THOSE GAINS, HOWEVER, COULD DEPEND ON SATURDAY VOTE IN PARLIAMENT
by John Murphy,
Chief Technical Analyst, StockCharts.com
DOLLAR FALLS AGAINST EURO AND POUND...Chart 1 shows the Invesco US Dollar Index Fund (UUP) falling this week to the lowest level in two months. Most of that drop has come against the Euro and British Pound. Chart 2 shows the British Pound rising to the highest level in...
READ MORE
MEMBERS ONLY
HEALTH INSURERS AND DRUG DISTRIBUTORS PUT HEALTHCARE SPDR NEAR THREE-MONTH HIGH -- UNITEDHEALTH GROUP AND HUMANA CLEAR 200-DAY LINES -- AMERISOURCEBERGEN, CARDINAL HEALTH, AND MCKESSON ARE HAVING A VERY STRONG CHART WEEK
by John Murphy,
Chief Technical Analyst, StockCharts.com
HEALTHCARE CONTINUES STRONG WEEK...Healthcare is the day's strongest sector for the second time this week. Chart 1 shows the Health Care SPDR (XLV) trading above a falling trendline drawn over its July/September highs; and putting the XLV close to the highest level in nearly four months....
READ MORE
MEMBERS ONLY
FACEBOOK AND GOOGLE LEAD COMMUNICATIONS TO ONE OF DAY'S STRONGEST SECTORS -- BOUNCING BOND YIELDS ARE PUSHING TREASURY BOND PRICES LOWER -- BUT HIGH YIELD BONDS ARE RISING
by John Murphy,
Chief Technical Analyst, StockCharts.com
COMMUNICATIONS SPDR HAS STRONG DAY...While healthcare and financials have been leading for most of the day, communication stocks have crept into second place in afternoon trading. Chart 1 shows the Communication Services SPDR (XLC) bouncing impressively off its 50-day average that it cleared just last week. It's...
READ MORE
MEMBERS ONLY
MAJOR STOCK INDEXES BUILD ON LAST WEEK'S GAINS -- HEALTHCARE PROVIDERS LEAD HEALTHCARE SPDR HIGHER LED BY UNITEDHEALTH -- RECORD HIGH BY JP MORGAN CHASE LEADS BANKS AND FINANCIALS HIGHER -- FALLING VIX ALSO SUPPORTS HIGHER STOCK PRICES
by John Murphy,
Chief Technical Analyst, StockCharts.com
MAJOR STOCK INDEXES BUILD ON RECENT GAINS...After a modest pullback yesterday, major U.S. stock indexes are building on last week's trade-inspired gains. Chart 1 shows the Dow Industrials trading at the highest level of the month this morning. The Dow appears headed toward the top of...
READ MORE
MEMBERS ONLY
STOCKS SOAR ON EXPECTED PARTIAL TRADE ACCORD BETWEEN U.S. AND CHINA -- INDUSTRIAL MINING SHARES LEAD MATERIALS HIGHER -- INDUSTRIALS, ENERGY, AND FINANCIALS ALSO LEAD -- BRITISH POUND HAS BIGGEST GAIN IN YEARS ON POSSIBLE BREXIT BREAKTHROUGH
by John Murphy,
Chief Technical Analyst, StockCharts.com
STOCK INDEXES SOAR ON TRADE HOPES...Stocks around the world are jumping sharply today on reports of a partial trade deal reached between the U.S. and China. Chart 1 shows the S&P 500 surging to the highest level this month to put it well above its 50-day...
READ MORE
MEMBERS ONLY
TEN-YEAR TREASURY YIELD IS BOUNCING TODAY -- LONG-TERM CHARTS SHOW TNX IN A LONG-TERM SUPPORT ZONE AND VERY OVERSOLD -- HIGHER BOND YIELDS ARE BOOSTING BANKS AND FINANCIAL STOCKS
by John Murphy,
Chief Technical Analyst, StockCharts.com
TEN-YEAR BOND YIELD IS BOUNCING OFF CHART SUPPORT...Global bond yields are bouncing today. The daily bars in Chart 1 show the 10-Year Treasury Yield rising 6 basis points to 1.65%. What makes that meaningful is that the TNX bounce is taking place from just above the previous low...
READ MORE
MEMBERS ONLY
STOCK INDEXES FLUCTUATE BETWEEN MOVING AVERAGE LINES AS TRADING RANGE CONTINUES -- TECH SECTOR SHOWS UPSIDE LEADERSHIP -- APPLIED MATERIALS AND LAM RESEARCH LEAD CHIPS HIGHER -- FINANCIALS NEED A BOOST FROM BOND YIELDS
by John Murphy,
Chief Technical Analyst, StockCharts.com
STOCK INDEXES REMAIN IN TRADING RANGE...The three major U.S. stock indexes shown below remain in a sideways trading range between their 50-day moving averages on top and 200-day lines below. And they continue to trade between their July highs and August lows. While the short-term picture remains indecisive,...
READ MORE
MEMBERS ONLY
Stock Indexes Try to Regain 50-Day Averages; The Nasdaq 100 QQQ Has Already Cleared Its Blue Line
by John Murphy,
Chief Technical Analyst, StockCharts.com
Editor's Note: This article was originally published in John Murphy's Market Message on Friday, September 4th at 3:11pm ET.
Stock prices are continuing the rebound that began with yesterday's upside reversal off their 200-day moving averages. And they're now trying to...
READ MORE
MEMBERS ONLY
STOCK INDEXES TRY TO REGAIN 50-DAY AVERAGES -- THE NASDAQ 100 QQQ HAS ALREADY CLEARED ITS BLUE LINE -- SO HAS THE TECH SPDR WHICH IS LEADING STOCKS HIGHER TODAY -- APPLE NEARS NEW RECORD HIGH
by John Murphy,
Chief Technical Analyst, StockCharts.com
STOCKS BUILD ON YESTERDAY'S REBOUND OFF THEIR 200-DAY AVERAGES... Stock prices are continuing the rebound that began with yesterday's upside reversal off their 200-day moving averages. And they're now trying to clear some overhead resistance. Chart 1 shows the Dow Industrials entering an overhead...
READ MORE
MEMBERS ONLY
STOCKS INDEXES SCORE UPSIDE REVERSAL NEAR AUGUST LOWS AND 200-DAY LINES -- TECHNOLOGY STOCKS LEAD NASDAQ REBOUND -- ALL ELEVEN SECTORS GAIN -- BUT STOCK INDEXES NEED MORE UPSIDE FOLLOW-THROUGH TO BUILD ON TODAY'S SUCCESSFUL TEST OF SUPPORT
by John Murphy,
Chief Technical Analyst, StockCharts.com
MAJOR STOCK INDEXES BOUNCE OFF CHART SUPPORT... After trading sharply lower today, stocks reversed upward to score a potential upside reversal day. And they did it at some critical support levels. Chart 1 shows the Dow Industrials bouncing off their 200-day moving average and chart support near their August lows....
READ MORE
MEMBERS ONLY
STOCK SELLING INTENSIFIES -- 50-DAY MOVING AVERAGES ARE BEING BROKEN -- A TEST OF SUMMER LOWS NOW APPEARS LIKELY
by John Murphy,
Chief Technical Analyst, StockCharts.com
MAJOR STOCK INDEXES MAY BE HEADED FOR TEST OF SUMMER LOWS...Stock prices are undergoing more short-term technical damage. All three major stock indexes shown below have fallen decisively below their 50-day averages. Which raises the likelihood for a test of their August lows, and 200-day moving averages (red arrows)...
READ MORE
MEMBERS ONLY
STOCKS TURN LOWER ON WEAK MANUFACTURING DATA -- MAJOR STOCK INDEXES WEAKEN -- WEAKEST SECTORS ARE INDUSTRIALS, MATERIALS, ENERGY, AND FINANCIALS -- TRANSPORTS FALL BELOW 200-DAY LINE -- SO DOES RUSSELL 2000 -- ONLINE BROKERS TUMBLE
by John Murphy,
Chief Technical Analyst, StockCharts.com
STOCK INDEXES ARE UNDER HEAVY SELLING PRESSURE...The weakest U.S. manufacturing number in ten years turned an early stock rebound into a bout of heavy selling. And the short-term stock picture continues to weaken. Chart 1 shows the Nasdaq Composite Index failing an early attempt to regain its 50-day...
READ MORE
MEMBERS ONLY
STOCK INDEXES PULL BACK FURTHER FROM SUMMER HIGH -- NASDAQ CONTINUES TO LOSE LEADERSHIP ROLE AS TECHNOLOGY SECTOR WEAKENS -- INTERNET STOCKS PULL COMMUNICATION SECTOR LOWER -- SELLING OF CHINESE STOCKS WAS A FACTOR -- BUT FACEBOOK ALSO HAD A BAD WEEK
by John Murphy,
Chief Technical Analyst, StockCharts.com
NASDAQ ENDS BELOW ITS 50-DAY AVERAGE...While the three major U.S. stock indexes pulled back further from their July high, the Nasdaq was by far the weakest performer. Chart 1 shows the Nasdaq Composite Index ending the week well below its 50-day moving average (blue line). In addition, its...
READ MORE
MEMBERS ONLY
HEAVY SELLING IN COMMUNICATION AND TECHNOLOGY STOCKS PUSH NASDAQ SHARPLY LOWER -- INTERNET AND SEMICONDUCTORS LEAD THE SELLING -- SO DO CHINESE STOCKS ON THREAT OF DE-LISTING
by John Murphy,
Chief Technical Analyst, StockCharts.com
NASDAQ COMPOSITE FALLS FURTHER BELOW ITS 50-DAY LINE... Chart 1 shows the Nasdaq Composite falling sharply today and moving further below its 50-day moving average. Selling in software and semiconductors are leading the decline in the technology sector. Communication stocks are also having a bad day. Chart 2 shows the...
READ MORE
MEMBERS ONLY
STOCKS REGAIN MOST OF YESTERDAY'S LOSSES -- MOVING AVERAGES HOLD FOR DOW AND S&P 500 -- NASDAQ REGAINS 50-DAY LINE -- SMALL CAPS AND TRANSPORTS ALSO BOUNCE OFF MOVING AVERAGE SUPPORT -- JUMP IN BOND YIELDS HELPED LIFT BANKS
by John Murphy,
Chief Technical Analyst, StockCharts.com
DOW AND SPX HOLD SUPPORT...NASDAQ REGAINS BLUE LINE...Stocks regained most of the previous day's losses. Chart 1 shows the Dow Industrials bouncing off their 20-day average. Chart 2 shows the S&P 500 holding support at its 50-day line. The Nasdaq turned in an even...
READ MORE
MEMBERS ONLY
STOCKS UNDERGO MORE SELLING -- NASDAQ CLOSES BELOW 50-DAY AVERAGE -- DROP IN BOND YIELDS PUSHES UTILITIES TO NEW RECORD WHILE BANK STOCKS WEAKEN -- WEAKEST SECTORS ARE ENERGY, COMMUNICATIONS, CONSUMER CYCLICALS, AND TECHNOLOGY
by John Murphy,
Chief Technical Analyst, StockCharts.com
STOCK INDEXES LOSE MORE GROUND...Majorstock indexes moved further away from their July peak today and some short-term chart damage was done, especially in the Nasdaq market. Chart 1 shows the Dow Jones Industrial Average losing -142 points (-0.53%) and ending right on its 20-day average (green line); its...
READ MORE
MEMBERS ONLY
STOCK INDEXES STALL NEAR SUMMER HIGH -- A LOT OF OVERHEAD RESISTANCE LEVELS ARE BEING TESTED -- TRANSPORTS AND SMALL CAPS BACK OFF ALONG WITH FINANCIALS -- SAFE HAVENS TAKE BACK THE LEAD AS BOND YIELDS DROP -- CONSUMER CYCLICALS ARE WEAKEST SECTOR
by John Murphy,
Chief Technical Analyst, StockCharts.com
STOCK INDEXES STALL NEAR JULY HIGH...Stocks ended the week with minor losses after meeting some resistance along their July high. Chart 1 shows the Dow Industrials consolidating just below their summer high, but remaining well above chart support and moving average lines. Chart 2 shows the S&P...
READ MORE
MEMBERS ONLY
MAJOR STOCK INDEXES ARE HEADED FOR TEST OF SUMMER HIGH -- STRONG TECH SECTOR IS PUTTING THE NASDAQ IN THE LEAD -- MICROSOFT HITS NEW RECORD TO LEAD MARKER HIGHER
by John Murphy,
Chief Technical Analyst, StockCharts.com
MAJOR STOCK INDEXES NEAR SUMMER HIGHS...Major U.S. stock indexes are trading higher today and approaching a test of their summer highs. Chart 1 shows the Dow Industrials continuing its bounce from yesterday afternoon and maintaining its bullish bias. Chart 2 shows the S&P 500 doing the...
READ MORE
MEMBERS ONLY
FED CUTS RATE A QUARTER POINT AS EXPECTED BUT APPEARS SPLIT ON FURTHER CUTS -- TWO-YEAR YIELD REBOUNDS WHILE 10-YEAR STABILIZES AFTER CUT -- STOCKS RECOVER FROM EARLIER LOSSES -- BANKS HAVE A STRONG DAY -- DOLLAR STRENGTHS AS COMMODITIES DROP
by John Murphy,
Chief Technical Analyst, StockCharts.com
STOCKS RECOVER EARLY LOSSES...Stocks recovered from initial selling after today's quarter point rate cut. Chart 1 shows the Dow Industrials ending 36 points (+0.13%) higher today to reverse earlier losses. The S&P 500 also closed modestly higher; while the Nasdaq ended modestly lower. Sector...
READ MORE
MEMBERS ONLY
ATTACK ON SAUDI OIL FACILITIES PUSHES CRUDE OIL AND ENERGY SHARES SHARPLY HIGHER -- CAUSING MINOR PROFIT-TAKING IN STOCKS -- FUEL-SENSITIVE AIRLINES DROP -- SMALL CAPS GAIN MORE GROUND -- BONDS AND GOLD REBOUND -- THE DJ US DEFENSE INDEX HITS A NEW RECORD
by John Murphy,
Chief Technical Analyst, StockCharts.com
CRUDE OIL AND ENERGY SHARES JUMP...As expected, the weekend attack on Saudi Arabia's oil facilities pushed the price of oil sharply higher today and in very heavy trading. Chart 1 shows the United States Oil Fund (USO) surging 12% to the highest level in four months. Energy...
READ MORE
MEMBERS ONLY
SHARP REBOUND IN BOND YIELDS CONTRIBUTES TO ROTATION INTO VALUE STOCKS -- WITH SMALL CAP VALUE ISHARES IN THE LEAD -- STRONGER FINANCIALS AND INDUSTRIALS ARE MAIN REASONS WHY
by John Murphy,
Chief Technical Analyst, StockCharts.com
TEN-YEAR TREASURY YIELD BOUNCES OFF MAJOR CHART SUPPORT... My Wednesday message showed the 10-Year Treasury yield bouncing off major chart support at its 2012 and 2016 lows and in a very oversold condition. That made a rebound in bond yields more likely. The weekly bars in Chart 1 show the...
READ MORE
MEMBERS ONLY
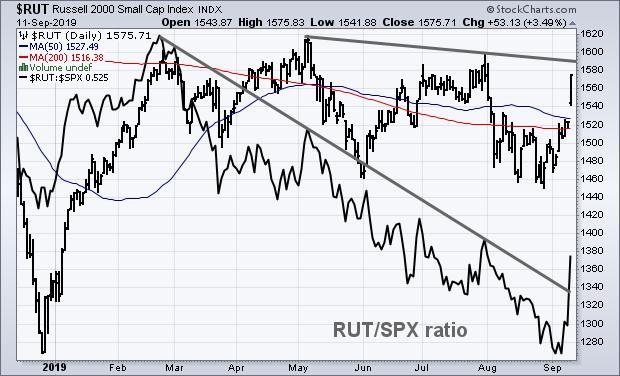
Small Caps Surge and Reflect Rotation into Cheaper Parts of the Market
by John Murphy,
Chief Technical Analyst, StockCharts.com
Editor's Note: This article was originally published in John Murphy's Market Message on Wednesday, September 11th at 5:14pm ET.
Smaller stocks were the stars of today's stock action. Previous messages have noted signs of improvement in the group which has lagged behind large...
READ MORE
MEMBERS ONLY
STOCK RALLY RESUMES AS MAJOR STOCK INDEXES DRAW CLOSER TO SUMMER HIGH -- BOEING, APPLE, AND CATERPILLAR LEAD DOW HIGHER -- THE INDUSTRIAL SPDR IS NEARING A MAJOR UPSIDE BREAKOUT TO RECORD HIGHS -- SMALL CAPS WERE THE DAY'S BIGGEST GAINERS
by John Murphy,
Chief Technical Analyst, StockCharts.com
STOCK INDEXES GAIN MORE GROUND... The stock upturn that started last week when major stock indexes cleared their August trading range and 50-day averages gained momentum today. All three major indexes hit the highest level in more than a month. Chart 1 shows the Dow Industrials gaining 227 points (+0....
READ MORE
MEMBERS ONLY
TEN-YEAR TREASURY YIELD IS BOUNCING OFF MAJOR SUPPORT -- BOND/STOCK RATIO ALSO RUNS INTO RESISTANCE AND HAS STARTED TO WEAKEN -- THAT WOULD FAVOR STOCKS OVER BONDS -- RECENT SECTOR ROTATIONS SHOW A SHIFT TO MORE ECONOMICALLY-SENSITIVE STOCK GROUPS
by John Murphy,
Chief Technical Analyst, StockCharts.com
TEN-YEAR TREASURY YIELD IS TESTING MAJOR SUPPORT...Bond yields have been falling all over the world since the end of last year. Several foreign government bond yields have fallen deeply into negative territory and have helped pull Treasury yields lower. The 30-Year Treasury Yield recently fell to a new record...
READ MORE
MEMBERS ONLY
TRANSPORTATION STOCKS MOVE INTO HIGHER GEAR -- DOW TRANSPORTS NEAR TEST OF MAJOR RESISTANCE LINE -- CH ROBINSON AND JB HUNT ARE TRUCK LEADERS -- KIRBY CORP IS MARINE TRANSPORTATION LEADER -- UTILITIES AND REITS LOSE GROUND ON RISING BOND YIELDS
by John Murphy,
Chief Technical Analyst, StockCharts.com
DOW TRANSPORTS NEAR TEST OF OVERHEAD RESISTANCE...After lagging behind the rest of the market for most of the past year, transportation stocks are starting to show new life. Chart 1 shows the Dow Jones Transportation Average surging more than 1% today to the highest level in more than a...
READ MORE
MEMBERS ONLY
ENERGY AND FINANCIALS JUMP ON FLAT MARKET DAY -- RISING OIL PRICE LIFTS OIL SERVICE STOCKS -- HIGHER BOND YIELDS PUSH BANK STOCKS SHARPLY HIGHER -- STRONGER FINANCIAL STOCKS HELP BOOST SMALL CAPS -- RUSSELL 2000 INDEX CLOSES ABOVE ITS 200-DAY LINE
by John Murphy,
Chief Technical Analyst, StockCharts.com
RISING OIL PRICE BOOSTS ENERGY STOCKS...A jump in crude oil helped make energy the strongest sector on a generally flat market day. Chart 1 shows the Energy SPDR (XLE) climbing 2% to the highest level in a month (on rising volume), and showing upside leadership for the the first...
READ MORE