MEMBERS ONLY
FALLING FOREIGN BOND YIELDS ARE PULLING TREASURY YIELDS LOWER -- GLOBAL STOCK INDEXES HAVE A STRONG WEEK AND NEAR UPSIDE BREAKOUTS -- FALLING YIELDS AND A WEAKER DOLLAR PUSH GOLD TO SIX-YEAR HIGH -- GOLD MINERS ALSO HAD A BREAKOUT WEEK
by John Murphy,
Chief Technical Analyst, StockCharts.com
NEGATIVE FOREIGN YIELDS LEAD TREASURY YIELDS LOWER...Bond yields are dropping all over the world. The British 10-Year yield fell this week to the lowest level since 2016 (0.80%). The Japanese yield remains in negative territory. Nearly a quarter of bond yields in global developed markets are already negative...
READ MORE
MEMBERS ONLY
FED LEAVES RATES UNCHANGED BUT SETS STAGE FOR JULY RATE CUT -- BOND AND STOCK PRICES GAIN -- BIG DROP IN BOND YIELDS WEAKENS BANK STOCKS -- WEAK DOLLAR PUSHES GOLD TO NEW HIGH FOR THE YEAR -- HEALTHCARE SPDR ACHIEVES BULLISH BREAKOUT
by John Murphy,
Chief Technical Analyst, StockCharts.com
STOCKS GAIN ON EXPECTED RATE CUT... The Fed left rates unchanged today, but dropped the word "patient" from its statement, and gave the strong impression that a rate cut is likely. Fed fund futures are betting on a rate cut in July. That sent bond and stock prices...
READ MORE
MEMBERS ONLY
REGIONAL BANK LEADERS INCLUDE SUNTRUST, CITIZENS FINANCIAL, AND BB&T -- ALL THREE APPEAR TO BE FORMING SYMMETRICAL TRIANGLES
by John Murphy,
Chief Technical Analyst, StockCharts.com
TRIANGLES ON DISPLAY...Today's earlier message showed the S&P Bank SPDR (KBE) trying to rise above its 200-day moving average. It also mentioned that regional banks were leading today's bank rebound. While drilling down through some regional bank charts, I noticed that many of...
READ MORE
MEMBERS ONLY
HEALTHCARE SPDR NEARS UPSIDE BREAKOUT -- DRUG STOCKS ARE ALSO BREAKING OUT -- BANKS RALLY ON FED DAY
by John Murphy,
Chief Technical Analyst, StockCharts.com
HEALTHCARE SPDR NEARS UPSIDE BREAKOUT...Money has been flowing into healthcare stocks since the end of April. And the sector may be on the verge of a bullish breakout. The daily bars in Chart 1 show the Health Care SPDR (XLV) testing its early March intra-day peak at 93.10....
READ MORE
MEMBERS ONLY
Monthly Sector Rankings Show Defensive Leadership
by John Murphy,
Chief Technical Analyst, StockCharts.com
Editor's Note: This article was originally published in John Murphy's Market Message on Friday, June 14th at 1:20pm ET.
Chart 1 is taken from the Sector Summary page for the past month. And it shows that investors are still gravitating toward defensive issues. Four of...
READ MORE
MEMBERS ONLY
MONTHLY SECTOR RANKINGS SHOW DEFENSIVE LEADERSHIP THAT INCLUDES UTILITIES, HEALTH CARE, REAL ESTATE, AND CONSUMER STAPLES -- GOLD MINERS LED MATERIALS HIGHER -- HOMEBUILDERS ARE LEADING CONSUMER DISCRETIONARY SECTOR HIGHER TODAY
by John Murphy,
Chief Technical Analyst, StockCharts.com
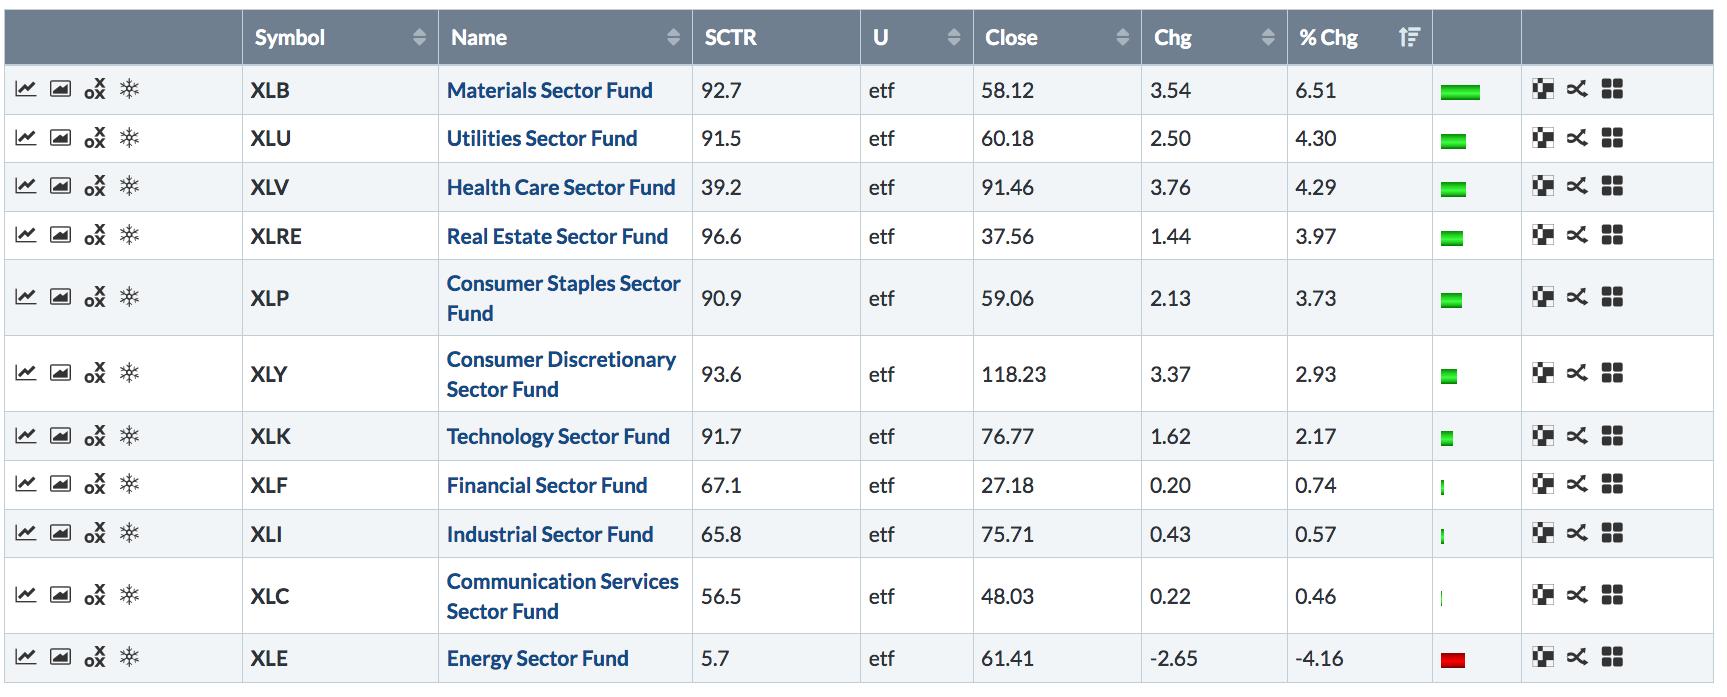
MONTHLY PERFORMANCE SHOWS DEFENSIVE LEADERSHIP...Chart 1 is taken from the Sector Summary page for the past month. And it shows that investors are still gravitating toward defensive issues. Four of the top sectors are utilities, health care, real estate, and consumer staples. All four are defensive in nature. Even...
READ MORE
MEMBERS ONLY
GOLD SHARES ARE RISING WITH THE METAL -- AND ARE NEARING A TEST OF 2019 HIGHS -- THE FACT THAT GOLD MINERS ARE RISING FASTER THAN BULLION IS ANOTHER POSITIVE SIGN
by John Murphy,
Chief Technical Analyst, StockCharts.com
GOLD MINERS ETF NEARS TEST OF 2019 HIGH...Yesterday's message wrote about the price of gold being in the late stages of a potential bottoming formation. It also suggested that three intermarket forces were working in gold's favor. They include a weaker dollar, falling interest rates,...
READ MORE
MEMBERS ONLY
INTERMARKET TRENDS ARE STARTING TO FAVOR GOLD -- A WEAKER DOLLAR IS ONE OF THEM -- AND FALLING INTEREST RATES -- GOLD HAS DONE BETTER OVER THE LAST YEAR WHEN STOCKS HAVE WEAKENED -- GOLD IS TESTING MAJOR OVERHEAD RESISTANCE
by John Murphy,
Chief Technical Analyst, StockCharts.com
A WEAKER DOLLAR INCREASES APPEAL OF GOLD... The brown monthly bars in Chart 1 show the price of gold forming a potential bottoming formation that started nearly four years ago when it hit bottom in late 2015. Since then, the price of bullion has traded between that low and a...
READ MORE
MEMBERS ONLY
THE McCLELLAN OSCILLATOR TURNED POSITIVE THIS WEEK -- THAT'S BOOSTING THE McCLELLAN SUMMATION INDEX AND KEEPING ITS 2019 UPTREND INTACT -- BOTH ARE MEASURES OF MARKET BREADTH
by John Murphy,
Chief Technical Analyst, StockCharts.com
BOTH McCLELLAN BREATH INDICATORS TURN UP... Chart 1 includes two breadth indicators that work together. Both are compared to the NYSE Composite Index (upper box). The dashed line in the lower part of the chart plots the McClellan Summation Index. That's a long term measure of market breadth....
READ MORE
MEMBERS ONLY
STOCKS START THE WEEK ON A STRONG NOTE
by John Murphy,
Chief Technical Analyst, StockCharts.com
STOCK INDEXES CLEAR 50-DAY AVERAGES... Stocks are starting the week on a strong note. Charts 1 and 2 show the Dow and S&P 500 trading above their 50-day averages. The Dow has also cleared initial resistance at 26,000. Chart 2 shows the SPX also exceeding overhead resistance...
READ MORE
MEMBERS ONLY
DOW ENDS WEEK ON A STRONG NOTE -- TECHNOLOGY LEADS FRIDAY RALLY
by John Murphy,
Chief Technical Analyst, StockCharts.com
DOW ENDS WEEKLY LOSING STREAK The Dow Industrials gained 263 points today (1.02%) to end the week on a strong note. That also ends a six-week losing streak for the blue chip index. Chart 1 shows the Dow regaining its 200-day average on Wednesday, and ending the week right...
READ MORE
MEMBERS ONLY
10-YEAR TREASURY YIELD HEADED TOWARD TEST OF 2017 LOW -- THAT'S HELPING PUSH DIVIDEND PAYING STOCK SECTORS INTO RECORD TERRITORY -- BUT IS CAUSING BANKS TO LAG BEHIND
by John Murphy,
Chief Technical Analyst, StockCharts.com
10-YEAR TREASURY YIELD NEARS TEST OF 2017 LOW... The 10-Year Treasury yield is falling another 6 basis points today to 2.06% which is drawing dangerously close to its 2017 low. The weekly bars in Chart 2 show that year's intra-day yield low at 2.03%. Its lowest...
READ MORE
MEMBERS ONLY
PHARMACEUTIALS LEAD HEALTH CARE SPDR TO POSSIBLE UPSIDE BREAKOUT -- DRUG LEADERS ARE ABBOTT LABS, MERCK, AND PFIZER -- MEDICAL EQUIPMENT STOCKS ALSO LOOK STRONG -- THAT INCLUDES BOSTON SCIENTIFIC, MEDTRONIC, AND THERMO FISHER SCIENTIFIC
by John Murphy,
Chief Technical Analyst, StockCharts.com
HEALTHCARE SPDR MAY BE TURNING UP ... The health care sector may be nearing an upside breakout. The daily bars in Chart 1 shows the Health Care SPDR (XLV) trading above its 200-day average in today's trading; and testing its late May intra-day peak at 90.18. A close...
READ MORE
MEMBERS ONLY
STOCKS RALLY ON INCREASED HOPE FOR A RATE CUT -- S&P 500 REGAINS 200-DAY LINE -- TECHNOLOGY AND CYCLICAL SPDRS HOLD THEIR 200-DAY LINES -- WHILE FINANCIALS, INDUSTRIALS, AND MATERIALS REGAIN THEIR RED LINES -- VIX FALLS FURTHER BELOW 20
by John Murphy,
Chief Technical Analyst, StockCharts.com
S&P 500 TRADES BACK OVER ITS 200-DAY AVERAGE... A combination of a short-term oversold condition and dovish sounding comments from the head of the Fed are giving a big lift to stocks today. All major indexes are are showing strong gains with the Nasdaq in the lead (+2....
READ MORE
MEMBERS ONLY
There's a Reason Why Banks and Energy Stocks are Falling Together - And That Reason May be Falling Oil Prices
by John Murphy,
Chief Technical Analyst, StockCharts.com
Editor's Note: This article was originally published in John Murphy's Market Message on Friday, May 31st at 11:14am ET.
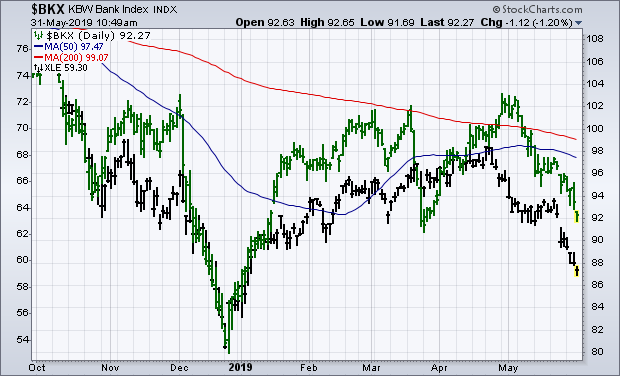
Energy stocks are one of the weakest parts of the market. So are bank stocks. There may be a reason why. The black bars in Chart...
READ MORE
MEMBERS ONLY
THREAT OF MEXICAN TARIFFS PUSHES GLOBAL STOCKS LOWER -- 200-DAY AVERAGES ARE BEING BROKEN -- AUTOS ARE BEING HIT ESPECIALLY HARD -- INCLUDING GENERAL MOTORS -- THERE'S A REASON WHY BANKS AND ENERGY STOCKS ARE FALLING TOGETHER
by John Murphy,
Chief Technical Analyst, StockCharts.com
200-DAY AVERAGES ARE BEING BROKEN... The threat of tariffs on Mexican imports is rattling global markets today. And more technical damage is being done. Chart 1 shows the Dow Industrials falling below their March low near 25,200. That puts the Dow at the lowest level since late January. Chart...
READ MORE
MEMBERS ONLY
FALLING BOND YIELDS CAUSE FLIGHT TO SAFETY OF TREASURY BONDS -- TEN YEAR - 3 MONTH YIELD CURVE INVERTS -- STOCKS CONTINUE TO WEAKEN -- DOW TRADES BELOW ITS 200-DAY AVERAGE -- NASDAQ AND S&P 500 ARE THREATENING THEIR RED LINES
by John Murphy,
Chief Technical Analyst, StockCharts.com
TEN-YEAR TREASURY YIELD MAY BE HEADING TO 2%... The surprising drop in global bond yields is continuing. The weekly bars in Chart 1 shows the 10-Year Treasury Yield falling today to 2.22% which is the lowest level since September 2017. The weekly bars in Chart 1 show the next...
READ MORE
MEMBERS ONLY
HEALTHCARE SPDR IS TRYING TO CLEAR MOVING AVERAGE LINES -- MEDTRONIC AND BOSTON SCIENTIFIC LEAD MEDICAL EQUIPMENT GROUP HIGHER -- MERCK AND MCKESSON ARE DRUG LEADERS -- TECH SECTOR IS ONE OF MAY'S WEAKEST GROUPS
by John Murphy,
Chief Technical Analyst, StockCharts.com
HEALTHCARE IS GETTING BETTER ... While a lot of attention is being given to stock market swings over the last month, and recent selling in everything related to tariffs and global trade, one group has been quietly getting stronger. And that's healthcare. Healthcare remains this year's weakest...
READ MORE
MEMBERS ONLY
STOCK SELLING INTENSIFIES -- DOW TRADES BELOW ITS 200-DAY AVERAGE -- NASDAQ AND S&P 500 ARE DROPPING TOWARD THEIR 200-DAY LINES -- IF THEY DON'T HOLD, A TEST OF THEIR MARCH LOWS WOULD BE NEXT
by John Murphy,
Chief Technical Analyst, StockCharts.com
TRADE TENSIONS CONTINUE TO WEIGH ON STOCKS... Stocks are under heavy selling pressure today. Energy stocks are leading the market lower with a drop of more than -3%, while oil is dropping nearly twice as much. Technology, industrials, and financials are down -2% or more. As has been the case...
READ MORE
MEMBERS ONLY
DOW TRANSPORTS FALL BELOW 200-DAY AVERAGE -- AMERICAN AIRLINES, FEDEX, AND JB HUNT ARE LEADING IT LOWER -- WHILE UTILITIES REACH NEW RECORD -- TECHS, INDUSTRIALS, AND CYCLICALS WEAKEN DURING MAY -- WHILE DEFENSIVE GROUPS TAKE LEADERSHIP ROLE
by John Murphy,
Chief Technical Analyst, StockCharts.com
DOW TRANSPORTS FALL BACK BELOW 200-DAY LINE... Transportation stocks are one of the weakest parts of the market today. Chart 1 shows the Dow Jones Transportation Average now trading below its 50- and 200-day moving averages. Not surprisingly, tranports are also showing relative weakness. The blue line in Chart 1...
READ MORE
MEMBERS ONLY
Weekly Sector Rankings Show a Defensive Market
by John Murphy,
Chief Technical Analyst, StockCharts.com
Editor's Note: This article was originally published in John Murphy's Market Message on Friday, May 17th at 4:49pm ET.
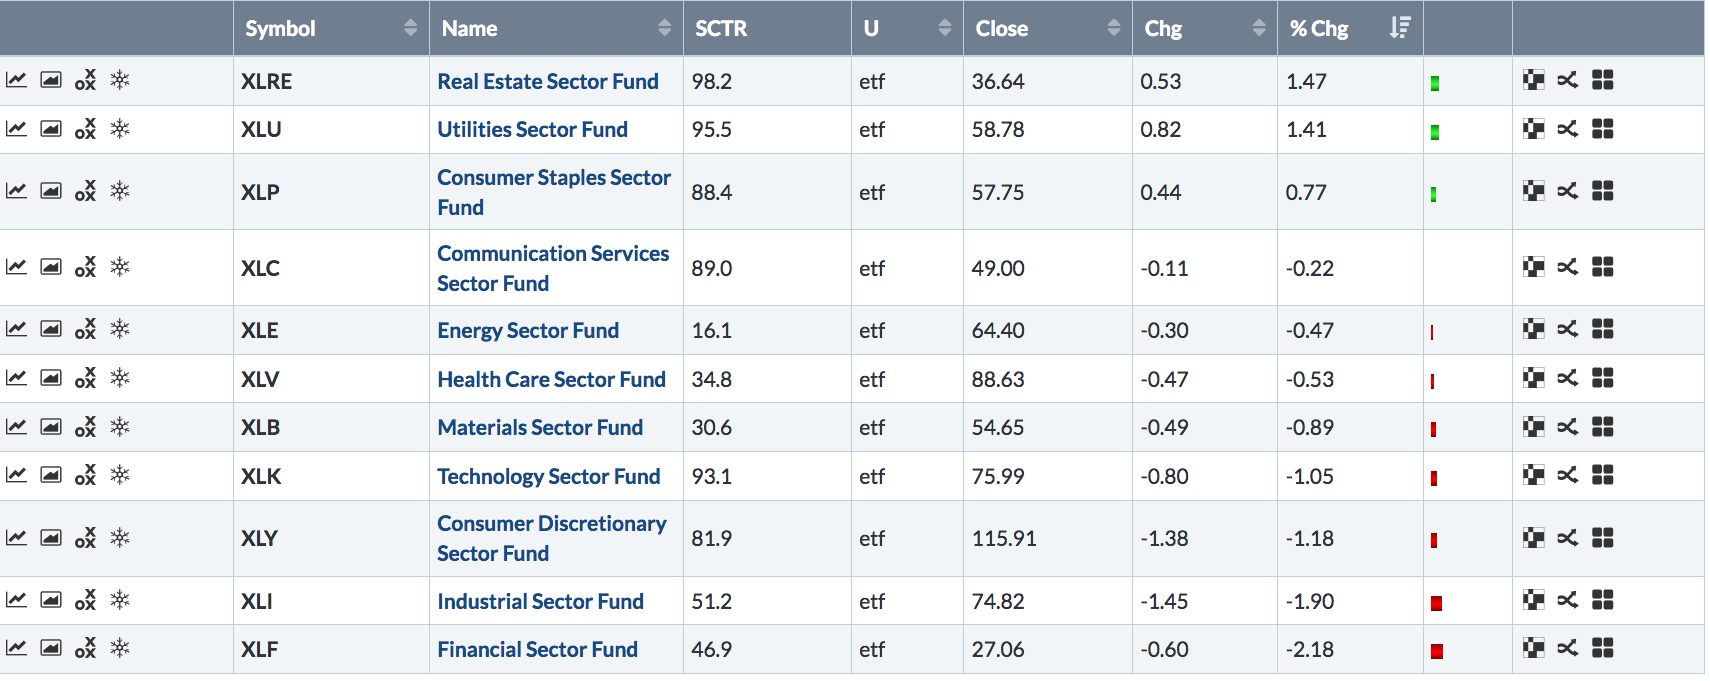
The table in Chart 1 plots the relative performance of the eleven market sectors for the week. And they show a generally defensive market. That can...
READ MORE
MEMBERS ONLY
WEEKLY SECTOR RANKINGS SHOW A DEFENSIVE MARKET -- SAFE HAVENS WERE MARKET LEADERS -- WHILE TRADE SENSITIVE GROUPS FELL THE MOST -- FINANCIALS WERE THE WEEK'S WORST PERFORMERS -- FALLING BOND YIELDS HAVE HURT BANKS WHILE BOOSTING HOMEBUILDERS
by John Murphy,
Chief Technical Analyst, StockCharts.com
WEEKLY SECTOR RANKINGS SHOW DEFENSIVE MARKET ... The table in Chart 1 plots the relative performance of the eleven market sectors for the week. And they show a generally defensive market. That can be seen by the fact that REITs, utilities, and consumer staples are the three top sectors for the...
READ MORE
MEMBERS ONLY
AMAZON.COM AND LENNAR LEAD CONSUMER DISCRETIONARY SECTOR HIGHER -- ADOBE AND CISCO LEAD TECHNOLOGY -- DRUG STOCKS BOOST HEALTHCARE -- MERCK IS LEADING -- NASDAQ AND S&P 500 REGAIN 50-DAY LINES AS ALL ELEVEN SECTORS GAIN GROUND
by John Murphy,
Chief Technical Analyst, StockCharts.com
CONSUMER DISCRETIONARY SPDR REGAINS 50-DAY LINE... Stocks are having another strong day today with all eleven market sectors in the red. Cyclical stocks are helping lead it higher. Chart 1 shows the Consumer Discretionary SPDR (XLY) trading back over its 50-day average (blue line). Two of its biggest gainers are...
READ MORE
MEMBERS ONLY
SEMICONDUCTOR ISHARES BOUNCE OFF CHART SUPPORT -- WITH APPLIED MATERIALS AND LAM RESEARCH IN THE LEAD -- INTERNET STOCKS LEAD COMMUNICATION SECTOR HIGHER -- FACEBOOK AND GOOGLE ARE HOLDING MOVING AVERAGE LINES
by John Murphy,
Chief Technical Analyst, StockCharts.com
SEMICONDUCTOR ISHARES BOUNCE OFF CHART SUPPORT... Technology stocks are helping lead today's stock rebound. With help from semiconductors. Chart 1 shows the PHLX Semiconductor iShares (SOXX) bouncing off potential chart support along its August/September highs near 190. Its 9-day RSI line (upper box) is also bouncing from...
READ MORE
MEMBERS ONLY
CHINESE RETALIATORY TARIFFS SEND GLOBAL STOCKS LOWER AGAIN -- TRADE-SENSITIVE ASSETS LEAD TODAY'S RETREAT WHILE SAFE HAVENS CONTINUE TO GAIN -- ARE DRUG STOCKS THAT DEFENSIVE
by John Murphy,
Chief Technical Analyst, StockCharts.com
STOCK SELLING CONTINUES ... Stock prices fell sharply again today and are continuing the trade-inspired selling that started last week. Retaliatory tariffs announced by China appear to be the main catalyst pushing global stocks lower. As a result, markets with the most exposure to trade tensions and Chinese tariffs are falling...
READ MORE
MEMBERS ONLY
TRADE TENSIONS LEAD TO BAD WEEK FOR GLOBAL STOCKS -- CHINESE STOCKS LEAD GLOBAL RETREAT -- TRADE SENSITIVE SECTORS DROP THE MOST WHILE SAFE HAVENS LEAD -- A LATE FRIDAY REBOUND KEPT STOCK INDEXES ABOVE MOVING AVERAGE LINES
by John Murphy,
Chief Technical Analyst, StockCharts.com
CHINESE STOCKS LEAD WEEKLY RETREAT ... An escalation in trade tensions between the U.S. and China pushed global stocks lower this past week. The S&P 500 lost -2.2% which was its biggest weekly drop this year. Canadian and U.S. stocks are meeting resistance at their 2018...
READ MORE
MEMBERS ONLY
HEALTHCARE IS ONE OF THE DAY'S WEAKEST SECTORS AND NOT ACTING LIKE A SAFE HAVEN -- BIOTECHS ARE LEADNG THEM LOWER -- STAPLES, UTILITIES, AND REITS ARE THE REAL HAVENS -- SECTOR SUMMARY TABLE SHOWS A MORE DEFENSIVE SECTOR ALIGNMENT AS STOCK PRICES WEAKEN
by John Murphy,
Chief Technical Analyst, StockCharts.com
HEALTHCARE SECTOR DOESN'T LOOK VERY DEFENSIVE... During a guest appearance yesterday on StockChartsTV with Erin Swenlin and Tom Bowley, one of our viewers asked if healthcare was considered a defensive sector, and was it a good sector to hold in the current environment. My response was that some...
READ MORE
MEMBERS ONLY
WORLD STOCK INDEXES ARE TESTING OVERHEAD RESISTANCE AND LOOKING OVER-EXTENDED -- THAT MAY EXPLAIN THEIR BAD REACTION TO TRADE TENSIONS -- WORLD STOCKS HAVE TO CLEAR RESISTANCE LEVELS TO RESUME THEIR 2019 UPTREND
by John Murphy,
Chief Technical Analyst, StockCharts.com
TRADE TENSIONS RATTLE OVEREXTENDED GLOBAL STOCKS ... Renewed trade tensions between the U.S. and China rattled global stocks this week. Stock prices are rising and falling with each news report. After falling sharply yesterday (Tuesday), stocks are rebounding today on more optimistic news reports about the meeting between U.S....
READ MORE
MEMBERS ONLY
STOCK PULLBACK CONTINUES -- ALL MAJOR STOCK INDEXES ARE BACK BELOW LAST YEAR'S PEAK -- MOVING AVERAGE LINES ARE BEING TESTED -- ENERGY, MATERIALS, AND INDUSTRIALS ARE AMONG BIGGEST SECTOR LOSERS
by John Murphy,
Chief Technical Analyst, StockCharts.com
MAJOR STOCK INDEXES LOSE MORE GROUND ... The stock market pullback that started yesterday is continuing again today. And all three major stock indexes appear headed for a test of underlying moving average lines. First and foremost, it's where this pullback is starting from that's most concerning....
READ MORE
MEMBERS ONLY
Strong Jobs Report Boosts Stocks - S&P 500 Nears Another Record
by John Murphy,
Chief Technical Analyst, StockCharts.com
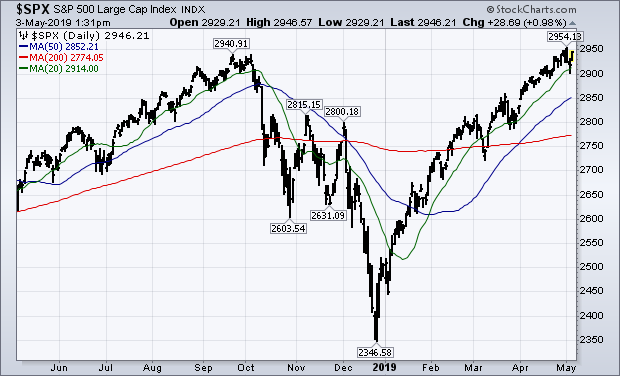
Editor's Note: This article was originally published in John Murphy's Market Message on Friday, May 3rd at 1:34pm ET.
A surprisingly strong jobs report this morning has given stocks a big boost today. All major indexes are having a strong day with the Nasdaq and...
READ MORE
MEMBERS ONLY
STRONG JOBS REPORT BOOSTS STOCKS -- TRANSPORTS CONTINUE TO SHOW NEW LEADERSHIP -- S&P 500 NEARS ANOTHER RECORD -- INSURANCE STOCKS LEAD FINANCIALS HIGHER -- METLIFE NEARS MAJOR UPSIDE BREAKOUT
by John Murphy,
Chief Technical Analyst, StockCharts.com
S&P 500 TRIES TO REGAIN RECORD HIGH ... A surprisingly strong jobs report this morning has given stocks a big boost today. All major indexes are having a strong day with the Nasdaq and small caps in the lead (more on that shortly). Transports are also having an especially...
READ MORE
MEMBERS ONLY
WEAK INFLATION ISN'T TRANSITORY -- COMMODITY PRICES HAVE BEEN FALLING FOR A DECADE -- A RISING DOLLAR IS ONE REASON WHY -- STOCKS REACT BADLY TO LESS DOVISH FED -- RISING BOND YIELDS BOOST THE DOLLAR -- CRUDE OIL LEADS COMMODITIES LOWER
by John Murphy,
Chief Technical Analyst, StockCharts.com
COMMODITIES HAVE BEEN FALLING FOR A DECADE ... Yesterday's message suggested that weaker commodity prices should provide some comfort to the Fed since subdued inflation would allow the Fed to keep rates on hold and prolong the decade-long economic recovery. It turns out the Fed is more worried than...
READ MORE
MEMBERS ONLY
RECENT WEAKNESS IN COMMODITY MARKETS MAY BE GOOD NEWS FOR THE FED -- THE BLOOMBERG COMMODITY INDEX HAS WEAKENED ALONG WITH MOST COMMODITY GROUPS -- THE UPTREND IN OIL MAY ALSO BE WEAKENING -- ENERGY SPDR HAS ALREADY FALLEN BELOW ITS MOVING AVERAGE LINES
by John Murphy,
Chief Technical Analyst, StockCharts.com
COMMODITY PRICES WEAKEN ... One of the factors the Fed is now considering to help formulate its monetary policy for the rest of the year is the question of inflation. Rising inflation puts pressure on the Fed to raise rates. Flat or falling inflation allows the Fed to stick with its...
READ MORE
MEMBERS ONLY
SMALL CAPS MAY BE GETTING A LIFT FROM RISING FINANCIAL SHARES -- FINANCIALS ARE THE BIGGEST SECTOR IN THE RUSSELL 2000 -- AND HAVE BEEN THIS MONTH'S STRONGEST SECTOR -- WHILE HEALTHCARE WEAKNESS MAY BE HOLDING SMALL CAPS BACK
by John Murphy,
Chief Technical Analyst, StockCharts.com
APRIL REBOUND IN FINANCIALS IS GIVING A BIG BOOST TO SMALL CAPS... I've been writing about the recent upturn in financial stocks and, to a lesser extent, small cap stocks. I also suggested that a stronger dollar might be helping smaller stocks. That's because a rising...
READ MORE
MEMBERS ONLY
MMM AND UPS WEIGH INDUSTRIALS DOWN -- AMERICAN EXPRESS BREAKS OUT TO NEW RECORD -- BANK INDEX TRIES TO CLEAR ITS 200-DAY LINE -- S&P 500 CONTINUES TO CHALLENGE ITS 2018 HIGH
by John Murphy,
Chief Technical Analyst, StockCharts.com
INDUSTRIAL SPDR GAPS LOWER ... In a mixed market day, industrials are the weakest sector. Chart 1 shows the Industrial Sector SPDR (XLI) gapping lower today. That hasn't caused any serious chart damage with the XLI still trading well above its blue 50-day average. It is worth noting, however,...
READ MORE
MEMBERS ONLY
RUSSELL 2000 IS TRADING OVER ITS 200-DAY LINE -- A STRONGER DOLLAR MAY BE HELPING -- MAJOR U.S. STOCK INDEXES NEAR THEIR 2018 HIGHS -- CORPORATE BOND ISHARES ARE ALREADY IN NEW HIGH GROUND
by John Murphy,
Chief Technical Analyst, StockCharts.com
RUSSELL 2000 TRADES ABOVE ITS 200-DAY AVERAGE... In the midst of a strong market day, small caps are showing a bigger percentage gain than large caps. Chart 1 shows the Russell 2000 Small Cap Index ($RUT) trading above its (red) 200-day moving average today. The RUT still needs to clear...
READ MORE
MEMBERS ONLY
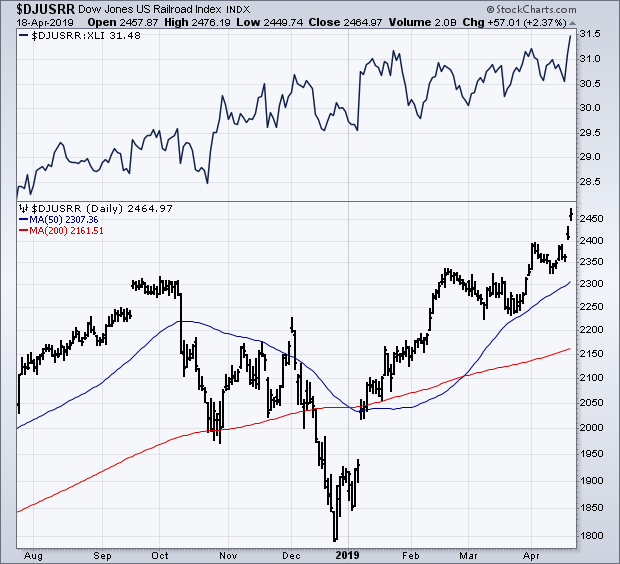
Railroad Stocks Lead the Transports and Industrial Sector Higher
by John Murphy,
Chief Technical Analyst, StockCharts.com
Editor's Note: This article was originally published in John Murphy's Market Message on Friday, April 19th at 10:21am ET.
Two stock groups did better than the rest of the market this week. Transportation stocks had another strong week. As did the Industrial Sector SPDR (XLI)...
READ MORE
MEMBERS ONLY
RAILROAD STOCKS LEAD THE TRANSPORTS AND INDUSTRIAL SECTOR HIGHER -- WIDENING SPREAD BETWEEN 10-YEAR TREASURY AND GERMAN YIELD FAVORS THE DOLLAR -- A RISING DOLLAR IS HURTING GOLD MORE THAN COPPER -- A RISING COPPER/GOLD RATIO IS A SIGN OF CONFIDENCE
by John Murphy,
Chief Technical Analyst, StockCharts.com
RAILROAD STOCKS HAVE BECOME MARKET LEADERS... Two stock groups did better than the rest of the market this week. Transportation stocks had another strong week. As did the Industrial Sector SPDR (XLI) which was the week's strongest sector. Both have one group to thank for their strong performance....
READ MORE
MEMBERS ONLY
BANKS, ENERGY, AND SMALL CAPS TEST 200-DAY LINES -- DOLLAR HITS TWO-YEAR HIGH AS EURO WEAKENS -- THE RISING DOLLAR IS PUSHING GOLD MINERS LOWER -- WISDOM TREE EUROPE HEDGED EQUITY FUND COMPENSATES FOR WEAKER EURO
by John Murphy,
Chief Technical Analyst, StockCharts.com
BANKS, ENERGY, AND SMALL CAPS STRUGGLE WITH THEIR 200-DAY LINES... Three stock groups are still struggling to clear their 200-day lines. Chart 1 shows the KBW Bank Index sitting just below its red line. Lower bond yields today may be holding it back. But the Financial Sector SPDR (XLF) has...
READ MORE
MEMBERS ONLY
ASSET MANAGERS LEAD FINANCIALS HIGHER -- LED BY BLACKROCK, INVESCO, AND T ROWE PRICE -- HEALTHCARE SPDR FALLS BELOW 200-DAY AVERAGE -- LED LOWER BY HEALTH CARE PROVIDERS -- HCA TUMBLES, WHILE CIGNA, AND HUMANA HIT 52-WEEK LOWS
by John Murphy,
Chief Technical Analyst, StockCharts.com
ASSET MANAGERS LEAD FINANCIALS HIGHER ... Financials are the day's strongest sector. Chart 1 shows the Financial Sector SPDR (XLF) trading today at the highest level since last October. The solid gray line is a relative strength ratio of the XLF divided by the S&P 500; and...
READ MORE