MEMBERS ONLY
RETAILERS CONTINUE TO WEIGH ON CYCLICALS -- CONSUMER DISCRETIONARY SPDR FALLS BELOWS 50-DAY AVERAGE -- HOMEBUILDERS ARE ALSO WEIGHING ON CYCLICALS -- HOME CONSTRUCTION ETF FALLS TO LOWEST LEVEL IN A YEAR -- RISING BOND YIELDS ARE A BIG REASON WHY
by John Murphy,
Chief Technical Analyst, StockCharts.com
RETAILERS CONTINUE TO WEAKEN... Tuesday's message showed retail stocks under selling pressure. That selling is continuing today. Chart 1 shows the S&P Retail SPDR (XRT) nearing a test of its July/August lows and maybe even its 200-day moving average (red line). The Tuesday message also...
READ MORE
MEMBERS ONLY
TEN-YEAR TREASURY YIELD BREAKS OUT TO HIGHEST LEVEL SINCE 2011 ON STRONG ECONOMIC NEWS -- STOCKS RALLY WITH YIELDS AS BOND PRICES FALL -- THAT'S GIVING A LIFT TO BANKS AND OTHER FINANCIALS
by John Murphy,
Chief Technical Analyst, StockCharts.com
TEN-YEAR TREASURY YIELD ACHIEVES MAJOR BULLISH BREAKOUT... Treasury yields have finally achieved the upside breakout that many of us have been warning about. And it's doing it in pretty decisive fashion. The daily bars in Chart 1 show the 10-Year Treasury yield surging above its May peak near...
READ MORE
MEMBERS ONLY
RETAIL STOCKS HAVE A BAD CHART DAY -- THAT'S STARTING TO WEIGH ON RELATIVE PERFORMANCE OF THE CONSUMER DISCRETIONARY SECTOR WHICH APPEARS TO BE LOSING UPSIDE MOMENTUM -- CYCLICAL STOCKS ARE ALSO LOSING GROUND VERSUS DEFENSIVE CONSUMER STAPLES
by John Murphy,
Chief Technical Analyst, StockCharts.com
RETAIL SPDR TUMBLES TO TWO-MONTH LOW... Retail stocks are having a bad chart day. The daily bars in Chart 1 show the S&P Retail SPDR (XRT) falling to the lowest level in two months, and trading below its 50-day average (blue line) by the widest margin since March....
READ MORE
MEMBERS ONLY
Health Care Has Become the New Market Leader
by John Murphy,
Chief Technical Analyst, StockCharts.com
Editor's Note: This article was originally published in John Murphy's Market Message on Friday, September 28th at 12:29pm ET.
The three strongest sector leaders since the start of this year have been consumer cyclicals, technology, and healthcare (in that order). But those numbers don'...
READ MORE
MEMBERS ONLY
CONSUMER CYCLICALS AND TECHNOLOGY ARE THE YEAR'S STRONGEST SECTORS -- BUT HEALTHCARE HAS BECOME THE NEW MARKET LEADER -- AND REMAINS MUCH CHEAPER THAN THE OTHER SECTOR LEADERS
by John Murphy,
Chief Technical Analyst, StockCharts.com
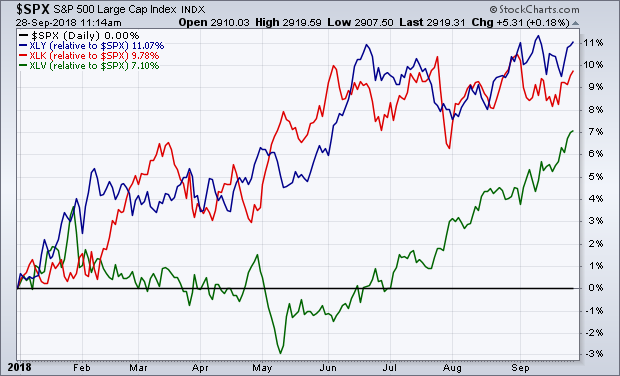
HEALTHCARE HAS BECOME NEW SECTOR LEADER... The three strongest sector leaders since the start of this year have been consumer cyclicals, technology, and healthcare (in that order). But those numbers don't reflect the fact that healthcare has become the strongest market sector over the past three and six...
READ MORE
MEMBERS ONLY
TEN-YEAR TREASURY IS TESTING ITS MAY HIGH -- A CLOSE ABOVE THAT LEVEL WOULD CONSTITUTE A MAJOR BULLISH BREAKOUT -- RISING TREASURY YIELDS ARE BEING SUPPORTED BY HIGHER FOREIGN YIELDS -- UK BOND YIELD HAS REACHED A TWO-YEAR HIGH
by John Murphy,
Chief Technical Analyst, StockCharts.com
TEN-YEAR TREASURY YIELD IS AT A CRUCIAL CHART POINT ... Treasury bond yields are going through an important test of overhead resistance. Chart 1 shows the 10-Year Treasury yield ($TNX) challenging its May 2018 intra high near 3.11%. After pulling back from its May high, the TNX entered a sideways...
READ MORE
MEMBERS ONLY
ENERGY PRICES RISE AS OPEC DOESN'T BOOST OUTPUT -- DB ENERGY FUND RISES TO THREE-YEAR HIGH -- ENERGY SECTOR SPDR RISES TO TWO-MONTH HIGH -- SO DOES THE S&P OIL & GAS EXPLORATION AND PRODUCTION SPDR -- MARATHON PETROLEUM HITS NEW RECORD
by John Murphy,
Chief Technical Analyst, StockCharts.com
INVESCO DB ENERGY FUND REACHES THREE-YEAR HIGH ... This past weekend's meeting between OPEC and Russia ended with no agreement to boost output to counter rising oil price. As a result, oil and other energy prices are rising sharply today. Chart 1 shows the Invesco DB Energy Fund (DBE)...
READ MORE
MEMBERS ONLY
WEEKLY RECAP SHOWS MATERIALS AND FINANCIALS LEADING MARKET HIGHER, WHILE TECHNOLOGY AND UTILITIES LAG BEHIND -- RECORD HIGH IN THE DOW MAY BE TIED TO EASING IN GLOBAL TENSIONS AND REBOUND IN FOREIGN CURRENCIES AND STOCKS
by John Murphy,
Chief Technical Analyst, StockCharts.com
MATERIALS AND FINANCIALS LEAD, TECHS AND UTES LAG: The Dow and S&P 500 hit new records this past week, while the Nasdaq lost some ground. A rebound in chemicals and copper stocks made materials the weekly leader. Financials benefited from a jump in bond yields. That also explains...
READ MORE
MEMBERS ONLY
UNITED STATES OIL FUND IS TESTING SUMMER HIGH -- WHILE ENERGY SPDR TESTS AUGUST HIGH -- ENERGY LEADERS INCLUDE CONOCOPHILLIPS, HESS, AND MARATHON OIL -- EXXON MOBIL AT EIGHT-MONTH HIGH
by John Murphy,
Chief Technical Analyst, StockCharts.com
UNITED STATES OIL FUND NEARS THREE-YEAR HIGH... The price of crude oil has reached a critical chart juncture. Chart 1 shows the United States Oil Fund (USO) in the process of testing its early July peak. A close through that barrier would put the USO at the highest level in...
READ MORE
MEMBERS ONLY
DOW AND S&P 500 HIT NEW RECORDS -- THE DOW IS THE LAST ONE TO CLEAR ITS JANUARY HIGH -- COMMODITY CHEMICALS HELP BOOST MATERIALS SPDR TO SIX MONTH HIGH -- SEMICONDUCTORS CONTINUE TO STABILIZE -- U.S. DOLLAR FALLS TO TWO-MONTH LOW
by John Murphy,
Chief Technical Analyst, StockCharts.com
THE DOW IS THE LAST TO CLEAR ITS JANUARY HIGH... Another day of rising stock prices has pushed the Dow and the S&P 500 to new records. In the case of the SPX (Chart 1), today's new high is enough to push it back above its...
READ MORE
MEMBERS ONLY
FOUR-MONTH HIGH IN THE 10-YEAR TREASURY YIELD LIFTS FINANCIAL SPDR TO SIX-MONTH HIGH AND THE DAY'S STRONGEST SECTOR -- BUT MAKES UTILITIES THE DAY'S WEAKEST SECTOR
by John Murphy,
Chief Technical Analyst, StockCharts.com
RISING BOND YIELDS HELP FINANCIALS, BUT HURT UTILITIES... This morning's message suggested that this week's upside breakout in bond yields was helping financial stocks which were the day's strongest sector. The green bars on top of Chart 1 show the 10-Year Treasury yield surging...
READ MORE
MEMBERS ONLY
UPSIDE BREAKOUT IN BOND YIELDS IS BOOSTING FINANCIAL STOCKS -- CITIGROUP AND JP MORGAN NEAR UPSIDE BREAKOUTS -- INSURANCE ISHARES HIT SEVEN-MONTH HIGH TO LEAD XLF HIGHER -- PRUDENTIAL AND PRINCIPAL FINANCIAL GROUP ACHIEVE UPSIDE BREAKOUTS
by John Murphy,
Chief Technical Analyst, StockCharts.com
FINANCIALS GET A BOOST FROM RISING BOND YIELDS ... Yesterday's message showed the 10-Year Treasury yield rising to the highest level in four months. That probably explains why financials are leading the market higher today. Chart 1 shows the Financial Sector SPDR (XLF) bouncing sharply off its moving average...
READ MORE
MEMBERS ONLY
TEN-YEAR TREASURY YIELD EXCEEDS 3% -- 20-YEAR T-BOND ISHARES BREAK SUPPORT -- THE DOW NEARS ITS JANUARY HIGH -- BOEING AND CATERPILLAR CLEAR RESISTANCE -- QQQ HOLDS 50-DAY LINE -- SEMICONDUCTORS CONTINUE TO STABILIZE ABOVE 200-DAY AVERAGE
by John Murphy,
Chief Technical Analyst, StockCharts.com
TEN-YEAR TREASURY YIELD REACHES FOUR-MONTH HIGH ... Chart 1 shows the 10-Year Treasury Yield ($TNX) rising above its twin summer peaks near 3.00% and reaching the highest level in four months. That upside move breaks the TNX out of the three-month sideways pattern that it had been trading in; and...
READ MORE
MEMBERS ONLY
STOCKS LOSE SOME UPSIDE MOMENTUM --AMAZON AND MCDONALDS PULL CYCLICALS LOWER -- INDUSTRIALS CONTINUE TO RALLY -- LED BY FEDEX, HARRIS CORP, AND PACCAR -- TEN-YEAR YIELD TESTS 3% AGAIN
by John Murphy,
Chief Technical Analyst, StockCharts.com
SHORT-TERM SIGNS OF WEAKNESS ... The uptrend in U.S. stocks remains very much intact. However, upside momentum is weakening a bit. Chart 1, for example, shows the S&P 500 trading sideways over the past couple of weeks which is not unusual. The daily MACD lines (which are overlaid...
READ MORE
MEMBERS ONLY
CONSUMER DISRETIONARY SPDR IS YEAR'S STRONGEST SECTOR -- BUT IT MAY BE OVERSTATING SECTOR'S STRENGTH -- ITS EQUAL WEIGHTED ETF IS LAGGING THE XLY BY AN USUALLY WIDE GAP OF 11% -- OUTSIZED GAINS IN AMAZON AND NETFLIX MAY EXAGGERATING ITS 2018 PERFORMANCE
by John Murphy,
Chief Technical Analyst, StockCharts.com
CONSUMER DISCRETIONARY SPDR IS YEAR'S STRONGEST SECTOR ... Chart 1 shows the Consumer Discretionary SPDR (XLY) trading near a new record. Its 2018 gain of 18% makes it the year's strongest sector. That puts the XLY ahead of technology (16%) and healthcare (12%) for the year. In...
READ MORE
MEMBERS ONLY
TWITTER LEADS TECH STOCKS LOWER -- DEFENSIVE CONSUMER STAPLES, UTILITIES, AND REITS CONTINUE TO ATTRACT NEW MONEY -- NETFLIX WEIGHS ON CONSUMER DISCRETIONARY STOCKS -- AMAZON IS A QUARTER OF THE XLY AND MAY BE OVERSTATING THIS YEAR'S CYCLICAL LEADERSHIP
by John Murphy,
Chief Technical Analyst, StockCharts.com
OVERBOUGHT TECH SECTOR SEES SOME PROFIT-TAKING ... Chart 1 shows the Technology Sector SPDR (XLK) losing more than 1% today to lead the market lower. Its 9-day RSI line (top chart) had reached overbought territory above 70 suggesting that the XLK was due for a pullback. It's now testing...
READ MORE
MEMBERS ONLY
U.S. STOCKS HAVE A STRONG AUGUST -- TECHNOLOGY, CONSUMER CYCLICALS, AND HEALTHCARE ARE SECTOR LEADERS -- U.S. STOCK UPTREND IS STRETCHED BUT STILL INTACT -- MEXICAN PESO STEADIES ON TRADE DEAL -- CANADIAN DOLLAR DROPS ON FRIDAY'S LACK OF AGREEMENT
by John Murphy,
Chief Technical Analyst, StockCharts.com
STOCKS HAVE A STRONG AUGUST ... U.S. stocks had a strong August with the Nasdaq, S&P 500, Russell 2000, and Dow Transports hitting record highs. Technology, Consumer Cyclicals, and Healthcare saw the biggest percentage gains and hit record highs. The three weakest sectors were Energy, Materials, and Industrials....
READ MORE
MEMBERS ONLY
Late August Rebound in Foreign Stocks Helped Push U.S. Stocks to New Record
by John Murphy,
Chief Technical Analyst, StockCharts.com
Editor's Note: This article was originally published in John Murphy's Market Message on Wednesday, August 29th at 12:33pm ET.
Before leaving on vacation on August 15, I expressed concern about the fact that foreign stock ETFs were lagging too far behind the U.S. which...
READ MORE
MEMBERS ONLY
LATE AUGUST REBOUND IN FOREIGN STOCKS HELPED PUSH U.S. STOCKS TO NEW RECORD -- AND CONTRIBUTED TO UPSIDE BREAKOUTS IN GLOBAL STOCK INDEXES -- THE DOW INDUSTRIALS ARE HEADED TOWARD THEIR JANUARY PEAK -- THE DOW TRANSPORTS HIT A NEW RECORD
by John Murphy,
Chief Technical Analyst, StockCharts.com
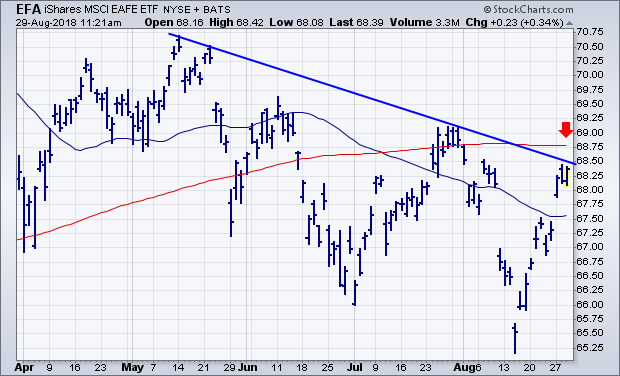
FOREIGN STOCK ETFS ARE FINALLY BOUNCING ... Before leaving on vacation on August 15, I expressed concern about the fact that foreign stock ETFs were lagging too far behind the U.S. which could threaten the uptrend in the S&P 500 which was nearing a test of its January...
READ MORE
MEMBERS ONLY
Stocks in Strong Rebound After Surviving Test of 50-Day Averages Yesterday
by John Murphy,
Chief Technical Analyst, StockCharts.com
Editor's Note: This article was originally published in John Murphy's Market Message on Thursday, August 16th at 2:12pm ET.
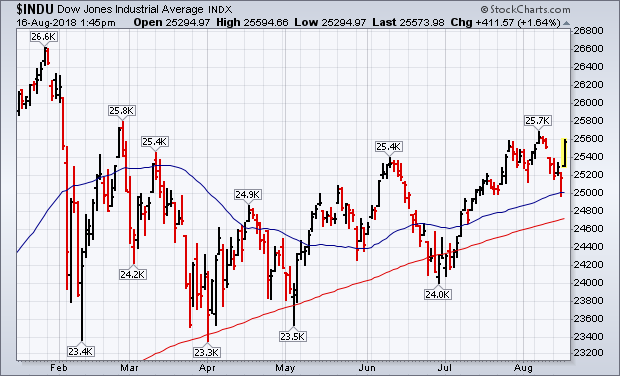
U.S. stock indexes are having an unusually strong day. Chart 1 shows the Dow Jones Industrial Average climbing more than 400 points (1.6%) in...
READ MORE
MEMBERS ONLY
STOCKS IN STRONG REBOUND AFTER SURVIVING TEST OF 50-DAY AVERAGES YESTERDAY -- ALL SECTORS ARE IN THE BLACK -- A REBOUND IN FOREIGN MARKETS IS ALSO HELPING -- NEWS OF CHINA NEGOTIATIONS MAY ALSO BE SUPPORTING THE STOCK UPTURN
by John Murphy,
Chief Technical Analyst, StockCharts.com
MAJOR STOCK AVERAGES REBOUND SHARPLY... U.S. stock indexes are having an unusually strong day. Chart 1 shows the Dow Jones Industrial Average climbing more than 400 points (1.6%) in afternoon trading. The Dow tested its 50-day average yesterday and held. Chart 2 shows the S&P 500...
READ MORE
MEMBERS ONLY
FOREIGN STOCKS LEAD U.S. LOWER -- EMERGING MARKETS AND EAFE ISHARES FALL TO LOWEST LEVEL IN A YEAR -- STRONGER DOLLAR AND WEAKNESS IN CHINA PUSH METALS LOWER AND STOCKS TIED TO THEM -- ENERGY STOCKS ARE ALSO WEAKENING WITH OIL
by John Murphy,
Chief Technical Analyst, StockCharts.com
FOREIGN STOCK ETFS FALL TO NEW LOWS... Last Thursday's message expressed concern that weakness in foreign stocks could start to weigh on U.S. stocks, especially with the S&P 500 testing major resistance at its January high. That dangerous situation has taken a turn for the...
READ MORE
MEMBERS ONLY
U.S. STOCKS MAY BE GETTING TOO FAR AHEAD OF THE REST OF THE WORLD -- U.S. STOCKS USUALLY DO BETTER WHEN FOREIGN STOCKS ARE ALSO RISING -- U.S. STOCK RECORDS IN 2012 AND 2016 WERE SUPPORTED BY RISING FOREIGN SHARES
by John Murphy,
Chief Technical Analyst, StockCharts.com
S&P 500 IS TESTING ITS JANUARY HIGH ... The black bars in Chart 1 show the S&P 500 nearing a test of its January high. That's an important test for it and the rest of the market. A test of a previous high is very...
READ MORE
MEMBERS ONLY
LONG-RANGE DOLLAR UPTREND REMAINS INTACT -- LATE CYCLE COMMODITY UPTURN IS UNLIKELY WITH A RISING DOLLAR -- STRONG DOLLAR FAVORS U.S. OVER FOREIGN STOCKS -- ESPECIALLY EMERGING MARKETS
by John Murphy,
Chief Technical Analyst, StockCharts.com
LONG-TERM TREND OF THE DOLLAR IS STILL UP... The direction of the U.S. dollar is important because it influences (or is influenced by) by a lot of other markets. That includes commodities, global interest rates, and global stocks. Dollar direction also influences the relative performance of small cap stocks...
READ MORE
MEMBERS ONLY
FINANCIAL SPDR ACHIEVES BULLISH BREAKOUT -- INDUSTRIAL SPDR MAY BE NEXT -- MATERIALS SPDR REGAINS MOVING AVERAGE LINES -- THE DOW INDUSTRIALS AND TRANSPORTS ARE BREAKING OUT TOGETHER -- THE S&P 500 NEARS TEST OF JANUARY HIGH
by John Murphy,
Chief Technical Analyst, StockCharts.com
FINANCIALS SPDR BREAKS OUT ... Global stocks are having a strong day. Rebounds in foreign developed and emerging markets set the tone for higher trading in the states. All major U.S. indexes are in the black, as are most stock sectors. The strongest sectors are energy, financials, industrials, and materials....
READ MORE
MEMBERS ONLY
DEFENSIVE STOCKS ARE LEADING THE MARKET HIGHER -- CONSUMER STAPLES SPDR TURNS UP AND SHOWS MARKET LEADERSHIP -- SO DO UTILITIES AND REITS -- PHARMA IS LEADING HEALTHCARE SECTOR HIGHER -- ALL OF WHICH SUGGESTS INVESTORS MAY BE TURNING MORE DEFENSIVE
by John Murphy,
Chief Technical Analyst, StockCharts.com
CONSUMER STAPLES TURN UP... Although the stock market continued to climb this week, it's a little surprising to see defensive stocks leading it higher. The four strongest sectors this past week were REITs (+3.3%), healthcare (+2.1%), consumer staples (+1.7%), and utilities (+1.2%). All did...
READ MORE
MEMBERS ONLY
Selling in China Unsettles Global Stocks This Morning on Tariff Threats -- But US Stock Indexes Are Recovering from Early Selling
by John Murphy,
Chief Technical Analyst, StockCharts.com
Editors Note: This article was originally published in John Murphy's Market Message on Thursday, August 2nd at 1:43pm ET.
TARIFF THREATS PUSH CHINESE MARKETS LOWER ... Threats of higher tariffs on Chinese imports, combined with Chinese threats of retaliation, put international markets on the defensive today. It started...
READ MORE
MEMBERS ONLY
SELLING IN CHINA UNSETTLES GLOBAL STOCKS THIS MORNING ON TARIFF THREATS -- BUT US STOCK INDEXES ARE RECOVERING FROM EARLY SELLING -- MATERIAL STOCKS ARE DAY'S WEAKEST SECTOR -- TECHNOLOGY SPDR AND QQQ BOUNCE OFF 50-DAY LINES TO LEAD MARKET RECOVERY
by John Murphy,
Chief Technical Analyst, StockCharts.com
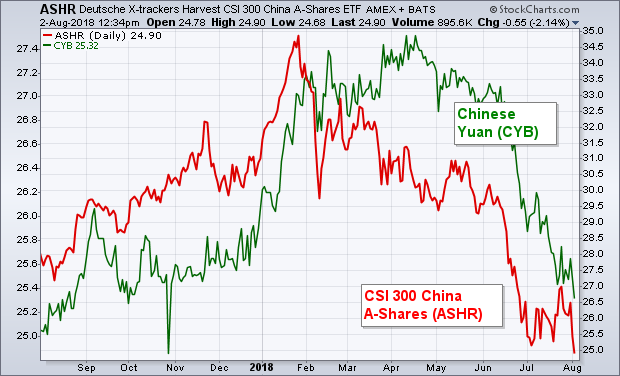
TARIFF THREATS PUSH CHINESE MARKETS LOWER ... Threats of higher tariffs on Chinese imports, combined with Chinese threats of retaliation, put international markets on the defensive today. It started in Asia, spread to Europe, and caused a lower stock opening here. China took the biggest hit. The red line in Chart...
READ MORE
MEMBERS ONLY
INDUSTRIAL SPDR ACHIEVES BULLISH BREAKOUT TO LEAD MARKET HIGHER -- XLI LEADERS INCLUDE XYLEM, HARRIS, AND EATON -- THE DOW TRANSPORTS ARE CHALLENGING THEIR JUNE HIGH -- TRAN LEADERS INCLUDE FEDEX AND RYDER -- PFIZER SURGES TO NEW RECORD TO LEAD DOW HIGHER
by John Murphy,
Chief Technical Analyst, StockCharts.com
INDUSTRIAL SPDR REACHES FOUR-MONTH HIGH ... While media attention seems to be focused on struggling FANG stocks, investors are putting their money elsewhere. Chart 1 shows the Industrial Sector SPDR (XLI) rising above its June high to reach the highest level in four months. That's a healthy sign for...
READ MORE
MEMBERS ONLY
SMALL CAPS LOOK TOPPY AND ARE STARTING TO WEAKEN -- WHILE THE S&P 500 SPDR IS TESTING OVERHEAD RESISTANCE AT ITS JANUARY HIGH -- THAT COULD LEAD TO A CHOPPY AUGUST
by John Murphy,
Chief Technical Analyst, StockCharts.com
SMALL CAPS ROLL OVER WHILE SPY TESTS JANUARY HIGH ... Stocks are beginning to look a little toppy. That's especially true of small caps. Chart 1 shows the Russell 2000 Small Cap Index ($RUT) ending the week below its 50-day moving average (blue circle). The RUT has been losing...
READ MORE
MEMBERS ONLY
AIRLINES LEAD TRANSPORTS AND INDUSTRIAL SPDR HIGHER -- UAL IS AIRLINE LEADER -- ALASKA AIR, SOUTHWEST, AND DELTA HAVE A STRONG DAY -- INDUSTRIAL SPDR ALSO TURNS UP -- KANSAS CITY SOUTHERN AND L3 TECHNOLGIES HELP LEAD XLI HIGHER
by John Murphy,
Chief Technical Analyst, StockCharts.com
DOW TRANSPORTS CONTINUE TO GAIN GROUND ... The Dow Transports continue to gain altitude. Chart 1 shows the Dow Transports trading at the highest level in a month and nearing a challenge of its June high. Yesterday's message showed the TRAN being driven higher by United Parcel Service (UPS)...
READ MORE
MEMBERS ONLY
UPS LEADS TRANSPORTS HIGHER TODAY -- CSX AND NORFOLK SOUTHERN LEAD STRONG RAIL GROUP -- TRUCKERS RYDER AND CH ROBINSON ARE ALSO LEADING -- RISING OIL PRICES HAVE HURT AIRLINE PERFORMANCE -- BUT ARE BOOSTING ENERGY SHARES
by John Murphy,
Chief Technical Analyst, StockCharts.com
DOW TRANSPORTS REGAIN 50-DAY AVERAGE... The Dow Jones Transportation Average has been trying to gain altitude after successfully bouncing off its 200-day moving average over the past month. But it's been a choppy advance. Chart 1 shows the Dow Transports regaining its 50-day average today after being pulled...
READ MORE
MEMBERS ONLY
TEN-YEAR TREASURY YIELD KEEPS CLIMBING -- THAT PUSHES BOND PRICES FURTHER BELOW RESISTANCE -- THAT'S LIFTING FINANCIALS AND BANKS IN PARTICULAR -- BANK LEADERS ARE BANK OF AMERICA, JP MORGAN, AND SUNTRUST -- NORTHERN TRUST NEARS UPSIDE BREAKOUT
by John Murphy,
Chief Technical Analyst, StockCharts.com
TEN-YEAR TREASURY YIELD CLEARS 50-DAY AVERAGE AS BOND PRICES DROP... The upturn in Treasury yields that started on Friday is gaining more momentum today. Chart 1 shows the 10-Year Treasury yield ($TNX) climbing 5 basis points to the highest level in more than a month. It's also climbed...
READ MORE
MEMBERS ONLY
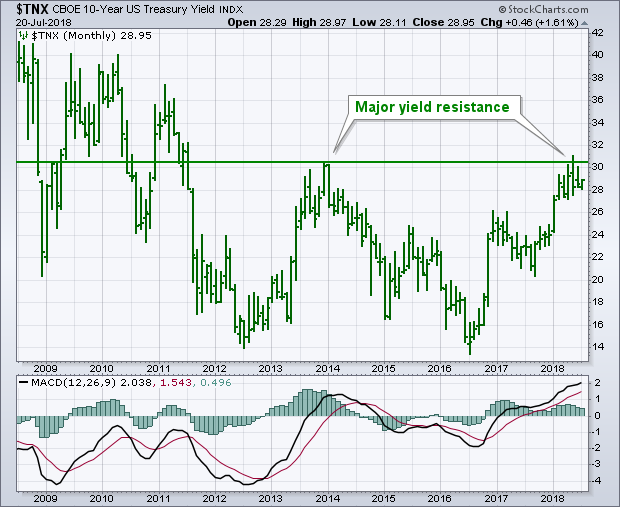
Ten-Year Treasury Yield Is Still Testing Overhead Resistance
by John Murphy,
Chief Technical Analyst, StockCharts.com
Editors Note:This article was originally published in John Murphy's Market Message on Thursday, July 19th at 1:46pm ET.
The monthly bars in Chart 1 shows the 10-Year Treasury Yield ($TNX) forming a major bottoming pattern that started six years ago (2012). Its monthly MACD lines (bottom...
READ MORE
MEMBERS ONLY
CHART ANALYSIS STILL FAVORS A HIGHER TEN-YEAR TREASURY YIELD -- WEAKER FOREIGN YIELDS HAVE HELD THE TNX BACK -- RISING RATES HURT CONSUMER STAPLES WHILE FAVORING CYCLICALS -- FALLING COMMODITY PRICES HAVE BOOSTED BOND PRICES -- OVERBOUGHT DOLLAR WEAKENS
by John Murphy,
Chief Technical Analyst, StockCharts.com
THE MAJOR TREND STILL FAVORS HIGHER BOND YIELDS... Yesterday's message showed the 7-10 Year T-bond iShares (IEF) testing important overhead resistance at its spring highs and 200-day moving average, and the impact bond direction usually has on rate-sensitive sectors like financials, utilities, and REITS. Rising rates usually favor...
READ MORE
MEMBERS ONLY
TREASURY PRICES ARE TESTING OVERHEAD RESISTANCE -- RISING BOND PRICES ARE BOOSTING UTILITIES AND REITS AT THE EXPENSE OF FINANCIALS -- FINANCIAL/UTILITY RATIO HAS BEEN FALLING THIS YEAR -- BUT IS TESTING TRENDLINE SUPPORT
by John Murphy,
Chief Technical Analyst, StockCharts.com
BOND ETF IS TESTING OVERHEAD RESISTANCE ... Treasury bond prices have been climbing since the middle of May. And they've reached an important chart point. Chart 1 shows the 7-10 Year Treasury Bond iShares (IEF) in the process of testing overhead resistance along their early April/late May peaks,...
READ MORE
MEMBERS ONLY
STOCK INDEXES ARE STILL CLIMBING -- NASDAQ HITS NEW RECORD -- S&P 500 TRADES AT FIVE-MONTH HIGH -- CHIP STOCKS FINDING SUPPORT ABOVE 200-DAY LINE -- FINANCIALS ARE BOUNCING AGAIN -- BANK OF AMERICA LEADS BANKS HIGHER
by John Murphy,
Chief Technical Analyst, StockCharts.com
MAJOR STOCK INDEXES ARE STILL CLIMBING ... All three of the major U.S. stock indexes are building on last week's gains. Chart 1 shows the Dow Industrials moving further above 25K and nearing a test of its June high. The Dow is being led higher by Johnson &...
READ MORE
MEMBERS ONLY
STOCKS ARE HAVING A POSITIVE WEEK -- THE DOW IS TRYING TO CLOSE OVER 25K -- THE S&P 500 IS CHALLENGING ITS MARCH HIGH - UNITED TECHNOLOGIES, ROCKWELL COLLINS, AND BOEING LEAD A STRONG AEROSPACE GROUP HIGHER
by John Murphy,
Chief Technical Analyst, StockCharts.com
S&P 500 IS CHALLENGING MARCH HIGH ... Stocks are ending the week on a positive note. The Nasdaq hit a new record high yesterday. Today's rally is being led by the Dow and S&P 500. Chart 1 shows the Dow Industrials trying to end above...
READ MORE
MEMBERS ONLY
DROP IN CHINESE MARKET STARTED WITH JUNE 15 TARIFFS -- SINCE THEN CHINESE STOCKS AND CURRENCY HAVE FALLEN TOGETHER -- AGRICULTURAL COMMODITIES AND BASE METALS PEAKED IN JUNE WITH CHINESE MARKET
by John Murphy,
Chief Technical Analyst, StockCharts.com
MOST COMMODITIES ARE IN THE RED ... Commodity prices have been falling sharply over the last month. And Chart 1 shows where most of the selling has taken place. The black line shows the Invesco Commodity Tracking Fund (DBC) still 4% higher since the start of the year. That's...
READ MORE
MEMBERS ONLY
FINANCIALS LEAD THE MARKET HIGHER -- FINANCIAL SPDR BOUNCES OFF CHART SUPPORT -- BANK ETFS DO THE SAME WITH REGIONALS IN THE LEAD -- DOW INDUSTRIALS CLEAR THEIR 50-DAY LINE TO LEAD MAJOR STOCK INDEXES HIGHER -- TRANSPORTS ARE ALSO HAVING A STRONG DAY
by John Murphy,
Chief Technical Analyst, StockCharts.com
FINANCIALS ARE THE DAY'S STRONGEST SECTOR ... My June 30 message suggested that the market needed more help from financial stocks and industrials if it was going to gain ground during the second half of the year. It's getting help from both today. Let's start...
READ MORE