MEMBERS ONLY
STOCKS START SECOND HALF ON AN UP NOTE -- HEALTHCARE SPDR ACHIEVES BULLISH BREAKOUT -- BIOGEN LEADS BIOTECH RALLY -- BUT A LOT OF OTHER BIOTECHS ARE RISING AS WELL -- PHARMACEUTICAL ISHARES ALSO BREAK OUT -- MERCK, ELI LILLY, AND PFIZER LEAD DRUG RALLY
by John Murphy,
Chief Technical Analyst, StockCharts.com
STOCKS START SECOND HALF ON A STRONG NOTE ... After a shaky month of June, stocks started the second half of the year on a positive note. And moving average lines continue to play an important role in that stronger start. Chart 1 shows the Dow Industrials ending the week on...
READ MORE
MEMBERS ONLY
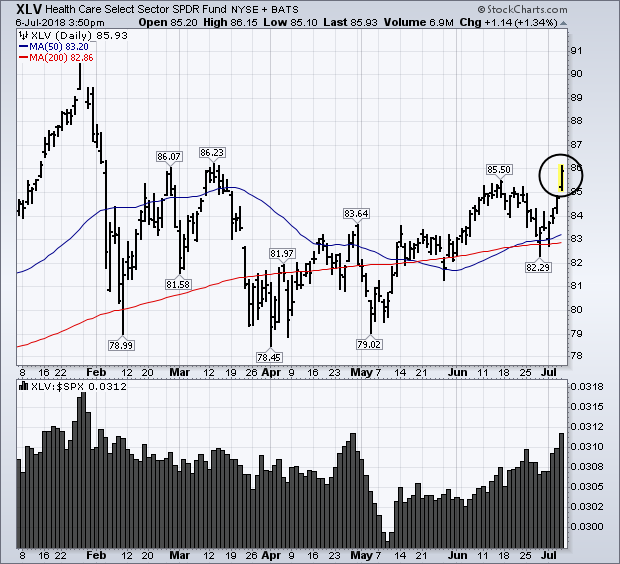
Health Care SPDR Achieves Bullish Breakout
by John Murphy,
Chief Technical Analyst, StockCharts.com
On a day when stocks are rising, and all eleven market sectors are in the black, healthcare is the standout performer. This chart shows the Health Care SPDR (XLV) rising to the highest level since the middle of March. The bottom box shows the XLV/SPX ratio rising to the...
READ MORE
MEMBERS ONLY
HEALTH CARE SPDR ACHIEVES BULLISH BREAKOUT -- BIOTECH ISHARES REACH HIGHEST LEVEL IN SIX MONTHS -- STOCKS END WEEK ON STRONG NOTE WITH ALL ELEVEN SECTORS GAINING GROUND
by John Murphy,
Chief Technical Analyst, StockCharts.com
HEALTHCARE SPDR ACHIEVES BULLISH BREAKOUT... On a day when stocks are rising, and all eleven market sectors are in the black, healthcare is the standout performer. Chart 1 shows the Health Care SPDR (XLV) rising to the highest level since the middle of March. The bottom box shows the XLV/...
READ MORE
MEMBERS ONLY
THE DOW ENDS JUST ABOVE ITS 200-DAY AVERAGE -- WHILE THE S&P 500 REGAINS ITS 50-DAY LINE -- THE RUSSELL 2000 AND NASDAQ 100 LEAD MARKET HIGHER -- SEMICONDUCTOR ISHARES BOUNCE OFF THEIR 200-DAY AVERAGE TO LEAD TECH SECTOR HIGHER
by John Murphy,
Chief Technical Analyst, StockCharts.com
MOVING AVERAGE LINES ARE STILL HOLDING... Major stock index continue to find support around moving average lines. Chart 1 shows the Dow Industrials rising 181 points (+0.75%) to close at 24356. That was enough to put it just above its 200-day moving average. Other stock indexes did even better....
READ MORE
MEMBERS ONLY
STOCKS GAINED GROUND DURING SECOND QUARTER -- SECTOR LEADERS WERE ENERGY, TECHNOLOGY, REITS, AND UTILITIES -- INDUSTRIALS AND FINANCIALS WERE THE WEAKEST -- FINANCIALS REMAIN IN DOWNTREND -- BANKS ETFS REMAIN UNDER PRESSURE
by John Murphy,
Chief Technical Analyst, StockCharts.com
DOW AND S&P 500 GIVE UP SOME OF FRIDAY'S GAINS... First a quick update on Friday's price action. The Dow and S&P 500 gave up some of their gains on Friday afternoon. The Dow gained 55 points (+0.23%) but ended slightly...
READ MORE
MEMBERS ONLY
STOCKS ARE OFF TO A STRONG START -- THE DOW AND S&P 500 REGAIN MOVING AVERAGE LINES -- THE NASDAQ HOLDS 50-DAY LINE -- ENERGY, FINANCIALS, MATERIALS, AND INDUSTRIALS LEAD THE MARKET HIGHER -- CHINA LEADS REBOUND IN EMERGING MARKETS
by John Murphy,
Chief Technical Analyst, StockCharts.com
DOW REGAINS ITS 200-DAY MOVING AVERAGE... Stocks are off to a strong start today. Wednesday's late selloff pushed the Dow below its 200-day average. Chart 1, however, shows the Dow Industrials regaining that long-term support line this morning. Chart 2 shows the S&P 500 regaining its...
READ MORE
MEMBERS ONLY
EARLY RALLY FADES AS STOCKS SUFFER DOWNSIDE REVERSAL DAY -- THE DOW AND S&P 500 CLOSE BELOW MOVING AVERAGE LINES -- THE NASDAQ FOLLOWS TECHNOLOGY STOCKS LOWER -- ENERGY SHARES FOLLOWED CRUDE OIL HIGHER -- UTILITIES RALLIED WITH BONDS AS YIELDS DROPPED
by John Murphy,
Chief Technical Analyst, StockCharts.com
DOWNSIDE REVERSAL DAY ENDS RALLY ATTEMPT ... This morning's market rebound didn't last for long. By day's end the market had suffered a downside reversal day. And some support levels were broken. Chart 1 shows the Dow Industrials falling 165 points (-.68%) and ending...
READ MORE
MEMBERS ONLY
OVERSOLD DOW BOUNCES OFF 200-DAY AVERAGE -- INDUSTRIALS AND MATERIALS ARE ALSO GAINING -- CRUDE OIL NEARS ANOTHER YEARLY HIGH -- THAT'S MAKING ENERGY THE DAY'S STRONGEST SECTOR
by John Murphy,
Chief Technical Analyst, StockCharts.com
THE DOW IS LEADING TODAY'S RALLY ... After weighing on the rest of the market all month, the Dow is leading today's rebound. And it couldn't come at a better time. Chart 1 shows the Dow Industrials bouncing off chart support near their late-May low...
READ MORE
MEMBERS ONLY
TECHNOLOGY SECTOR LEADS NASDAQ LOWER -- SEMICONDUCTORS ARE LEADING THE TECH RETREAT -- MICRON AND NVIDIA ARE BIG LOSERS -- THE DOW AND S&P 500 ARE TESTING MOVING AVERAGE LINES -- THE VIX INDEX JUMPS TO ONE-MONTH HIGH
by John Murphy,
Chief Technical Analyst, StockCharts.com
NASDAQ AND TECHS LEAD MARKET LOWER ... Tech stocks and the Nasdaq are leading the rest of the market lower. Chart 1 shows the Nasdaq 100 (QQQ) falling more than 2% today and bearing down on its 50-day average. The Nasdaq is the weakest of the major market indexes. Falling technology...
READ MORE
MEMBERS ONLY
OVERSOLD DOW IS BOUNCING FROM CHART SUPPORT -- SO ARE BOEING AND CATERPILLAR -- OPEC AGREEMENT BOOSTS CRUDE OIL AND ENERGY SHARES -- CHEVRON AND EXXON MOBIL LEAD DOW HIGHER -- TECHNOLOGY SHARES EXPERIENCE SOME PROFIT-TAKING
by John Murphy,
Chief Technical Analyst, StockCharts.com
THE DOW IS BOUNCING OFF CHART SUPPORT ... The Dow Industrials have been the weakest part of the U.S. stock market over the last month. That's been due primarily to its heavier exposure to stocks with more vulnerability to any Chinese trade tariffs like Boeing and Caterpillar. Those...
READ MORE
MEMBERS ONLY
RISING DOLLAR IS CAUSING FOREIGN STOCKS TO UNDERPERFORM THE U.S -- BUT THE U.S. USUALLY DOES BETTER WHEN FOREIGN STOCKS ARE ALSO RISING -- THE VANGUARD EX-USA ETF IS TESTING ITS FEBRUARY LOW -- WHILE EMERGING MARKETS ISHARES TEST LONG-TERM SUPPORT LINES
by John Murphy,
Chief Technical Analyst, StockCharts.com
DOLLAR HAS BIG IMPACT ON GLOBAL MONEY FLOWS ... The direction of the U.S dollar has a big impact on how U.S. stocks perform relative to foreign stocks. As a rule, a stronger dollar favors U.S. stocks, while a weak dollar favors foreign stocks. Chart 1 shows how...
READ MORE
MEMBERS ONLY
Dovish ECB Offsets Hawkish Fed
by John Murphy,
Chief Technical Analyst, StockCharts.com
Editors Note: This article was originally published in John Murphy's Market Message on Thursday, June 14th at 11:39am EST.
The Fed raised its short-term rate by a quarter point yesterday as expected. But it also added a fourth rate hike this year which gave its announcement a...
READ MORE
MEMBERS ONLY
DOVISH ECB OFFSETS HAWKISH FED -- DROP IN EURO BOOSTS DOLLAR -- GOLD AND DOLLAR WON'T BOUNCE TOGETHER FOR LONG -- FINANCIALS FAIL TO RESPOND TO FED RATE HIKE -- REITS TRY TO HOLD 200-DAY LINE -- S&P 500 NEARS TEST OF ITS MARCH HIGH
by John Murphy,
Chief Technical Analyst, StockCharts.com
ECB WON'T RAISE RATES FOR ANOTHER YEAR ... The Fed raised its short-term rate by a quarter point yesterday as expected. But it also added a fourth rate hike this year which gave its announcement a more hawkish tilt. That had the immediate effect of boosting Treasury bond yields...
READ MORE
MEMBERS ONLY
DOW TRANSPORTS RESUME UPTREND -- WHILE UTILITIES CONTINUE TO WEAKEN -- TRANSPORTATION/UTILITIES RATIO RISES TO NEW RECORD
by John Murphy,
Chief Technical Analyst, StockCharts.com
TRANSPORTS REACH FIVE-MONTH HIGH -- WHILE UTILITIES FALL ... The Dow Industrials exceeded their May high last week to reach the highest level in three months. And are higher again today. But today it's the transports' turn to lead the Dow family of stocks higher. Chart 1 shows...
READ MORE
MEMBERS ONLY
HEALTHCARE SPDR TURNS UP -- PHARMA IS LEADING -- PHARMACEUTICALS SPDR REACHES THREE-MONTH HIGH -- PHARMA LEADERS ARE ABBOTT LABS, LILLY, AND PFIZER -- ZOETIS HITS NEW RECORD -- SOME MONEY MAY BE ROTATING FROM TECHS INTO CHEAPER DRUG STOCKS
by John Murphy,
Chief Technical Analyst, StockCharts.com
HEALTHCARE SPDR TURNS UP... Last Friday's message suggested that the healthcare sector appeared to be basing. But it needed a close over its April/May highs to turn its trend from "sideways" to "up". Chart 1 shows the Health Care SPDR (XLV) exceeding those...
READ MORE
MEMBERS ONLY
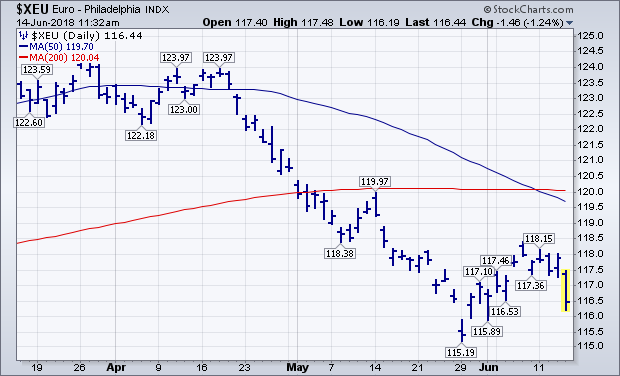
EURO CONTINUES TO REBOUND FROM IMPORTANT CHART SUPPORT -- IT'S BEING SUPPORTED BY RISING EUROZONE BOND YIELDS -- A WEAKER DOLLAR MAY BE GIVING A BOOST TO COPPER AND OIL -- ENERGY IS DAY'S STRONGEST SECTOR
by John Murphy,
Chief Technical Analyst, StockCharts.com
EURO CONTINUES TO REBOUND FROM IMPORTANT CHART SUPPORT ... Global stocks fell on Tuesday May 29 on concerns that a new election in Italy might provide a threat to the eurozone. My message on the following day (May 30) wrote about global stocks starting to recover from that scare. Included in...
READ MORE
MEMBERS ONLY
CONSUMER CYCLICALS SPDR TESTS JANUARY HIGH -- HEALTHCARE SPDR NEARS AN UPSIDE BREAKOUT -- FINANCIALS ARE BOUNCING OFF 200-DAY AVERAGE AND LEADING TODAY'S RALLY -- GROWTH STOCKS CONTINUE TO OUTPACE VALUE
by John Murphy,
Chief Technical Analyst, StockCharts.com
CONSUMER CYCLICALS NEAR NEW RECORD ... My message from Thursday, May 24 wrote about consumer cyclical stocks continuing to show relative strength. That earlier message attributed that mostly to strong leadership from apparel retailers. That's been the story again this week with retailers continuing to rally. Chart 1 shows...
READ MORE
MEMBERS ONLY
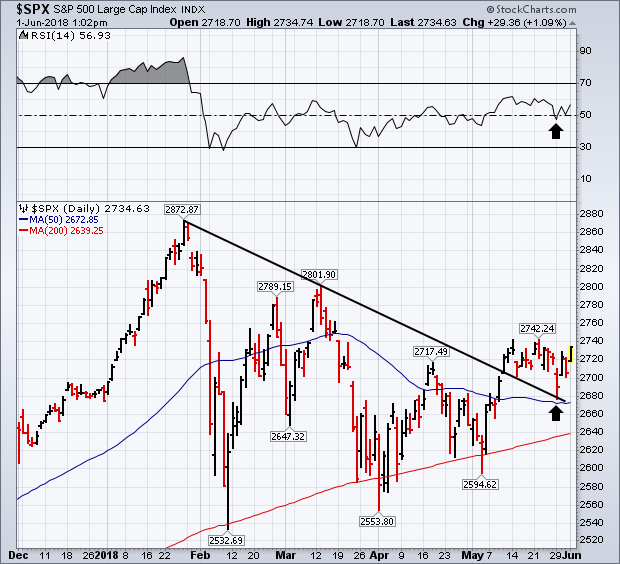
Strong Jobs Report Boosts Stocks, While S&P 500 Nears May High
by John Murphy,
Chief Technical Analyst, StockCharts.com
Editors Note: This article was originally published in John Murphy's Market Message on Friday, June 1st at 1:19pm EST.
A stronger than expected jobs report for May is giving a boost to stocks today. So is the fact that European stocks are rising (as well as Italy&...
READ MORE
MEMBERS ONLY
STRONG JOBS REPORT BOOSTS STOCKS -- S&P 500 NEARS MAY HIGH -- QQQ REACHES TWO-MONTH HIGH -- INTEL AND ALPHABET ARE LEADING IT HIGHER -- AMGEN LEADS UPTURN IN BIOTECH ISHARES -- HEALTHCARE SPDR APPEARS TO BE BASING
by John Murphy,
Chief Technical Analyst, StockCharts.com
S&P 500 NEARS MAY HIGH... A stronger than expected jobs report for May is giving a boost to stocks today. So is the fact that European stocks are rising (as well as Italy's bond and stock markets). In addition, yesterday's stock selling in response...
READ MORE
MEMBERS ONLY
STOCKS ARE REBOUNDING FROM YESTERDAY'S SELLING -- THE DOW AND S&P 500 BOUNCE OFF 50-DAY LINES -- SMALL CAPS HIT NEW HIGHS WHILE NASDAQ TESTS TOP OF TRADING RANGE -- FINANCIALS REBOUND TODAY WITH BOND YIELDS -- THE EURO IS TESTING IMPORTANT CHART SUPPORT
by John Murphy,
Chief Technical Analyst, StockCharts.com
DOW AND S&P 500 ARE BOUNCING OFF 50-DAY AVERAGES ... Stocks around the world sold off sharply yesterday (Tuesday) in a global flight from risk resulting mainly from a political crisis in Italy and, to a lesser extent, renewed threats of sanctions against China. A surge in Italian bond...
READ MORE
MEMBERS ONLY
STOCKS TRADE SIDEWAYS BUT END WEEK SLIGHTLY HIGHER -- FALLING CRUDE OIL MADE ENERGY THE WEAKEST SECTOR -- WHILE FALLING BOND YIELDS MADE UTILITIES THE STRONGEST -- INTERMARKET ANALYSIS SUGGESTS THOSE TWO TRENDS ARE LINKED
by John Murphy,
Chief Technical Analyst, StockCharts.com
UTILITIES WERE WEEK'S STRONGEST SECTOR WHILE ENERGY WAS THE WEAKEST... Stocks ended the week with small gains while continuing to trade in a sideways consolidation pattern. Technology stocks showed relative strength thanks to a strong semiconductor group. So did consumer cyclicals which were led higher by apparel retailers....
READ MORE
MEMBERS ONLY
APPAREL RETAILERS ARE HAVING A STRONG DAY -- TODAY'S RETAIL LEADERS ARE GAP, FOOT LOCKER, AND KOHLS -- CONSUMER DISCRETIONARY SPDR CONTINUES TO SHOW RELATIVE STRENGTH -- SO DO THE TRANSPORTS -- MICRON TECHNOLOGY LEADS CHIP STOCKS HIGHER
by John Murphy,
Chief Technical Analyst, StockCharts.com
APPAREL RETAILERS ARE GETTING MORE EXPENSIVE... My message on Wednesday of last week showed the S&P Retail SPDR (XRT) hitting a four-month high and becoming a new market leader. Yesterday's message showed the XRT rebounding enough to stay above its recent breakout point. Retailers are continuing...
READ MORE
MEMBERS ONLY
STOCK INDEXES END HIGHER AFTER HOLDING CHART SUPPORT -- DOW LEADERS ARE BOEING, INTEL, AND MICROSOFT -- RETAILERS LEAD S&P 500 HIGHER -- NASDAQ 100 IS DAY'S STRONGEST INDEX -- NETFLIX HITS NEW RECORD
by John Murphy,
Chief Technical Analyst, StockCharts.com
DOW BOUNCES OFF SHORT-TERM CHART SUPPORT... An early morning pullback for the Dow found support along the lows of last week before ending the day higher. That was the same story for the other major stock indexes. The black line in Chart 1 shows the Dow Industrials staying above that...
READ MORE
MEMBERS ONLY
BOEING AND CATERPILLAR LEAD INDUSTRIAL SPDR HIGHER -- THE DOW INDUSTRIALS ARE BREAKING OUT TO THE UPSIDE -- SO ARE THE TRANSPORTS -- THAT SIGNALS A DOW THEORY BUY SIGNAL IN THE MAKING
by John Murphy,
Chief Technical Analyst, StockCharts.com
INDUSTRIAL SPDR IS BREAKING OUT ... Good news on the tariff dispute with China is giving a big lift to stocks today. While all sectors are gaining ground, the day's leader is the industrial sector. Chart 1 shows the Industrial SPDR (XLI) rising pretty decisively above a falling four-month...
READ MORE
MEMBERS ONLY
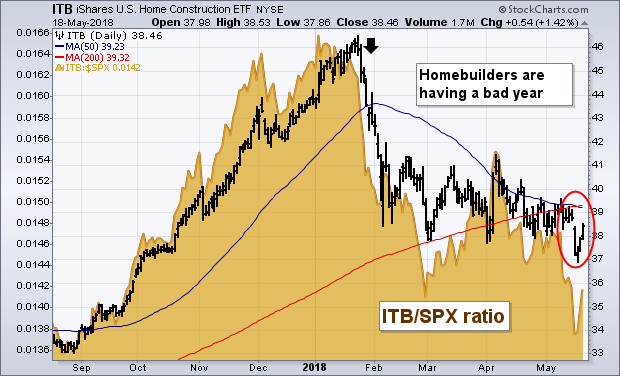
Rising Mortgage Rates Are Weighing On Homebuilders
by John Murphy,
Chief Technical Analyst, StockCharts.com
Editors Note: This article was originally published in John Murphy's Market Message on Saturday, May 18th at 9:17am EST.
The first page of today's Wall Street Journal carries the headline: "Era of Ultracheap Mortgages Ends as Rates Hit 7-Year High". The article goes...
READ MORE
MEMBERS ONLY
MORTGAGE RATES HIT A SEVEN-YEAR HIGH ALONG WITH TEN-YEAR TREASURY YIELD -- RISING MORTGAGE RATES MAY BE CONTRIBUTING TO SELLING OF HOMEBUILDING STOCKS -- A RECORD HIGH IN THE PRICE OF LUMBER ALSO RAISES THE COSTS OF BUILDING A NEW HOUSE
by John Murphy,
Chief Technical Analyst, StockCharts.com
RISING MORTGAGE RATES ARE WEIGHING ON HOMEBUILDERS ... The first page of today's Wall Street Journal carries the headline: "Era of Ultracheap Mortgages Ends as Rates Hit 7-Year HIgh". The article goes on to point out that rising mortgage rates might make it harder for prospective home...
READ MORE
MEMBERS ONLY
RETAIL SPDR JUMPS TO A FOUR-MONTH HIGH AND HAS BECOME A NEW MARKET LEADER -- RETAIL LEADERS INCLUDE MACYS, UNDER ARMOUR, AND NIKE -- RISING BOND YIELDS BOOST THE DOLLAR WHICH HELPS SMALL CAP STOCKS -- RUSSELL 2000 HITS A NEW RECORD
by John Murphy,
Chief Technical Analyst, StockCharts.com
S&P RETAIL SPDR GOES FROM LAGGARD TO LEADER... A strong April retail report yesterday was credited with helping push bond yields to the highest level in seven years. That's because it showed strong consumer spending which is two-thirds of the U.S. economy. Retail stocks must...
READ MORE
MEMBERS ONLY
TEN-YEAR TREASURY YIELD RISES TO SEVEN-YEAR HIGH -- REGIONAL BANKS GAIN ON HIGHER YIELDS -- WHILE RATE SENSITIVE REITS TUMBLE -- S&P 500 SUFFERS MODEST PULLBACK -- DOLLAR JUMPS TO SIX-MONTH HIGH WHICH HURTS GOLD BUT SUPPORTS SMALL CAPS
by John Murphy,
Chief Technical Analyst, StockCharts.com
TEN-YEAR TREASURY REACHES 3.08%... The 10-year Treasury yield rose 8 basis points today to 3.08% which pushed it above its late 2013 peak near 3.03%. The monthly bars in Chart 1 shows the TNX now trading at the highest level since the summer of 2011. That'...
READ MORE
MEMBERS ONLY
CHARTS SUGGEST THAT STOCKS HAVE TAKEN A TURN FOR THE BETTER -- VANGUARD TOTAL STOCK MARKET ETF BREAKS THROUGH RESISTANCE BARRIERS -- FOREIGN STOCK ETFS ARE ALSO BOUNCING -- HONG KONG LEADS EMERGING MARKET REBOUND -- DON'T GET COMPLACENT ON INFLATION
by John Murphy,
Chief Technical Analyst, StockCharts.com
STOCKS APPEAR TO HAVE TURNED THE CORNER ... Stocks had a very good week. Major U.S. stock indexes had their best week in two months, with all of them gaining more than 2%. Small caps and the Nasdaq led the market higher. The S&P 600 Small Cap Index...
READ MORE
MEMBERS ONLY
DOW INDUSTRIALS NEAR UPSIDE BREAKOUT -- TRANSPORTS ARE ALSO NEARING APRIL HIGH -- BANKS AND FINANCIALS SHOW MARKET LEADERSHIP -- % OF NYSE STOCKS ABOVE 200-DAY MOVING AVERAGE TURNS UP -- COMMON STOCK ONLY AD LINE HITS NEW RECORD
by John Murphy,
Chief Technical Analyst, StockCharts.com
LOOKING FOR A DOW THEORY BUY SIGNAL ... It's always a good sign to see the Dow Industrials and Transports rising together, as they're doing today. The price bars in the upper chart show the Dow Industrials testing their mid-April peak at 24,900. An upside breakout...
READ MORE
MEMBERS ONLY
THE NASDAQ 100 IS LEADING THE MARKET HIGHER -- SO IS THE TECHNOLOGY SECTOR -- THE S&P 600 SMALL CAP INDEX IS BREAKING OUT TO A NEW RECORD -- THE RUSSELL 2000 ISN'T FAR BEHIND -- THAT'S PULLING LARGE CAPS HIGHER
by John Murphy,
Chief Technical Analyst, StockCharts.com
NASDAQ 100 AND TECHNOLOGY SECTOR ACHIEVE BULLISH BREAKOUTS ... The technical picture for the stock market continues to improve on a lot of fronts. One of them is this week's upside breakout in Nasdaq market. Chart 1 shows the PowerShares Nasdaq 100 (QQQ) climbing above its mid-April high to...
READ MORE
MEMBERS ONLY
THREE-YEAR HIGH IN OIL MAKES ENERGY MARKET LEADERS -- S&P OIL & GAS EXPLORATION & PRODUCTION SPDR BREAKS OUT -- OCCIDENTAL AND EOG ARE XOP LEADERS -- RISING OIL AND BOND YIELDS EXPLAIN WHY ENERGY SHARES ARE DOING BETTER THAN UTILITIES
by John Murphy,
Chief Technical Analyst, StockCharts.com
ENERGY SHARES HAVE BECOME MARKET LEADERS... This shouldn't come as news to readers of this website. Articles written by myself and my colleagues at Stockcharts.com have been bullish on crude oil and energy stocks since the first quarter. So this is just an update of an ongoing...
READ MORE
MEMBERS ONLY
MESSAGE FROM FEBRUARY PUT CURRENT TRIANGULAR FORMATION IN ELLIOTT WAVE CONTEXT -- TRIANGLES NORMALLY HAVE FIVE WAVES WITH THREE PULLBACKS -- THIS PAST WEEK'S PULLBACK WAS THE THIRD ONE
by John Murphy,
Chief Technical Analyst, StockCharts.com
FEBRUARY MESSAGE SUGGESTED THAT TRIANGULAR FORMATION WAS LIKELY... Everyone is talking about the triangular formation that the stock market has been forming over the last three months. It's important that the situation leading up to that formation be understood, as well as its meaning. My February 21 Market...
READ MORE
MEMBERS ONLY
Stocks Are Ending The Week On a Strong Note
by John Murphy,
Chief Technical Analyst, StockCharts.com
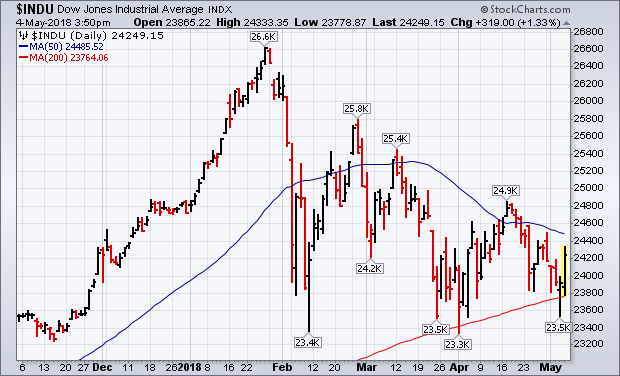
Editor's Note: This article was originally published in John Murphy's Market Message on Friday, May 4th at 3:50pm EST
STOCKS REBOUND OFF 200-DAY LINES... Chart 1 shows the Dow surging more than 300 points after surviving another test of its 200-day average yesterday. Chart 2...
READ MORE
MEMBERS ONLY
STOCKS ARE ENDING THE WEEK ON A STRONG NOTE -- NASDAQ 100 CLEARS 50-DAY AVERAGE -- SO DOES THE RUSSELL 2000 -- THE THIRD SUCCESSFUL TEST OF 200-DAY MOVING AVERAGES IS A GOOD SIGN
by John Murphy,
Chief Technical Analyst, StockCharts.com
STOCKS REBOUND OFF 200-DAY LINES... Stocks are ending the week on a strong note. Chart 1 shows the Dow surging more than 300 points after surviving another test of its 200-day average yesterday. Chart 2 shows the S&P 500 doing just as well. Both indexes still need to...
READ MORE
MEMBERS ONLY
MARKET TEST CONTINUES -- THE DOW AND S&P 500 DIPPED BELOW THEIR 200-DAY AVERAGES -- THAT PUTS THE MARKET IN DANGER OF RESTESTING ITS 2018 LOWS -- INDUSTRIAL AND FINANCIAL SPDRS LED MARKET LOWER
by John Murphy,
Chief Technical Analyst, StockCharts.com
DOW AND S&P 500 DIP BELOW 200-DAY LINES... Stocks started the day under pressure. Chart 1 shows the Dow Jones Industrial Average trading below its 200-day moving average this morning (before recovering later in the day). A close below the red line would signal that a test of...
READ MORE
MEMBERS ONLY
DOLLAR INDEX RISES TO NEW HIGH FOR THE YEAR -- THAT'S HURTING U.S. LARGE CAP PERFORMANCE -- THE DOLLAR IS GETTING A BOOST FROM RISING SPREAD BETWEEN US AND GERMAN YIELDS -- THE S&P 500 IS HEADED FOR ANOTHER TEST OF ITS 200-DAY AVERAGE
by John Murphy,
Chief Technical Analyst, StockCharts.com
DOLLAR INDEX HITS NEW 2018 HIGH... Chart 1 shows the PowerShares Dollar Index (UUP) rising today to the highest level since last December. It's also climbed back above its 200-day moving average and a falling trendline extending back to the start of 2017. The UUP may now be...
READ MORE
MEMBERS ONLY
NASDAQ 100 LEADS MARKET REBOUND -- FACEBOOK LEADS TECH SECTOR HIGHER -- VISA, HOME DEPOT, AND MICROSOFT ARE DOW LEADERS -- S&P 500 SURVIVES ANOTHER TEST OF ITS 200-DAY AVERAGE -- RISING DOLLAR CAUSES PULLBACK IN GOLD
by John Murphy,
Chief Technical Analyst, StockCharts.com
NASDAQ 100 LEADS MARKET REBOUND... Stocks are enjoying a rebound today off chart support near 200-day moving average lines. And the Nasdaq is leading it higher. Chart 1 shows the PowerShares Nasdaq 100 (QQQ) rising 2% today to outpace other stock indexes. After finding support from just above its 200-day...
READ MORE
MEMBERS ONLY
INDUSTRIALS, MATERIALS, AND TECHNOLOGY PULL MARKET LOWER AS TEN-YEAR TREASURY YIELD TOUCHES 3% -- MAJOR STOCK INDEXES ARE ALSO HEADING INTO ANOTHER TEST OF SUPPORT
by John Murphy,
Chief Technical Analyst, StockCharts.com
SECTOR ETFS TAKE A BIG HIT ... The three stock ETFs shown below are leading the stock market sharply lower. Chart 1 shows the Industrial SPDR (XLI) losing more than 3% and once again threatening its 200-day average. Caterpillar (CAT) is one of its biggest losers with a drop of -6%...
READ MORE
MEMBERS ONLY
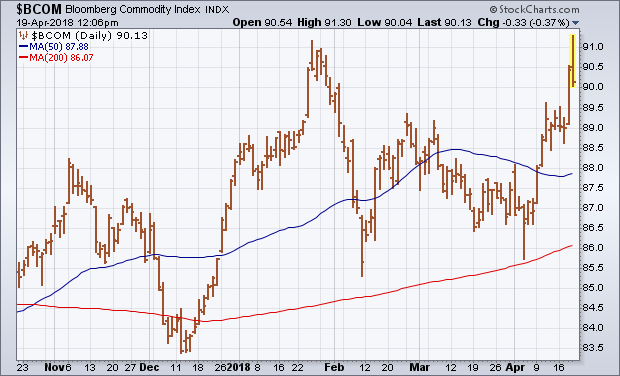
Bloomberg Commodity Index Testing Its 2018 High -- Upside Commodity Breakout Would Signal Higher Inflation -- Rising Commodity Prices Push Bond Yields Higher
by John Murphy,
Chief Technical Analyst, StockCharts.com
Editor's Note:This article was originally published inJohn Murphy's Market Messageon Thursday, April 19th at12:11pmET
BLOOMBERG COMMODITY INDEX IS NEAR AN UPSIDE BREAKOUT... This week's surge in commodity prices is starting to attract a lot of attention. That's because rising commodity...
READ MORE