MEMBERS ONLY
AIRLINES ARE LEADING INDUSTRIAL SPDR TO NEW HIGHS -- AIRLINE LEADERS ARE UAL, SOUTHWEST, AND JETBLUE -- TRANSPORTATION AVERAGE ISHARES CLEAR 50-DAY LINE -- DOW INDUSTRIALS NEAR NEW RECORD -- S&P 500 IS ALREADY THERE
by John Murphy,
Chief Technical Analyst, StockCharts.com
INDUSTRIAL SPDR HITS NEW RECORD... Chart 1 shows the Industrial Select SPDR (XLK) trading in record territory today. Today's higher price action is pushing the XLI above a sideways trading pattern that's been in effect since the start of March. Its relative strength line (above chart)...
READ MORE
MEMBERS ONLY
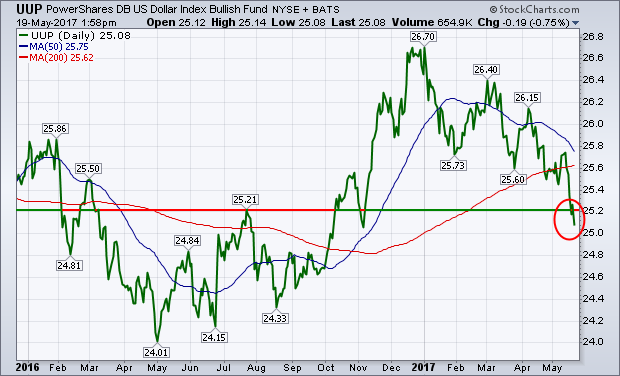
Rising European Currencies Are Pushing the Dollar Lower
by John Murphy,
Chief Technical Analyst, StockCharts.com
While stocks were rebounding last week, the dollar wasn't. Chart 1 shows the Power Shares Dollar Index ETF (UUP) falling again Friday to the lowest level since November. It may seem surprising to see the dollar continuing to drop with bond yields bouncing along with stocks. The dollar...
READ MORE
MEMBERS ONLY
RISING EUROPEAN CURRENCIES ARE PUSHING THE DOLLAR LOWER -- THE FALLING DOLLAR, HOWEVER, IS BOOSTING COMMODITIES -- BLOOMBERG COMMODITY INDEX IS BOUNCING OFF CHART SUPPORT -- FRIDAY'S REBOUND REPAIRS SOME DAMAGE
by John Murphy,
Chief Technical Analyst, StockCharts.com
RISING EUROPEAN CURRENCIES ARE PUSHING THE DOLLAR LOWER... While stocks are rebounding today, the dollar isn't. Chart 1 shows the Power Shares Dollar Index ETF (UUP) falling again today to the lowest level since November. It may seem surprising to see the dollar continuing to drop with bond...
READ MORE
MEMBERS ONLY
BIG DROPS IN BOND YIELDS AND DOLLAR SHOW LOSS OF CONFIDENCE -- FINANCIALS, SMALL CAPS, AND TRANSPORTS LEAD MARKET LOWER -- FALLING STOCK INDEXES ARE SUFFERING SHORT-TERM CHART DAMAGE -- TRADERS COULD BE SELLING IN MAY
by John Murphy,
Chief Technical Analyst, StockCharts.com
BOND YIELDS CONTINUE TO DROP ... My Saturday message issued some short-term warnings for the market. Part of that warning came from falling bond yields which hinted that fixed income traders were turning more pessimistic. Another came from weak performances by banks, small caps, and transports which are leading the stock...
READ MORE
MEMBERS ONLY
U.S. UNDERPERFORMS FOREIGN STOCKS -- DECADE OF U.S. LEADERSHIP MAY BE ENDING -- VANGUARD FOREIGN STOCK ETF HITS TEN-YEAR HIGH -- EUROZONE SHARES ALSO BREAK OUT -- UK ISHARES BENEFIT FROM STRONGER POUND -- RISING EMERGING CURRENCIES BENEFIT EM STOCKS
by John Murphy,
Chief Technical Analyst, StockCharts.com
U.S. STOCKS ARE GLOBAL UNDERACHIEVERS... Several of my previous messages have written about foreign stocks doing better than those in the U.S. this year. I'll come back to those foreign charts shortly. Chart 1, however, is designed to show how weak U.S. stocks have been...
READ MORE
MEMBERS ONLY
DROP IN BOND YIELDS SENDS CAUTION SIGNAL -- THAT KEEPS BANKS ON THE DEFENSIVE -- SMALL CAPS AND TRANSPORTS ARE SHOWING RELATIVE WEAKNESS -- AMAZON RISE OFFSETS DEPARTMENT STORE LOSSES -- TECHNOLOGY SHARES LEAD TAIWAN MARKET TO SEVENTEEN YEAR HIGH
by John Murphy,
Chief Technical Analyst, StockCharts.com
BOND YIELDS DROP ON FRIDAY... Some caution crept into financial markets near the end of the week. Part of that was reflected in Friday's sharp drop in bond yields. Chart 1 shows the 10-Year Treasury Yield falling back below its 50-day average in pretty decisive fashion. That was...
READ MORE
MEMBERS ONLY
FALLING COMMODITIES AREN'T DRIVING EMERGING MARKETS HIGHER -- TECHNOLOGY IS -- THAT'S ESPECIALLY TRUE IN SOUTH KOREA AND TAIWAN WHICH ARE EEM LEADERS -- TAIWAN SEMICONDUCTOR IS LEADING SEMICONDUCTOR ETF TO NEW HIGHS
by John Murphy,
Chief Technical Analyst, StockCharts.com
COMMODITIES DIVERGE FROM EEM... One of the long-held principles of emerging market behavior is that they're closely correlated to the direction of commodity prices. That's because several large emerging markets are exporters of commodities (like Brazil and Russia). China is the world's biggest importer...
READ MORE
MEMBERS ONLY
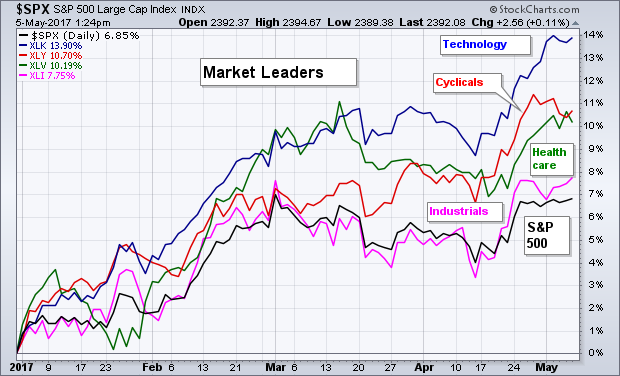
Sector Rankings and Weightings Are Still Market Positive
by John Murphy,
Chief Technical Analyst, StockCharts.com
SECTOR LEADERSHIP...One of the problems facing the current stock market is that some sectors have been rising, while others have suffered large losses. Since the start of the year, for example, technology has gained nearly 14% versus a 6.7% gain for the S&P 500. Energy stocks,...
READ MORE
MEMBERS ONLY
SECTOR RANKINGS AND WEIGHTINGS ARE STILL MARKET POSITIVE -- THE YEAR'S TOP FOUR SECTORS ACCOUNT FOR MORE THAN HALF OF THE S&P 500 -- ANOTHER 15% ARE MATCHING S&P 500 PERFORMANCE -- ENERGY IS THE BIGGEST LAGGARD BUT ACCOUNTS FOR ONLY 8% OF S&P 500
by John Murphy,
Chief Technical Analyst, StockCharts.com
SECTOR LEADERSHIP... One of the problems facing the current stock market is that some sectors have been rising, while others have suffered large losses. Since the start of the year, for example, technology has gained nearly 14% versus a 6.7% gain for the S&P 500. Energy stocks,...
READ MORE
MEMBERS ONLY
RISING RATES PUNISH GOLD -- BASE METALS AND MINERS ARE ALSO FALLING -- CHINA WEAKNESS MAY EXPLAIN WHY -- FALLING COMMODITIES AND WEAK CANADIAN DOLLAR PUSH CANADA ISHARES BELOW 200-DAY AVERAGE -- INSURANCE ETF GETS A BOOST FROM RISING BOND YIELDS
by John Murphy,
Chief Technical Analyst, StockCharts.com
GOLD ASSETS ARE ALSO FALLING... Add gold and gold miners to the list of former safe havens that are weakening. Chart 1 shows the Gold SPDR (GLD) falling to a seven-week low today and back below its moving average lines. Gold miners are doing even worse. Chart 2 shows the...
READ MORE
MEMBERS ONLY
BOND YIELDS MAY BE BOTTOMING -- BOND ETF FAILS AT 200-DAY AVERAGE -- RELATIVE WEAKNESS IN UTILITIES AND REITS HINT AT LOWER BOND PRICES -- FINANCIALS MAY BE TURNING UP -- A HIGHER FINANCIALS/UTILITIES RATIO WOULD SIGNAL HIGHER YIELDS
by John Murphy,
Chief Technical Analyst, StockCharts.com
TEN-YEAR TREASURY YIELD STILL IN UPTREND... Today's Fed announcement contained no surprises. However, the Fed's view that recent economic softness is "transitory" in nature appears to have caused an uptick in bond yields. Technical factors also appear to favor higher yields. I'll...
READ MORE
MEMBERS ONLY
DEFENSIVE CONSUMER STAPLES ARE WEAKENING -- WHILE ECONOMICALLY SENSITIVE CONSUMER CYCLICALS ARE MARKET LEADERS -- CYCLICALS/STAPLES RATIO TURNS UP -- MARTIN MARIETTA AND VULCAN MATERIALS ARE HAVING A VERY STRONG DAY
by John Murphy,
Chief Technical Analyst, StockCharts.com
CONSUMER STAPLES ARE WEAKENING... Defensive parts of the market are starting to weaken. That includes consumer staples. At the same time, money is flowing back into more economically sensitive stock groups like consumer discretionary stocks (more on that shortly). That's normally a good sign for the market. Chart...
READ MORE
MEMBERS ONLY
HEALTHCARE IS QUIETLY MOVING HIGHER -- INDIVIDUAL LEADERS ARE EDWARDS LIFESCIENCES, VARIAN MEDICAL, AND ABBVIE -- U.S. MEDICAL DEVICES ETF REPRESENTS THE STRONGEST PART OF HEALTHCARE -- BOSTON SCIENTIFIC IS ONE OF ITS LEADERS
by John Murphy,
Chief Technical Analyst, StockCharts.com
HEALTH CARE SPDR NEARS RECORD HIGH... Although it hasn't received much attention lately, the healthcare sector is quietly moving higher. In fact, healthcare is the third strongest sector this year behind technology and consumer cyclicals. And its chart looks promising. Chart 1 shows the Health Care SPDR (XLV)...
READ MORE
MEMBERS ONLY
NASDAQ HITS NEW RECORD WHILE DOW INDUSTRIALS AND S&P 500 TURN UP -- SMALL CAPS HIT NEW RECORD AND SHOW NEW LEADERSHIP -- SO DO MATERIALS -- ALCOA LEADS ALUMINUM SHARES HIGHER -- FLIGHT FROM SAFE HAVENS PUSHES GOLD MINERS LOWER
by John Murphy,
Chief Technical Analyst, StockCharts.com
MARKET INDEXES TURN HIGHER ... The stock market is continuing to benefit from the "risk on" rally that started yesterday after the weekend vote in France. And all signs are currently positive. Chart 1 shows the PowerShares QQQ hitting a new record for the second day in row. The...
READ MORE
MEMBERS ONLY
FRENCH VOTE SENDS GLOBAL STOCKS HIGHER -- FRANCE LEADS EUROPEAN RALLY -- EUROZONE ISHARES REACH THREE-YEAR HIGH -- A STRONGER EURO WOULD BOOST EUROZONE PERFORMANCE -- U.S. STOCKS FOLLOW EUROPE HIGHER AS SAFE HAVENS WEAKEN
by John Murphy,
Chief Technical Analyst, StockCharts.com
FRANCE LEADS EUROPE HIGHER... French stocks are leading big gains in eurozone stocks. A strong Euro is giving an even bigger boost to eurozone ETFs. Chart 1 shows MSCI France iShares (EWQ) surging more than 5% to the highest level in three years. That compares with a 4% gain in...
READ MORE
MEMBERS ONLY
MONEY IS ROTATING INTO THE EUROZONE WHICH IS OUTPERFORMING THE U.S. -- BRITISH STOCKS ARE LAGGING BEHIND -- BRITISH ISHARES HAVE BEEN HURT BY A WEAK POUND -- ROTATION INTO EUROPE MAY SLOW U.S. RALLY, BUT SUGGESTS GLOBAL BULL MARKET IS STILL INTACT
by John Murphy,
Chief Technical Analyst, StockCharts.com
EUROZONE STOCKS ARE ATTRACTING GLOBAL FUNDS ... Part of the reason that U.S. stocks haven't been doing so well during 2017 is that global funds are moving into other parts of the world. Especially to Europe. More specifically, the eurozone. The reason is simple. U.S. stocks are...
READ MORE
MEMBERS ONLY
ENERGY SHARES LEAD MARKET LOWER AS CRUDE OIL DROPS TO TWO-WEEK LOW -- TWO ENERGY ETFS FALL TO NEW 2017 LOW -- DOW INDUSTRIALS CLOSE AT TWO-MONTH LOW -- S&P 500 REMAINS ON THE DEFENSIVE -- ON BALANCE VOLUME LOOKS WEAK
by John Murphy,
Chief Technical Analyst, StockCharts.com
CLIMB IN GASOLINE SUPPLIES HURTS CRUDE... A surprising jump in gasoline supplies caused heavy selling in the price of crude oil and gasoline. Chart 1 shows the United States Oil Fund (USO) falling nearly 4% today to the lowest level in two weeks. The USO also fell back below its...
READ MORE
MEMBERS ONLY
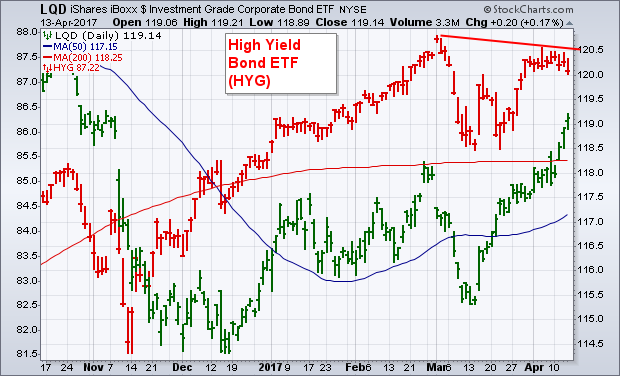
Investment Grade Corporates Outperform Junk Bonds
by John Murphy,
Chief Technical Analyst, StockCharts.com
The green bars in the chart below show the iBoxx Investment Grade Corporate Bond iShares (LQD) trading at a new five-month high after clearing its 200-day average. The red bars, however, show the iBoxx High Yield Corporate Bond iShares (HYG) backing off from its early March high. The fact that...
READ MORE
MEMBERS ONLY
BOND YIELD FALLS TO FIVE MONTH LOW -- RELATIVE WEAKNESS IN HIGH YIELD BONDS IS BAD FOR STOCKS -- FINANCIALS AND SMALL CAPS LEAD MARKET LOWER -- S&P 500 CLOSES BELOW 50-DAY AVERAGE -- SAFE HAVEN BUYING PUSHES GOLD TO FIVE MONTH HIGH
by John Murphy,
Chief Technical Analyst, StockCharts.com
10-YEAR TREASURY YIELD FALLS TO FIVE-MONTH LOW... Bond yields have been slipping since March as investors have had second thoughts about the so-called Trump bump in stocks and the economy. Geopolitical concerns may also be causing profit-taking in stocks and buying of safe havens like bonds and gold. That risk-off...
READ MORE
MEMBERS ONLY
DOW AND S&P 500 ARE THREATENING THEIR 50-DAY AVERAGES -- TECHNOLGY SELLING WEAKENS THE NASDAQ -- FINANCIALS AND TRANPORTS CONTINUE TO UNDERPERFORM -- VIX HITS FIVE-MONTH HIGH
by John Murphy,
Chief Technical Analyst, StockCharts.com
DOW AND S&P 500 MAY BE SLIPPING BELOW 50-DAY LINES... The short-term trend for the market continues to weaken. Chart 1 shows the Dow Jones Industrial SPDR (DIA) trading below its 50-day average in early afternoon trading. The DIA hasn't closed below that support line since...
READ MORE
MEMBERS ONLY
STOCK INDEXES STAY ABOVE 50-DAY AVERAGES AFTER MISSILE ATTACK -- SMALL CAPS AND FINANCIALS NEED TO DO BETTER -- BOND YIELDS BOUNCE OFF BOTTOM OF 2017 TRADING RANGE -- DOLLAR RALLIES AS SAFE HAVEN YEN WEAKENS -- GOLD STRUGGLES AT 200-DAY AVERAGE
by John Murphy,
Chief Technical Analyst, StockCharts.com
MAJOR STOCK INDEXES HOLD 50-DAY LINES ... Entering today's trading, stocks were relatively flat on the week. Bond prices, however, were nearing the top of their 2017 trading range. Other safe haven assets like gold and the yen have been bouncing as well. Yesterday's missile attack on...
READ MORE
MEMBERS ONLY
PIPELINES ARE YEAR'S STRONGEST ENERGY GROUP -- ALERIAN MLP ETF COVERS THAT GROUP -- ONEOK AND MPLX ARE PIPELINE LEADERS -- TRANSCANADA CORP HOLDS 200-DAY LINE -- GLOBAL X MLP & ENERGY INFRASTRUCTURE ETF BOUNCES OFF 200-DAY LINE
by John Murphy,
Chief Technical Analyst, StockCharts.com
DOW JONES US PIPELINES INDEX IS TURNING UP ... My last two messages suggested that the energy sector was trying to stabilize near its 200-day average. That's based on the assumption that the price of oil is also bottoming. My Saturday message further suggested that oil service stocks were...
READ MORE
MEMBERS ONLY
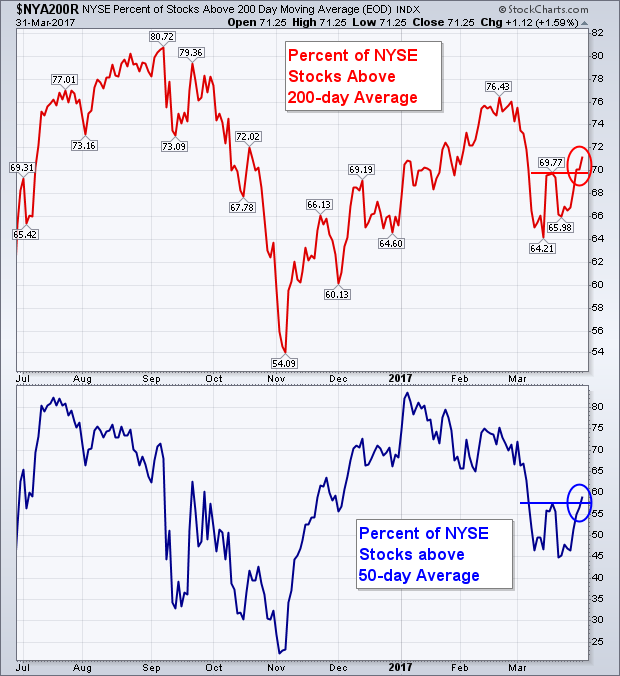
Percent of Stocks Over 200-Day Average Turns Back Up
by John Murphy,
Chief Technical Analyst, StockCharts.com
My last two messages have stressed the importance of the 200-day moving average. It's what separates uptrends from downtrends. In order to sustain a bull market, more stocks have be above their 200-day average than below it. And that is currently the case. The red line in Chart...
READ MORE
MEMBERS ONLY
BUILDING MATERIALS STOCKS MAY ALSO BE BOTTOMING -- MARTIN MARIETTA AND VULCAN MATERIALS FIND SUPPORT NEAR 200-DAY AVERAGES -- OIL SERVICE STOCKS LEAD ENERGY SECTOR HIGHER AND SHOW BETTER RELATIVE STRENGTH
by John Murphy,
Chief Technical Analyst, StockCharts.com
MARTIN MARIETTA MATERIALS BOUNCES OFF 200-DAY AVERAGE... My Thursday message showed three stock groups that had fallen to their 200-day averages and were starting to stabilize. They included commodity-related groups like energy and metals and mining ETFs. They also included heavy construction stocks like Fluor (FLR) and Jacobs Engineering (JEC)...
READ MORE
MEMBERS ONLY
HEAVY CONSTRUCTION AND MINING STOCKS TEST 200-DAY AVERAGES -- SO ARE ENERGY SHARES AS CRUDE OIL STRENGTHENS -- % OF NYSE STOCKS ABOVE 200-DAY AVERAGE REMAINS STRONG -- CONSUMER DISCRETIONARY SPDR HITS NEW RECORD -- SMALL CAPS OUTPACE LARGE CAPS
by John Murphy,
Chief Technical Analyst, StockCharts.com
HEAVY CONSTRUCTION INDEX BOUNCES OFF 200-DAY AVERAGE... This week's rebound by major stock indexes off their 50-day averages has been encouraging. So is the fact that several economically-sensitive stock groups are finding support at their 200-day lines. Chart 1 shows the Dow Jones US Heavy Construction Index bouncing...
READ MORE
MEMBERS ONLY
STOCKS REBOUND FROM SUCCESSFULL TEST OF 50-DAY AVERAGES -- ECONOMICALLY-SENSITIVE STOCKS LEAD WHILE STAPLES AND UTILITIES LAG -- BOND PRICES WEAKEN WHILE HIGH YIELD BONDS REBOUND -- GOLD AND THE EURO MEET RESISTANCE AT 200-DAY LINES AS DOLLAR REBOUNDS
by John Murphy,
Chief Technical Analyst, StockCharts.com
STOCK ETFS REBOUND OFF 50-DAY AVERAGE ... Yesterday's message showed major stock indexes stabilizing at their 50-day averages. Today, they're rebounding impressively today off that rising support line. Chart 1 shows the Dow Jones Industrial SPDR (DIA) having its best day in a month. Chart 2 shows...
READ MORE
MEMBERS ONLY
STOCK INDEXES TEST 50-DAY LINES -- BOND PRICES TEST OVERHEAD RESISTANCE -- DOLLAR FALLS TO 200-DAY LINE -- GOLD REACHES RESISTANCE -- MARKETS HAVE REACHED INFLECTION POINT WHICH WILL DETERMINE IF THE TRUMP RALLY IS OVER OR JUST PAUSING
by John Murphy,
Chief Technical Analyst, StockCharts.com
MARKET INDEXES TRY TO FIND SUPPORT AT THEIR 50-DAY LINES... Today's lower open pushed several stock indexes down to their 50-day averages. Chart 1 shows the Dow Industrials trying to regain lost ground in afternoon trading. Chart 2 shows the S&P 500 trying to stay above...
READ MORE
MEMBERS ONLY
FALLING DOLLAR CONTRIBUTES TO RISING EMERGING MARKET CURRENCIES AND STOCKS -- MEXICAN PESO AND STOCK ETF ALSO GAIN GROUND -- A RISING YUAN IS HELPING BOOST CHINESE STOCKS -- STOCK GAINS EVAPORATE ON POSTPONEMENT OF HEALTHCARE VOTE
by John Murphy,
Chief Technical Analyst, StockCharts.com
EMERGING MARKET CURRENCIES SUPPORT RISING STOCKS... Previous messages have shown the rise in emerging market stocks, partially owing to the drop in the U.S. dollar. The same can be said of EM currencies. The red line in Chart 1 shows Emerging Markets iShares (EEM) rising to the highest level...
READ MORE
MEMBERS ONLY
MAJOR STOCK INDEXES SUFFER BIGGEST DROP THIS YEAR -- SMALL CAPS AND TRANSPORTS LOOK EVEN WORSE -- BANKS LEAD FINANCIALS LOWER ON FALLING BOND YIELDS -- FALLING DOLLAR BOOSTS GOLD -- EURO NEARS TEST OF FEBRUARY HIGH
by John Murphy,
Chief Technical Analyst, StockCharts.com
STOCK ETFS SELLOFF... The market is suffering its worst day this year. Chart 1 show the PowerShares Nasdaq QQQ experiencing a downside reversal day after hitting a record high this morning. Its 14-day RSI has fallen out of overbought territory over 70 for the first time since December which shows...
READ MORE
MEMBERS ONLY
All-World Index Hits New Record
by John Murphy,
Chief Technical Analyst, StockCharts.com
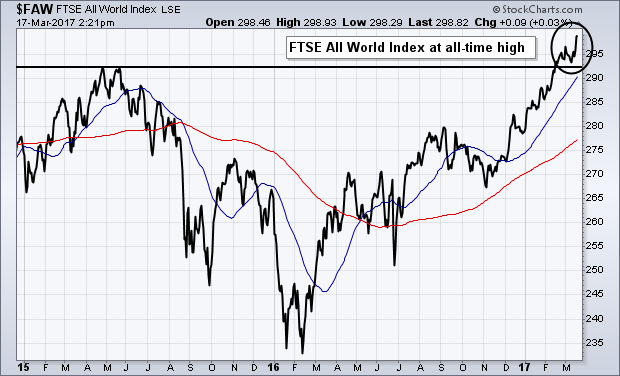
Chart 1 shows the FTSE All-World Stock Index ($FAW) trading at a new record high. The FAW includes stocks from 47 developed and emerging markets. It just recently cleared its 2015 high which resumed its major uptrend. That's a positive sign because it shows that the stock market...
READ MORE
MEMBERS ONLY
ALL-WORLD INDEX HITS NEW RECORD -- FOREIGN STOCKS CONTINUE TO RALLY -- ASIA LEADS EMERGING MARKETS HIGHER -- EUROPE ALSO LOOKS STRONG -- THAT INCLUDES IRELAND
by John Murphy,
Chief Technical Analyst, StockCharts.com
FTSE ALL-WORLD INDEX HITS NEW RECORD... Chart 1 shows the FTSE All-World Stock Index ($FAW) trading at a new record high. The FAW includes stocks from 47 developed and emerging markets. It just recently cleared its 2015 high which resumed its major uptrend. That's a positive sign because...
READ MORE
MEMBERS ONLY
STOCKS AND BONDS RALLY ON FED ANNOUNCEMENT -- PULLBACK IN YIELDS BOOSTS REITS AND UTILITIES, WHILE BANKS LAG -- DOLLAR DROP BOOSTS GOLD -- STOCK INDEXES REACT POSITIVELY -- EMERGING MARKETS LEAD FOREIGN STOCK ETFS HIGHER
by John Murphy,
Chief Technical Analyst, StockCharts.com
FED MOVE VIEWED AS DOVISH... The Fed hiked rates today as expected, with expectations for two more hikes this year. Judging from immediate market reactions, the Fed announcement is being viewed as somewhat dovish. For one thing, bond yields are dropping. Chart 1 shows the 10-Year Treasury Yield falling sharply....
READ MORE
MEMBERS ONLY
SMALL CAPS AND TRANSPORTS CONTINUE TO WEAKEN -- ENERGY STOCKS CONTINUE TO DROP ON FALLING OIL PRICE -- COMMODITY SELLOFF WEAKENS INFLATION TRADE -- HIGH YIELD BONDS SELL OFF ON COMMODITY WEAKNESS
by John Murphy,
Chief Technical Analyst, StockCharts.com
SMALL CAPS AND TRANSPORTS WEAKEN ... Bond yields are hitting multi-year highs in anticipation of a Fed rate hike tomorrow. Stocks remain in an uptrend, but weakness in some stock groups is sending short-term caution signals. Small caps and transports continue to weaken. So do energy shares along with falling oil...
READ MORE
MEMBERS ONLY
INTEREST RATES CLIMB ALONG WITH THE DOLLAR -- INVESTMENT GRADE CORPORATES WEAKEN -- DROP IN JUNK BONDS MAY BE SHORT-TERM WARNING FOR STOCKS -- SMALL CAPS THREATEN 50-DAY LINE -- ENERGY SPDR PLUNGES ON FALLING CRUDE OIL
by John Murphy,
Chief Technical Analyst, StockCharts.com
BOND YIELDS CONTINUE TO CLIMB... Chart 1 shows the 10-Year Treasury Yield (TNX) climbing to 2.55% which is the highest level this year. The 2-Year Treasury yield (most sensitive to a Fed rate hike) has climbed to 1.35% which is the highest level in seven years. Odds for...
READ MORE
MEMBERS ONLY
HOMEBUILDING LEADERS ARE DR HORTON, LENNAR, AND PULTEGROUP -- HEALTH CARE INSURERS LED HIGHER BY HUMANA, CIGNA, AND UNITEDHEALTH GROUP -- BIOTECH AND DRUG ETFS MEET RESISTANCE -- HEALTHCARE SPDR TESTS OLD HIGHS -- BAXTER INTL RECOVERS
by John Murphy,
Chief Technical Analyst, StockCharts.com
DR HORTON, LENNAR, AND PULTE LOOK STRONG... Recent messages have shown bullish breakouts in a couple of ETFs tied to housing. The stronger of the two is the U.S. Home Construction iShares (ITB) which is the purest play on homebuilders. That's because its five biggest stocks are...
READ MORE
MEMBERS ONLY
Two-Year Treasury Yield Reaches Seven-Year High, Dollar Turns Up
by John Murphy,
Chief Technical Analyst, StockCharts.com
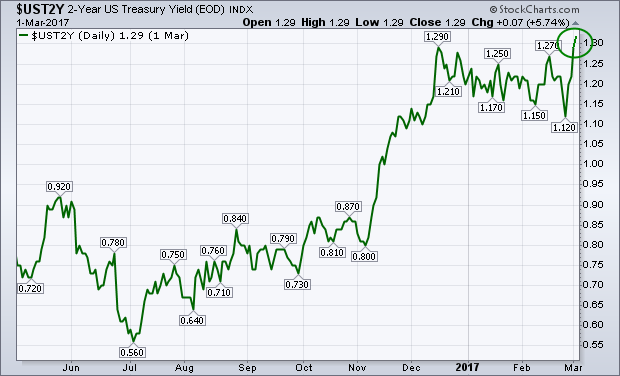
Chart 1 shows the 2-Year Treasury yield climbing above 1.30% on Thursday, for the first time in seven years. That shorter term yield is more sensitive to the potential for a rate hike than longer-range maturities. That suggests that fixed income traders are taking expectations for a March rate...
READ MORE
MEMBERS ONLY
TWO-YEAR TREASURY YIELD HITS SEVEN -YEAR HIGH ON INCREASED ODDS FOR MARCH RATE HIKE -- THAT'S BOOSTING THE DOLLAR WHICH MAY BE ENDING ITS 2017 CORRECTION -- GOLD ETF STALLS AT 200-DAY LINE -- GOLD MINERS ARE EVEN WEAKER
by John Murphy,
Chief Technical Analyst, StockCharts.com
TWO-YEAR TREASURY YIELD REACHES SEVEN-YEAR HIGH... Chart 1 shows the 2-Year Treasury yield climbing above 1.30% today for the first time in seven years. That shorter term yield is more sensitive to the potential for a rate hike than longer-range maturities. That suggests that fixed income traders are taking...
READ MORE
MEMBERS ONLY
STOCKS HIT NEW RECORDS AS BOND YIELDS AND THE DOLLAR CLIMB -- FINANCIALS, INDUSTRIALS, AND MATERIALS LEAD RALLY -- SO DO SMALL CAPS AND TRANSPORTS -- GOLD AND OTHER SAFE HAVENS WEAKEN
by John Murphy,
Chief Technical Analyst, StockCharts.com
STOCKS SURGE TO NEW RECORDS ... Last night's presidential speech appears to have re-energized the reflation trade that favors stocks over bonds, and economically-sensitive stocks in particular. The first three charts show ETFs of the three major U.S. stock indexes gapping into new highs. Their RSI lines remain...
READ MORE
MEMBERS ONLY
BIOTECH ISHARES NEAR UPSIDE BREAKOUT -- TWO SMALLER BIOTECH ETFS HAVE ALREADY BROKEN OUT -- TEN YEAR TREASURY YIELD THREATENS 2017 LOW -- SMALL CAPS ARE STARTING TO WEAKEN
by John Murphy,
Chief Technical Analyst, StockCharts.com
BIOTECH ISHARES NEAR SEPTEMBER HIGH... I've been writing about the recent upturn in the healthcare sector. And that the rally was being led higher medical device and equipment stocks, as well as health insurers. Biotechs and pharmaceuticals have lagged behind. Chart 1, however, shows the Nasdaq Biotechnology iShares...
READ MORE
MEMBERS ONLY
TRANSPORTS DIVERGE FROM INDUSTRIALS -- UTILITY SURGE MAY ALSO SIGNAL DEFENSIVE SHIFT -- UTILITY/TRANSPORTATION RATIO TURNS UP -- CONSUMER STAPLES SPDR NEARS NEW RECORD -- THAT MAY ALSO SIGNAL A MORE DEFENSIVE TONE IN AN OVERBOUGHT MARKET
by John Murphy,
Chief Technical Analyst, StockCharts.com
TRANSPORTS START TO WEAKEN ... A number of short-term caution signals are showing up for stocks which might be hinting that the current rally is due for a pullback. Some of those caution signals are coming from relationships between the three Dow Averages. Let's start with the transports. Chart...
READ MORE