MEMBERS ONLY
Two Versions of the New York Advance-Decline Line Giving Different Signals
by John Murphy,
Chief Technical Analyst, StockCharts.com
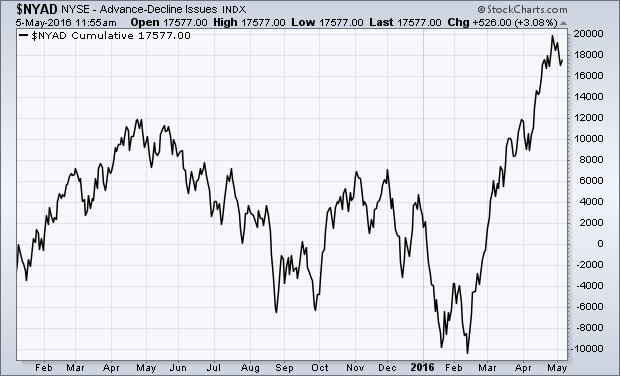
THE TRADITIONAL NYAD LINE HITS NEW RECORD... Chartists look to the NYSE Advance-Decline line to help determine the trend of the stock market. The NYAD line is simply a running cumulative total of the number of advancing stocks minus decliners on the big board. And it has a good track...
READ MORE
MEMBERS ONLY
ONLY ONE VERSION OF THE NYSE ADVANCE-DECLINE LINE HAS HIT A NEW RECORD -- THE VERSION THAT INCLUDES COMMON STOCKS ONLY HASN'T -- RECENT HISTORY FAVORS THE MORE TRADITIONAL VERSION -- NYSE COMPOSITE INDEX STALLS AT NOVEMBER HIGH
by John Murphy,
Chief Technical Analyst, StockCharts.com
THE TRADITIONAL NYAD LINE HITS NEW RECORD... Chartists look to the NYSE Advance-Decline line to help determine the trend of the stock market. The NYAD line is simply a running cumulative total of the number of advancing stocks minus decliners on the big board. And it has a good track...
READ MORE
MEMBERS ONLY
GLOBAL STOCKS SLIDE AS MONEY MOVES INTO TREASURIES -- STAPLES AND UTILITIES SHOW RELATIVE STRENGTH -- CLOROX AND CVS ARE STAPLE LEADERS -- PFIZER HAS A STRONG DAY -- BANK INDEX PULLS BACK FROM 200-DAY AVERAGE
by John Murphy,
Chief Technical Analyst, StockCharts.com
SHORT-TERM STOCK PULLBACK DEEPENS... Global stocks are continuing the pullback that started last week. Chart 1 shows the S&P 500 heading down toward a test of its early April low and/or its moving average lines. The 14-day RSI line (top of chart) has slipped below the 50...
READ MORE
MEMBERS ONLY
DOLLAR CONTINUES TO WEAKEN AS EURO AND YEN RALLY -- THAT FAVORS HIGHER COMMODITY PRICES, AND GOLD IN PARTICULAR -- GOLD INDICATORS SUPPORT HIGHER PRICES -- SO DOES THE FACT THAT GOLD MINERS ARE RISING EVEN FASTER THAN THE COMMODITY
by John Murphy,
Chief Technical Analyst, StockCharts.com
DOLLAR INDEX TESTS SUMMER LOW... The decline in the U.S. dollar continued this past week. The daily bars in Chart 1 show the US Dollar Index ($USD) falling to the lowest level since last summer. That was its lowest close since the start of 2015. Part of the dollar...
READ MORE
MEMBERS ONLY
VALUE ISHARES CONTINUE TO OUTPACE GROWTH ISHARES WHICH ARE BEING PULLED DOWN BY TECHNOLOGY SELLING -- BUT FINANCIALS, HEALTHCARE, ENERGY, AND INDUSTRIALS SECTORS ARE RISING -- BOEING CLEARS 200-DAY LINE AND LEADS DOW HIGHER
by John Murphy,
Chief Technical Analyst, StockCharts.com
ROTATION FROM GROWTH TO VALUE CONTINUES... Last Thursday I wrote about a rotation from "growth stocks" which rely on growing earnings into "value stocks" that are viewed as relatively cheap. That rotation is continuing. Chart 1 shows the S&P Value iShares (IVE) trading at...
READ MORE
MEMBERS ONLY
COMMODITIES ETF CHALLENGES 200-DAY AVERAGE WHICH MAY BE PULLING TREASURY BOND YIELDS HIGHER -- HIGHER YIELDS ARE HELPING FINANCIALS -- INDUSTRIAL SPDR SIGNALS SHIFT TO ECONOMICALLY-SENSITIVE STOCKS -- RYDER, PACCAR, AND LOCKHEED MARTIN LEAD XLI HIGHER
by John Murphy,
Chief Technical Analyst, StockCharts.com
RISING COMMODITIES PULL BOND YIELDS HIGHER... The rally in commodity markets may be about to move into higher gear. Chart 1 shows the DB Commodities Tracking Index Fund (DBC) on the verge of moving above its 200-day average for the first time in two years. A weaker dollar is one...
READ MORE
MEMBERS ONLY
HEALTHCARE PROVIDER INDEX REACHES SIX-MONTH HIGH -- LED BY AETNA AND ANTHEM -- RAIL INDEX TURNS UP -- LEADERS ARE NORFOLK SOUTHERN, KANSAS CITY SOUTHERN, AND UNION PACIFIC -- DOW TRANSPORTS EXCEED MAJOR RESISTANCE LINE -- S&P GROWTH ISHARES UNDERPERFORM
by John Murphy,
Chief Technical Analyst, StockCharts.com
HEALTH CARE PROVIDERS INDEX TURNS UP ... I've been writing a lot about the recent upturn in the healthcare sector. Most of my attention has been on biotechs, pharmaceuticals, and medical equipment stocks (Boston Scientific, Thermo Fisher, Zimmer, and Waters). Today's message will focus on health care...
READ MORE
MEMBERS ONLY
VALUE STOCKS GAIN ON GROWTH -- VALUE GROUPS INCLUDE FINANCIALS, ENERGY, AND HEALTHCARE -- STAPLES AND UTILITIES TURN DOWN ON BOUNCING BOND YIELDS -- RISING COMMODITIES HURT BOND PRICES -- VERIZON LEADS TELECOM LOWER AS DIVIDEND-PAYING STOCKS WEAKEN
by John Murphy,
Chief Technical Analyst, StockCharts.com
S&P 500 GROWTH ISHARES ARE STARTING TO LAG... For the first time since the latest bull market began in 2009, value stocks are gaining ground on growth stocks. The bull market is in its seventh year and looking very mature. One way some investors are participating in the...
READ MORE
MEMBERS ONLY
FREEPORT MCMORAN AND SOUTHERN COPPER RISE WITH PRICE OF COPPER -- SILVER SHARES SURGE WITH THE COMMODITY -- SILVER STANDARD RESOURCES AND SILVER WHEATON NEAR UPSIDE BREAKOUTS -- FIRST MAJESTIC SILVER SURGES IN CANADA -- TORONTO STOCK INDEX LOOKS STRONG
by John Murphy,
Chief Technical Analyst, StockCharts.com
COPPER SHARES SURGE ON RISING PRICE OF COPPER... Money continues to flow into shares tied to industrial and precious metals. Copper shares are rising with the commodity. Copper is up nearly 2% today and 13% from its January bottom. Chart 1 shows Freeport McMoran (FCX) surging 7% to reach the...
READ MORE
MEMBERS ONLY
HEALTHCARE SPDR TRADES OVER 200-DAY AVERAGE -- WATERS CORP BREAKS OUT TO NEW HIGH -- ABBV, AMGEN, AND GILEAD SHOW STRONGER CHART PATTERNS -- PHARMA IS BEING LED HIGHER BY MERCK AND BMY -- ABBOTT LABS CLEARS 200-DAY LINE
by John Murphy,
Chief Technical Analyst, StockCharts.com
HEALTHCARE SPDR CLEARS 200-DAY AVERAGE... Healthcare stocks continue to get better. The daily bars in Chart 1 show the Health Care SPDR (XLV) trading back over its 200-day average and at the highest level since the start of the year. The XLV/SPX ratio (top of chart) has been rising...
READ MORE
MEMBERS ONLY
Financials Have a Strong Week, As Do Economically-Sensitive Materials and Industrials
by John Murphy,
Chief Technical Analyst, StockCharts.com
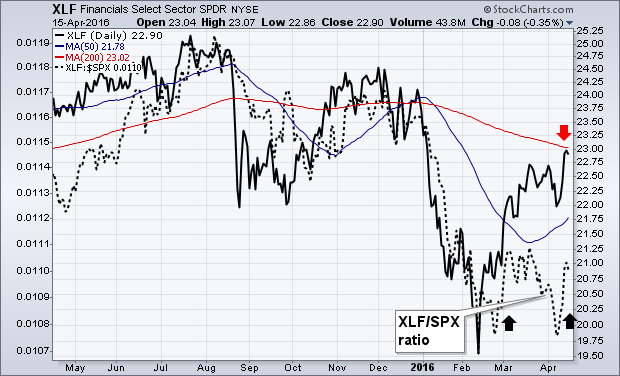
FINANCIALS HAVE A STRONG WEEK...Financials went from the year's weakest sector to the strongest gainer this past week. Chart 1 shows theFinancials Sector SPDR (XLF)climbing to the highest level in three months and challenging its 200-day moving average (red arrow). The dotted line, which is theXLF/...
READ MORE
MEMBERS ONLY
FINANCIALS HAVE A STRONG WEEK -- SO DO ECONOMICALLY-SENSITIVE MATERIALS AND INDUSTRIALS -- SMALL AND MIDCAP INDEXES TURN UP -- EQUAL-WEIGHTED S&P 500 ETF BREAKS OUT -- NYSE ADVANCE-DELINE LINE HITS NEW RECORD -- FTSE ALL-WORLD EQUITY INDEX TURNS UP
by John Murphy,
Chief Technical Analyst, StockCharts.com
FINANCIALS HAVE A STRONG WEEK... Financials went from the year's weakest sector to the strongest gainer for this past week (+3.8%). Chart 1 shows the Financials Sector SPDR (XLF) climbing to the highest level in three months and challenging its 200-day moving average (red arrow). The dotted...
READ MORE
MEMBERS ONLY
SILVER AND STEEL STOCKS CONTINUE TO SURGE -- STEEL LEADERS INCLUDE RELIANCE, STEEL DYNAMICS, AND NUCOR -- FREEPORT MCMORAN LEADS MATERIALS -- CHINESE STOCKS LEAD EMERGING MARKETS HIGHER -- JP MORGAN LEADS BANKS AND FINANCIALS HIGHER
by John Murphy,
Chief Technical Analyst, StockCharts.com
GLOBAL X SILVER MINERS ETF CONTINUES TO SOAR... My market message from March 7 showed major upturns in industrial and precious metal mining stocks. I made the point that silver stocks were doing better that gold miners. That was due to the fact that silver is both an industrial and...
READ MORE
MEMBERS ONLY
ENERGY SPDR CLEARS 200-DAY AVERAGE -- ENERGY LEADERS INCLUDE CHEVRON, EXXON MOBIL, PIONEER NATURAL RESOURCES, EOG, AND SCHLUMBERGER -- S&P METALS AND MINING SPDR REACHES NINE-MONTH HIGH
by John Murphy,
Chief Technical Analyst, StockCharts.com
ENERGY SPDR TRADES ABOVE 200-DAY MOVING AVERAGE... My weekend message showed the Energy Sector SPDR (XLE) rising up to test its 40-week moving average for the third time since last May. I also pointed out that weekly MACD lines had already exceeded their fourth quarter highs, which increased the odds...
READ MORE
MEMBERS ONLY
FALLING BOND YIELDS HURT BANKS -- SAFE HAVEN BUYING OF TREASURIES, GOLD, AND YEN SHOW A CAUTIOUS MOOD -- HEALTH CARE SPDR RISES TO TEST 200-DAY AVERAGE -- ENERGY SPDR TESTS 40-WEEK AVERAGE -- MACD LINES LOOK POSITIVE
by John Murphy,
Chief Technical Analyst, StockCharts.com
FALLING BOND YIELDS HURTS BANKS ... Treasury bond yields continue to drop. Chart 1 shows the 10-Year Treasury Bond Yield touching the lowest level since February. Part of that is buying of Treasury bonds in an overbought stock market. Part of it is also historically low sovereign bond yields in Europe...
READ MORE
MEMBERS ONLY
FTSE ALL-WORLD INDEX STALLS AT RESISTANCE LINE -- RISING EURO HURTS GERMANY ISHARES -- SURGING YEN PUNISHES JAPANESE STOCKS -- OVERBOUGHT DOW INDUSTRIALS NEAR OVERHEAD RESISTANCE -- WILSHIRE 5000 TESTS MAJOR RESISTANCE LINE -- SO DO DOW TRANSPORTS
by John Murphy,
Chief Technical Analyst, StockCharts.com
FTSE WORLD INDEX BACK BELOW 200-DAY LINE... Last Wedneday's message showed the FTSE All World Stock Index ($FAW) trying to move above its 200-day moving average. Although it rose above that resistance line for a couple of days, Chart 1 shows that it's back below it...
READ MORE
MEMBERS ONLY
HEALTHCARE SECTOR IS LOOKING HEALTHIER -- BOSTON SCIENTIFIC, THERMO FISHER SCIENTIFIC, AND ZIMMER BIOMET HOLDINGS ARE MEDICAL EQUIPMENT LEADERS -- BIOTECH LEADERS ARE ABBVIE, AMGEN, AND GILEAD -- THE LAST TWO ARE TESTING MAJOR DOWN TRENDLINES
by John Murphy,
Chief Technical Analyst, StockCharts.com
HEALTHCARE SPDR REACHES THREE-MONTH HIGH... Money is continuing to rotate into healthcare stocks which had been the year's weakest sector. It's been the market's strongest sector for the last two trading days. Chart 1 shows the HealthCare Sector SPDR (XLV) reaching the highest level...
READ MORE
MEMBERS ONLY
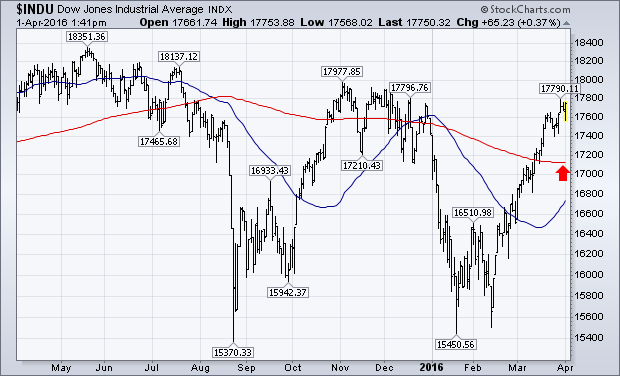
Dow and S&P 500 Near Fourth Quarter Highs
by John Murphy,
Chief Technical Analyst, StockCharts.com
The chart below shows the Dow Industrials moving closer to a test of its fourth quarter highs near 18000. Given the steepness of the recent rally, it might run into some resistance there. But its trend is still higher. The second chart shows the S&P 500 moving closer...
READ MORE
MEMBERS ONLY
BIOTECHS LEAD HEALTHCARE HIGHER -- BOTH ETFS APPEAR TO BE BOTTOMING -- BIOTECH LEADERS ARE REGENERON, ILLUMINA, AND AMGEN -- NASDAQ COMPOSITE IS TRADING ABOVE 200-DAY LINE -- S&P 600 SMALL CAP INDEX IS TESTING RESISTANCE LINE
by John Murphy,
Chief Technical Analyst, StockCharts.com
BIOTECHS LEAD HEALTHCARE HIGHER... Last Friday's message showed that healthcare was the year's weakest sector, and most of that was because of a very weak biotech group. [It also mentioned that biotechs were holding back the QQQ. More on that later]. For the first time in...
READ MORE
MEMBERS ONLY
FTSE ALL WORLD STOCK INDEX IS LOOKING A LOT STRONGER -- DOLLAR REMAINS WEAK ON DOVISH FED TALK -- THAT'S BOOSTING COMMODITIES AND MULTINATIONAL STOCKS -- NYSE ADVANCE-DECLINE IS TESTING SPRING 2015 HIGH
by John Murphy,
Chief Technical Analyst, StockCharts.com
FTSE ALL WORLD INDEX OUT OF DANGER... Back on February 17, I wrote a market message showing the FTSE All World Stock Index ($FAW) starting to find support at its 2011 peak. [The FAW includes 2900 stocks in 47 developed and emerging countries, including the US]. I pointed out that...
READ MORE
MEMBERS ONLY
QQQ CLEARS 200-DAY AVERAGE -- LAM RESEARCH SCORES BULLISH BREAKOUT -- YAHOO IS CLOSE TO DOING THE SAME -- FACEBOOK AND MICROSOFT HAVE A STRONG DAY -- APPLE IS REBOUNDING FROM LONG TERM SUPPORT AND MAY BE BOTTOMING
by John Murphy,
Chief Technical Analyst, StockCharts.com
QQQ CLEARS 200-DAY LINE... The market was led higher by the Nasdaq market today. Last Friday's message showed the PowerShares QQQ Trust testing its 200-day moving average. Chart 1 shows the QQQ clearing that important chart barrier today. Since the QQQ is comprised of the largest 100 non-financial...
READ MORE
MEMBERS ONLY
STOCK MARKET DIGESTS ITS GAINS -- DOW INDUSTRIALS AND S&P 500 REMAIN ABOVE 200-DAY LINES -- THE NASDAQ 100, HOWEVER, IS STILL TESTING THAT RESISTANCE LINE -- BIOTECHS HAVE BEEN THE BIGGEST DRAG ON THE NASDAQ -- GILEAD SCIENCES IS STILL IN DOWNTREND
by John Murphy,
Chief Technical Analyst, StockCharts.com
DOW AND S&P 500 HOLD ABOVE 200-DAY LINES... Given the size of the market rally since mid-February, it's not surprising to see it spend the past week consolidating. While the market had its first down week after five up weeks, very little changed on the charts...
READ MORE
MEMBERS ONLY
DEFENSIVE STOCKS LIKE STAPLES AND UTILITIES START TO LOSE LEADERSHIP ROLE -- INDUSTRIAL SPDR BULLISH BREAKOUT SHOWS NEW LEADERSHIP -- THAT'S USUALLY BEEN A GOOD SIGN FOR THE MARKET -- MATERIALS AND TECHNOLOGY SPDRS TEST FOURTH QUARTER HIGHS
by John Murphy,
Chief Technical Analyst, StockCharts.com
STAPLES START TO LOSE LEADERSHIP... Consumer staples were market leaders during December and January as the market started to weaken. That's normal. The daily bars in Chart 1 plot the Consumer Staples SPDR (XLP) along with the XLP/SPX relative strength ratio since last October. The XLP/SPX...
READ MORE
MEMBERS ONLY
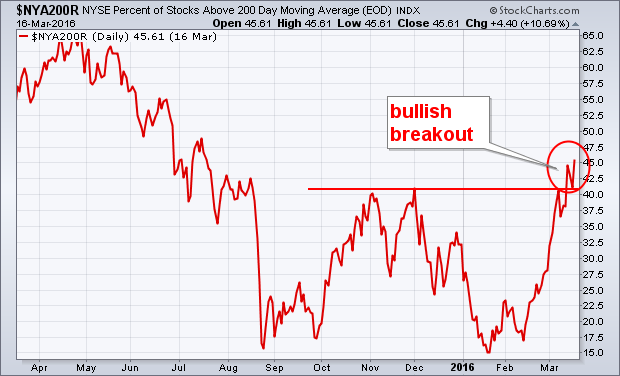
NYSE Percent Above 200MA Turns Up, AD Line Breaks Out
by John Murphy,
Chief Technical Analyst, StockCharts.com
NYSE PERCENT OF STOCKS ABOVE 200-DAY MOVING AVERAGE TURNS UP... The previous Wedneday's message showed the % of NYSE stocks trading above their 200-day moving average moving up to challenge its fourth quarter high around 40% (after bottoming in January in oversold territory below 20%). Chart 9 shows the...
READ MORE
MEMBERS ONLY
COMMODITIES CONTINUE TO RALLY ON FALLING DOLLAR AND DOVISH FED -- SILVER WHEATON LEADS SILVER ETF HIGHER -- SOUTHERN COPPER CLEARS 200-DAY LINE -- FEDEX AND DOW TRANSPORTS CLEAR 200-DAY LINES
by John Murphy,
Chief Technical Analyst, StockCharts.com
U.S. DOLLAR FALLS TO FIVE-MONTH LOW ... Yesterday's dovish statement from the Fed that it was scaling back plans to raise short-term rates had the dual effect of pushing interest rates and the dollar lower. Chart 1 shows the Power Shares Dollar Index (UUP) falling to the lowest...
READ MORE
MEMBERS ONLY
FED TAKES MORE DOVISH TONE ON RATE HIKES -- SHORTER RATES LEAD YIELDS LOWER -- TIPS REBOUND ON INCREASED INFLATION EXPECTATIONS -- DROP IN DOLLAR BOOSTS COMMODITIES -- CANADIAN DOLLAR CLEARS 200-DAY LINE -- S&P 500 EXTENDS GAIN OVER 200-DAY AVERAGE
by John Murphy,
Chief Technical Analyst, StockCharts.com
FED SCALES BACKS 2016 RATE CUTS... The Fed left rates unchanged as expected. However, it also scaled back any potential rate hikes for this year. Previous estimates of three or four possible hikes were lowered to two. It also sounded more cautious on the global economy. Initial market reactions were...
READ MORE
MEMBERS ONLY
MATERIALS AND DISCRETIONARY SPDRS CLEAR 200-DAY AVERAGES -- CHEMICAL LEADERS ARE DOW, DUPONT, AND EASTMAN -- WHIRLPOOL EXCEEDS 200-DAY LINE -- BROADCOM AND ASML LEAD SEMICOMDUCTORS HIGHER -- CORPORATE BONDS JUMP AS TREASURIES SLIDE
by John Murphy,
Chief Technical Analyst, StockCharts.com
A LOT OF 200-DAY LINES ARE BEING TESTED OR EXCEEDED... Major stocks indexes in the U.S. are moving up to challenge their 200-day averages. Those are important tests because the 200-day line is the measure most used by chartists to distinguish uptrends from downtrends. A number of group indexes...
READ MORE
MEMBERS ONLY
PERCENT OF NYSE STOCKS ABOVE 50-DAY AVERAGE REACHES TWO-YEAR HIGH -- % OVER 200-DAY LINE TESTS FOURTH QUARTER HIGH -- NYSE ADVANCE-DECLINE LINE LOOKS STRONG -- NYSE BULLISH PERCENT INDEX CLEARS 50% -- BUYING OF CORPORATE AND JUNK BONDS SHOWS NEW OPTIMISM
by John Murphy,
Chief Technical Analyst, StockCharts.com
PERCENT OF NYSE STOCKS ABOVE 50-DAY AVERAGE REACHES TWO-YEAR HIGH... The debate continues about whether the stock market faces the likelihood of another downleg. Several technical indicators seem to suggest that a major selloff is unlikely. Here's the first one. I recently showed the NYSE percent of stocks...
READ MORE
MEMBERS ONLY
MINERS HAVE ANOTHER BIG DAY -- ETFS TIED TO MINING AND PRECIOUS METALS CLEAR 200-DAY LINES -- STEEL STOCKS BENEFIT FROM RECORD JUMP IN IRON ORE -- ADD NUCOR TO LIST OF STEEL LEADERS -- PAN AMERICAN LEADS SILVER STOCKS HIGHER
by John Murphy,
Chief Technical Analyst, StockCharts.com
METALS AND MINING SPDR CLEARS 200-DAY AVERAGE ... Precious and base metal stocks are continuing their strong rally on the back of rising commodity prices. Chart 1 shows the S&P Metals and Mining SPDR (XME) trading above its 200-day average and at the highest level in five months. Its...
READ MORE
MEMBERS ONLY
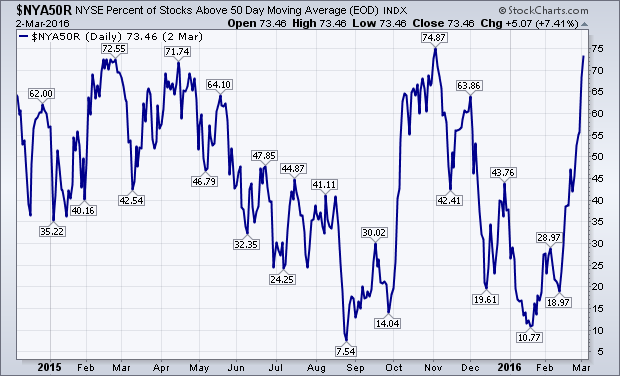
NYSE Percent of Stocks Above 50-Day Average Nears November High
by John Murphy,
Chief Technical Analyst, StockCharts.com
A lot of attention is now being paid to stocks testing or exceeding their moving average lines. My February 20 message had a headline suggesting that the percent of NYSE stocks trading above their 50- and 200-day moving averages might be bottoming. Let's take another look. The blue...
READ MORE
MEMBERS ONLY
COMMERCIAL VEHICLE AND TRUCK GROUP LEADS INDUSTRIAL SECTOR HIGHER -- DEERE, PACCAR, AND CATERPILLAR TEST 200-DAY AVERAGES -- GATX CLEARS ITS 200-DAY LINE TO LEAD TRANSPORTATION GROUP -- SO HAS JB HUNT
by John Murphy,
Chief Technical Analyst, StockCharts.com
LEAD INDUSTRIALS HIGHER... Economically-sensitive industrial stocks continue to show new strength. A leading industrial group is the Dow Jones US Commerical Vehicles and Trucks Index ($DJUSHR). Chart 1 shows that index climbing more than 2% today to a new three month high. It includes big percentage gainers like Joy Global...
READ MORE
MEMBERS ONLY
ALCOA AND FREEPORT MCMORAN CONTINUE TO RISE WITH INDUSTRIAL METALS -- SO DO STEEL STOCKS -- AKSTEEL, STEEL DYNAMICS, AND RELIANCE STEEL CLEAR 200-DAY AVERAGES -- AUSSIE AND CANADIAN DOLLARS ARE RISING WITH COMMODITIES
by John Murphy,
Chief Technical Analyst, StockCharts.com
ALCOA AND FREEPORT MCMORAN LEAD MARKET HIGHER ... A lot of attention is being paid to the recent upturn in the price of oil and energy shares, and its potentially positive influence on the global economy and stocks. An even more impressive upturn is taking place in industrial metals and their...
READ MORE
MEMBERS ONLY
MARKET RALLY PUSHES MAJOR INDEXES OVER 50-DAY AVERAGES TO STRENGTHEN SHORT-TERM TREND -- INDUSTRIAL AND TECHNOLOGY SPDRS CLEAR 200-DAY LINES -- BOUNCE IN BOND YIELD BOOSTS BANKS AND FINANCIALS -- EMERGING MARKETS LEAD GLOBAL RALLY
by John Murphy,
Chief Technical Analyst, StockCharts.com
MAJOR STOCK INDEXES ARE ABOVE 50-DAY AVERAGES ... The market's short-term trend continues to strengthen. Today's strong gains have pushed all major U.S. stock indexes above their 50-day moving averages. Chart 1 shows the Dow Industrials trading at a two-month high, with a good shot at...
READ MORE
MEMBERS ONLY
LOW BOND YIELDS CONTINUE TO BENEFIT DIVIDEND-PAYERS -- THAT INCLUDES STAPLES, REITS, UTILITIES, AND TELECOM -- DIVIDEND ISHARES TEST FOURTH QUARTER HIGH -- STAPLE AND UTILITY SPDRS HIT NEW HIGHS -- REITS AND TELECOM ETFS SHOW RELATIVE STRENGTH
by John Murphy,
Chief Technical Analyst, StockCharts.com
BOND YIELDS ARE STILL LOW... I recently showed the 10-Year Treasury Bond Yield ($TNX) bouncing off an "island reversal" bottom formed a couple of weeks ago (see circle), and pointed out that pattern usually signals a "short-term" change in direction. Chart 1 shows the TNX moving...
READ MORE
MEMBERS ONLY
STOCKS TRY TO STABILIZE WITH OIL -- SHORT-TERM TREND REMAINS NEUTRAL -- BANKS ALSO BOUNCE WITH OIL IN AFTERNOON TRADING -- KEEPING SHORT-TERM BUY SIGNALS IN PERSPECTIVE
by John Murphy,
Chief Technical Analyst, StockCharts.com
SHORT-TERM TREND STILL UNCERTAIN... Stocks opened lower with oil today, but are trying to stabilize with the commodity in afternoon trading. Chart 1, however, shows a somewhat neutral picture for the market's short-term trend. After successfully testing its January low earlier this month, the S&P 500...
READ MORE
MEMBERS ONLY
RALLY PUSHES STOCK INDEXES INTO TEST OF OVERHEAD RESISTANCE -- RISING OIL AND BASE METALS BOOST ENERGY AND MINERS -- ALCOA AND FREEPORT MCMORAN LEAD MATERIALS HIGHER -- BRAZIL AND RUSSIA HAVE STRONG DAY ON BACK OF COMMODITY RALLY
by John Murphy,
Chief Technical Analyst, StockCharts.com
DOW IS THE FIRST TO CLEAR FEBRUARY HIGH ... A strong Monday stock rally pushed U.S. stock indexes right up against initial overhead barriers at their early February peak and 50-day averages. Chart 1 shows the Dow Industrials being the first to exceed its February high. It is still, however,...
READ MORE
MEMBERS ONLY
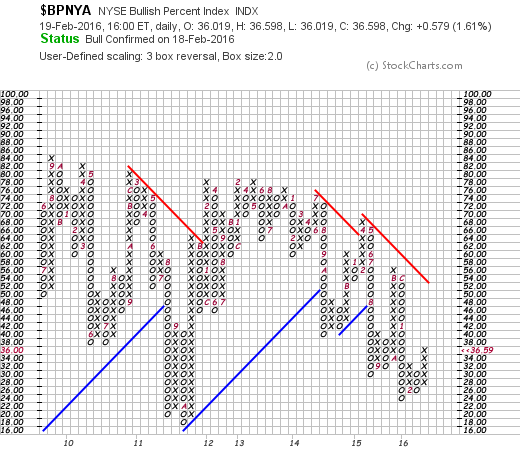
NYSE Bullish Percent Index Turns Up
by John Murphy,
Chief Technical Analyst, StockCharts.com
One of the widely watched gauges of market direction is theNYSE Bullish Percent Index ($BPNYA). That index measures the percent of NYSE stocks that are in point & figure uptrends. Chart 1 shows a point & figure version of that index. [P&F charts show alternating columns of Xs...
READ MORE
MEMBERS ONLY
NYSE COMPOSITE INDEX TESTS OVERHEAD RESISTANCE -- IT'S ALSO IN A LONG-TERM SUPPORT ZONE -- NYSE BULLISH PERCENT INDEX GIVES P&F BUY SIGNAL -- % OF NYSE STOCKS ABOVE MOVING AVERAGES MAY BE BOTTOMING -- UAL AND DELTA BOOST INDUSTRIAL SPDR
by John Murphy,
Chief Technical Analyst, StockCharts.com
NYSE COMPOSITE INDEX TESTS RESISTANCE... Stocks had their best week of the year. While that's encouraging, they'll have to do a lot more to signal that the global correction/bear market has run its course. I'm focusing on the NYSE Composite Index (NYA) today...
READ MORE
MEMBERS ONLY
MARKET RALLY CONTINUES AS OIL BOUNCES -- ENERGY AND MATERIAL STOCKS ARE MARKET LEADERS -- FREEPORT MCMORAN HAS BIG DAY -- CH ROBINSON LEADS TRUCKERS HIGHER -- SMALL CAP INDEX TESTS MAJOR SUPPORT IN OVERSOLD CONDITION
by John Murphy,
Chief Technical Analyst, StockCharts.com
S&P 500 NEARS TEST OF FEBRUARY HIGH ... My weekend message suggested that stocks had put in a short-term bottom. We'll find out soon enough if last week's bottom was even more significant. Chart 1 shows the S&P 500 Index nearing a test...
READ MORE
MEMBERS ONLY
FRIDAY'S RALLY PREVENTS CHART BREAKDOWN -- OIL RALLY GIVES STOCKS A STRONG BOOST -- ENERGY SHARES ARE IN POTENTIAL SUPPORT ZONE -- BANK SHARES TEST LONG-TERM SUPPORT LINES -- FRIDAY'S JUMP IN BOND YIELDS ALSO HELPS STOCKS
by John Murphy,
Chief Technical Analyst, StockCharts.com
MARKET BENDS BUT DOESN'T BREAK... It looked on Thursday like the major U.S. stock indexes were on the verge of closing below their January lows. A Thursday afternoon rebound, however, followed by a 2% gain on Friday kept those support levels intact. Chart 1 shows the Dow...
READ MORE