MEMBERS ONLY
SMALL AND MID CAP ETFS BOUNCE WITHIN CORRECTIONS, UPTREND TRUMPS FLAG BREAK IN XLF, INSURANCE HITS NEW HIGH AS REGIONAL BANKS RECOVER, FINANCE BREADTH IMPRESSES, FINDING BREADTH SYMBOLS, COMMODITY ETF BECOMES VERY OVERSOLD, OIL REMAINS IN STEEP DOWNTREND
by John Murphy,
Chief Technical Analyst, StockCharts.com
SMALL AND MID CAP ETFS BOUNCE WITHIN CORRECTIONS... Link for today's video. Small-caps have been the Achilles heel of the stock market by showing both relative and absolute weakness the last two months. Even with this poor performance, the decline in the Russell 2000 iShares (IWM) over the...
READ MORE
MEMBERS ONLY
SPY LOSES MOMENTUM, DIVERGENCE FOR RSP, HOME BUILDERS ETFS HIT NEW HIGHS, NETWORKING ETF BREAKS WEDGE, SEMIS SLIP, FINDING POCKETS OF STRENGTH, BONDS BREAK FREE AS COMMODITIES EXTEND LOSSES, SCTR MAKES BIG MOVE FOR XLY, IYR LEADS IN JULY-AUGUST
by John Murphy,
Chief Technical Analyst, StockCharts.com
S&P 500 SPDR LOSES MOMENTUM... Link for today's video. Before getting too bearish on the S&P 500 SPDR (SPY), chartists should keep in mind that this broad index ETF is trading above its rising 200-day SMA, the 50-day SMA is above the 200-day and...
READ MORE
MEMBERS ONLY
DOW DEATH CROSS, S&P 500 BREAKS KEY SMA, FINANCE LEADS LOWER, GOLDMAN AND MORGAN WEIGH ON BROKER-DEALERS ETF, BONDS EXTEND SURGE AS UTILITIES GAIN, HANG SENG LEADS CHINESE STOCKS LOWER, DAX LEADS EURO STOCKS LOWER
by John Murphy,
Chief Technical Analyst, StockCharts.com
DOW GETS DEATH CROSS AS S&P 500 BREAKS 200-DAY... The major index ETFs were down in early trading on Wednesday with the finance, technology and consumer discretionary sectors leading the way lower. It is quite negative to see these key sectors leading on the way down. The Dow...
READ MORE
MEMBERS ONLY
REVIEW OF MAJOR INDEX ETFS (QQQ,SPY,IJR,MDY),HOUSING AND RETAIL SPLIT, BIOTECH ETFS TEST KEY SUPPORT LEVELS, SPOT CRUDE TESTS 2015 LOWS, COPPER AND ALUMINUM HIT MULTI-YEAR LOWS, WEBINAR DETAILS
by John Murphy,
Chief Technical Analyst, StockCharts.com
REVIEW OF MAJOR INDEX ETFS (QQQ,SPY,IJR,MDY)... Click here for the webinar recording. The large-cap index ETFs continue to be tossed and turned within trading ranges, while the small and mid cap index ETFs remain in corrective mode. Chart 1 shows the S&P 500 SPDR (SPY)...
READ MORE
MEMBERS ONLY
SMALL-CAP ETF TESTS SUPPORT, SMALL-GROWTH AND EW QQQ SURPRISE, FINANCE-HEALTHCARE-TECH-STAPLES LEAD, BANK ETFS FORM CONTINUATION PATTERNS, HACK HITS KEY RETRACEMENT, TWO CYBER SECURITY STOCKS, VIDEO DETAILS
by John Murphy,
Chief Technical Analyst, StockCharts.com
SMALL-CAP ETF TESTS SUPPORT AGAIN... Link for today's video. I noted that the "average" stock is in correction mode in last week's Market Message and also showed the short-term downtrends in the small-cap, mid-cap and equal-weight ETFs. These short-term downtrends remain in play, but...
READ MORE
MEMBERS ONLY
AVERAGE STOCK CORRECTING, XLK ISLAND-PENNANT, RYT BEAR CHANNEL, XSD FIRMS AS IGN BREAKS WEDGE, ITB HOLDS TREND AMID DISPERSION, XRT TESTS SPRING LOWS, CHARTLIST, SUMMARY AND MARKETCARPET DEMO, VIDEO TIMELINE
by John Murphy,
Chief Technical Analyst, StockCharts.com
AVERAGE STOCK IS CORRECTING... Link for today's video. As its names suggest, the Equal-Weight S&P 500 ETF (RSP) tells us what is happening to the average stock in the S&P 500. This is opposed to the S&P 500 SPDR, which is weighted...
READ MORE
MEMBERS ONLY
QQQ BREAKS SMALL WEDGE, IWM EXTENDS CORRECTION, CONSUMER DISCRETIONARY AND HEALTHCARE WEIGH, ENERGY GETS OVERSOLD BOUNCE
by John Murphy,
Chief Technical Analyst, StockCharts.com
QQQ BREAKS SMALL WEDGE... Weakness in techs and small-caps weighed on the market Thursday. Chart 1 shows the Nasdaq 100 ETF (QQQ) falling over 1% with a sharp decline late Thursday afternoon. The ETF is still in an uptrend overall, but today's decline broke wedge support for a...
READ MORE
MEMBERS ONLY
SECTOR/INDUSTRY STALEMATES, SPY MAINTAINS TREND, MDY AND IJR CORRECT, FINANCE MAINTAINS UPTREND WITH INSURANCE LEADING, STAPLES LEAD AS DISCRETIONARY GETS STUCK, INDEX AD LINES TURN MIXED, SECTOR BREADTH, WEBINAR DETAILS
by John Murphy,
Chief Technical Analyst, StockCharts.com
SECTOR STALEMATE DEFINES TRADING RANGE... Click here for the Webinar recording. The S&P 500 and SPY are stuck in trading ranges because sector performance is split. Chartists can even see the market split at the industry group level as well. Looking at six-month performance for the 100+ Dow...
READ MORE
MEMBERS ONLY
TLT HITS MOMENT-OF-TRUTH, 30-YR T-YIELD TESTS, YIELD CURVE REMAINS POSITIVE, CRUDE SUFFERS BIGGEST DECLINE, COMMODITIES BOOSTS BONDS, UTILITIES LEAD IN JULY, REITS BOUNCE WITH BONDS
by John Murphy,
Chief Technical Analyst, StockCharts.com
TLT HITS MOMENT-OF-TRUTH WITH BIG WEEK ... Link for today's video. The first week of the month is always packed with economic reports and employment data, which makes it a big week for bonds. Bonds caught a bid over the last three weeks as the 20+ YR T-Bond ETF...
READ MORE
MEMBERS ONLY
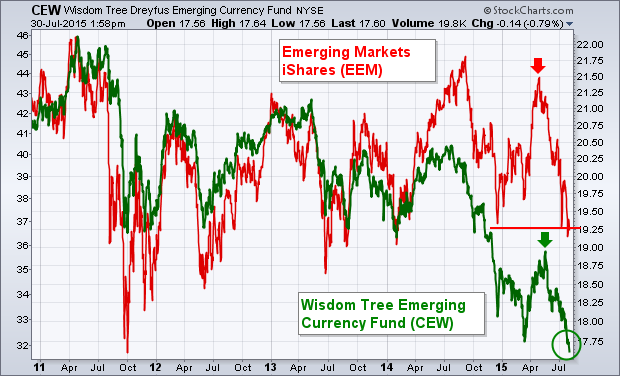
Emerging Market Currencies Pull Stocks Lower
by John Murphy,
Chief Technical Analyst, StockCharts.com
Emerging market assets are suffering from the dual threat of rising U.S. interest rates and a stronger dollar. The most direct result is seen in EM currencies. The green line in Chart 9 shows the Wisdom Tree Emerging Currency Fund (CEW) falling to the lowest level in five years....
READ MORE
MEMBERS ONLY
SPY HOLDS UPTREND, SECTOR SPLIT DEFINES RANGE, REVIEWING 2007 TOP, SECTOR BREADTH IN 2007-2008, SECTOR BREADTH IN 2015, HEALTHCARE PROVIDERS ETF CORRECTS, SOFTWARE ETF CONSOLIDATES, AIRLINES TRY TO TAKE OFF
by John Murphy,
Chief Technical Analyst, StockCharts.com
SPY UPTREND CONTINUES TO HOLD... Link for today's video. By now we are all aware of deteriorating breadth on the NYSE and relative weakness in small-caps. We are also well aware of the trading range for the S&P 500 since March. The trading ranges for the...
READ MORE
MEMBERS ONLY
NYSE COMPOSITE REMAINS IN CONSOLIDATION -- % OF NYSE STOCKS ABOVE MOVING AVERAGES NEEDS TO SHOW IMPROVEMENT -- S&P INDEXES BOUNCE OFF 200-DAY AVERAGES -- SMALL CAPS NEED TO DO BETTER -- TRANSPORTS FINALLY SHOW SOME BOUNCE -- DOLLAR REBOUND CONTINUES
by John Murphy,
Chief Technical Analyst, StockCharts.com
NYSE COMPOSITE FINDS SUPPORT AT MARCH LOW... I wrote a message three Thursdays ago (July 9) on Elliott Waves which suggested that the May high on the NYSE Composite Index had completed a major upwave from its 2011 bottom (Wave 3), and was entering a Wave 4 period of correction...
READ MORE
MEMBERS ONLY
SECTORS FOR FOCUS, EW S&P 500 CORRECTS, PPO AS A TREND INDICATOR, AMAZON EFFECT DISSIPATES IN RCD, RETAIL WEAKENS AS HOUSING HOLDS, HEALTHCARE-STAPLES LEAD, TWO INTERNATIONAL ETFS TO WATCH, WEBINAR EXTRAS
by John Murphy,
Chief Technical Analyst, StockCharts.com
FOUR SECTORS FOR FOCUS ... Click here for the webinar recording. The materials and energy sectors are weighing on the broader market with outsized losses, but the broader market is still holding up relatively well. PerfChart 1 shows the performance for RSP and the nine equal-weight sectors since the beginning of...
READ MORE
MEMBERS ONLY
MARKING SUPPORT FOR BIOTECH ETFS, BANKING ETFS MAINTAIN TRENDS, FINANCE-STAPLES-HEALTHCARE LEAD NEW HIGHS, CHINESE STOCKS FALL FROM RETRACEMENT, HIGH-LOW PERCENT INDICATORS TURN, SECTOR RANKINGS REMAIN UNCHANGED
by John Murphy,
Chief Technical Analyst, StockCharts.com
MARKING KEY SUPPORT FOR BIOTECH ETFS... Link for today's video. Biotechs were star performers in 2012, 2013 and 2014. These stocks, and their respective ETFs, are also leading in 2015, even after last week's big decline. The Biotech iShares (IBB) and Biotech SPDR (XBI) are both...
READ MORE
MEMBERS ONLY
DOW ENDS THE WEEK BELOW 200-DAY AVERAGE -- INDUSTRIAL SPDR DROPS TO NINE-MONTH LOW -- S&P 500 ENDS BELOW 50-DAY LINE -- SMALL AND MIDCAP STOCKS THREATEN 200-DAY LINES -- NYSE ADVANCE-DECLINE LINE HITS NEW LOW -- CRB INDEX FALLS TO SIX-YEAR LOW
by John Murphy,
Chief Technical Analyst, StockCharts.com
DOW ENDS BELOW 200-DAY LINE -- XLI FALLS TO NEW 2015 LOW... The stock market had a bad chart week. Chart 1 shows the Dow Industrial Average closing well below its 200-day moving average and within striking distance of its July low. [Friday's drop marked the first "...
READ MORE
MEMBERS ONLY
UPTRENDS UNDER THREAT, BUT NOT REVERSED, SECTOR LEADERS ARE NEGATIVELY CORRELATED, CONSUMER DISCRETIONARY HOLDS THE KEY, HOUSING ETFS MAINTAIN UPTRENDS, RETAIL SPDR CONSOLIDATES WITHIN TREND, IS CORN FOR REAL?
by John Murphy,
Chief Technical Analyst, StockCharts.com
UPTRENDS ARE UNDER THREAT, BUT NOT YET REVERSED... Link for today's video. The major stock indices are still in uptrends, but price action has flattened over the last few months. Nevertheless, the S&P 500 is still around 2% from its all time high, while the S&...
READ MORE
MEMBERS ONLY
FIVE WEAK SECTORS ARE PULLING MARKET LOWER -- ENERGY AND MATERIALS ARE BEING HURT BY FALLING COMMODITIES -- UTILITIES, TELECOM, AND REITS ARE BEING HURT BY FALLING BOND PRICES -- CATERPILLAR AND 3M LEAD INDUSTRIALS LOWER
by John Murphy,
Chief Technical Analyst, StockCharts.com
FIVE SECTORS PULLING S&P 500 LOWER... There are ten major sectors in the S&P 500. Although five of them have held up relatively well, five others are in downtrends and dragging the market lower. Two of the worst sectors are tied to falling commodity prices. Chart...
READ MORE
MEMBERS ONLY
APPLE, MICROSOFT, AND CHIP STOCKS PULL TECHNOLOGY SECTOR LOWER -- EQUAL WEIGHTED NASDAQ AND TECHNOLOGY ETFS ARE NOT CONFIRMING RECENT ADVANCES -- EQUAL WEIGHTED S&P 500 ETF ALSO SHOWS RELATIVE WEAKNESS
by John Murphy,
Chief Technical Analyst, StockCharts.com
APPLE AND MICROSOFT PULL TECHNOLOGY SECTOR LOWER... Heavy selling in Apple and Microsoft is pulling the technology sector lower today. Chart 1 shows Apple (AAPL) gapping down in morning trading. Chart 2 shows Microsoft (MSFT) trading lower as well. Since those two are among the biggest stocks in the technology...
READ MORE
MEMBERS ONLY
MAJOR INDICES BIFURCATE, EW S&P 500 STALLS IN TREND, IWM REMAINS IN UPTREND, MINDING THE GAPS, WEAKNESS WITHIN TECHNOLOGY, SEMIS WEIGH, HACK LOOKS VULNERABLE, WEBINAR FEATURES
by John Murphy,
Chief Technical Analyst, StockCharts.com
MAJOR STOCK INDICES BIFURCATE ... Click here for the webinar recording. The stock market is still positive year-to-date, but we are starting to see some bifurcation in the major indices over the last few months. It is still not clear if these divergences will lead to a significant decline or if...
READ MORE
MEMBERS ONLY
QQQ BREADTH LAGS, MEDIUM-TERM BREADTH WEAKENS, 55% OF MARKET REMAINS BULLISH, XLY AND XLV LEAD OVERSOLD BOUNCES, GOLD BREAKS TO NEW LOWS, XME AND XES PLUNGE TO NEW LOWS, BREADTH INDICATOR DETAILS AND CHART LINKS
by John Murphy,
Chief Technical Analyst, StockCharts.com
QQQ HITS NEW HIGH, BUT BREADTH LAGS... After a nice vacation and some time away from the market, I am going to start of with the indicator tables for the major index ETFs and sectors to get a broad overview. Before looking at these tables, let's look at...
READ MORE
MEMBERS ONLY
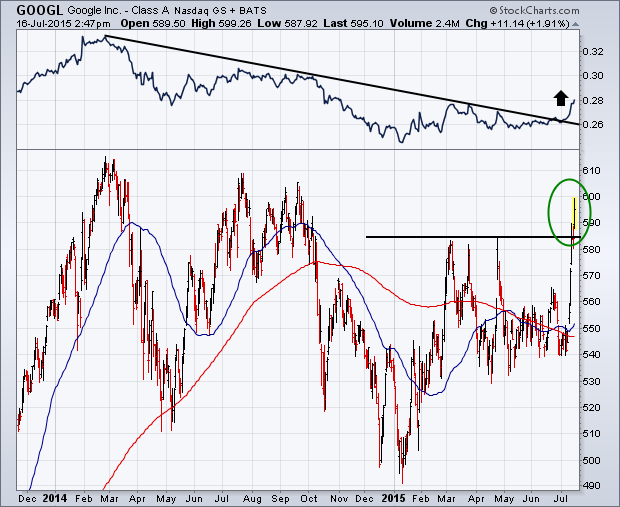
Google Leads the Internet Higher
by John Murphy,
Chief Technical Analyst, StockCharts.com
(Note: This article was originally published Thursday afternoon.)
The Internet group has been leading the technology sector higher this week. The standout performer in that group is Google. The chart below shows Google (GOOGL) surging through its spring high to the highest level since last October. Interesingly, the stock has...
READ MORE
MEMBERS ONLY
MARKET CONTINUES TO ADVANCE -- CITIGROUP BREAK OUT LEADS FINANCIAL SECTOR -- CELGENE, GILEAD, AND AMGEN LEAD BIOTECHS HIGHER -- GOOGLE BREAKOUT PACES INTERNET UPTURN -- TOBACCO STOCKS PUSH CONSUMER STAPLE SPDR TO NEW HIGH
by John Murphy,
Chief Technical Analyst, StockCharts.com
CITIGROUP PACES STRONG FINANCIAL GROUP... Financial stocks are having another good chart day. Chart 1 shows the Financials Sector SPDR (XLF) jumping to a new seven-year high today. Once again, banks are helping lead the way. Chart 2 shows the KBW Bank SPDR (KBE) nearing a new seven year high...
READ MORE
MEMBERS ONLY
DOLLAR STRENGTHENS AS EURO FALLS -- CANADIAN DOLLAR DROPS TO SIX-YEAR LOW -- COMMODITY PRICES WEAKEN ON RISING DOLLAR -- ENERGY AND METAL STOCKS WEAKEN -- GOLD AND SILVER STOCKS THREATEN MAJOR SUPPORT LEVELS -- BANK OF AMERICA AND USB PACE BANK RALLY
by John Murphy,
Chief Technical Analyst, StockCharts.com
DOLLAR RISES AGAINST THE EURO -- CANADIAN DOLLAR HITS SIX-YEAR LOW... Chart 1 shows the Power Shares Dollar Bullish Fund (UUP) nearing the highest close in a month, after having broken a three-month falling ressistance line. The longer-range trend of the greenback remains up as shown by the rising 200-day...
READ MORE
MEMBERS ONLY
FRIDAY'S BOUNCE KEEPS STOCK INDEXES ABOVE 200-DAY LINES, BUT ON LIGHT VOLUME -- GREEK STOCK ETF RALLIES ON HOPES FOR A COMPROMISE -- GERMAN AND FRENCH STOCKS ALSO BOUNCE OFF 200-DAY LINES -- AS DOES A VERY OVERSOLD SHANGHAI MARKET
by John Murphy,
Chief Technical Analyst, StockCharts.com
DOW AND S&P 500 HOLD 200-DAY LINES... After a wild week, stocks closed high enough on Friday to hold their 200-day averages. Chart 1 shows the Dow Industrials climbing 211 points on Friday to end above its 200-day line. Chart 2 shows the S&P 500 doing...
READ MORE
MEMBERS ONLY
THE FIVE WAVE ADVANCE IN THE NYSE COMPOSITE INDEX SINCE 2011 SUGGESTS THE COMPLETION OF THE THIRD WAVE IN A BULL MARKET -- THE MARKET APPEARS TO HAVE ENTERED A PERIOD OF CONSOLIDATION OR CORRECTION WITHIN ITS MAJOR UPTREND
by John Murphy,
Chief Technical Analyst, StockCharts.com
NYSE INDEX APPEARS TO HAVE COMPLETED A WAVE THREE... They say when you start to feel seasick you should focus on the horizon. Daily market swings are starting to make me feel seasick. So in line with that nautical theme, I'm going to focus on the market'...
READ MORE
MEMBERS ONLY
PLUNGE IN CHINESE SHARES CONTINUES -- EMERGING MARKETS NEAR TEST OF 2015 LOW -- CANADA STOCKS ARE FALLING ON WEAKER COMMODITIES -- ENERGY SHARES ARE THREATENING SPRING LOW -- RISING VIX RAISES RISK LEVEL FOR STOCKS
by John Murphy,
Chief Technical Analyst, StockCharts.com
CHINESE FREE FALL CONTINUES ... The free fall in Chinese stocks continued again today. Chinese stocks trading on the mainland and Hong Kong lost -6%. Chart 1 shows the phenomenal drop in China iShares (FXI). The FXI has fallen well below is 200-day moving average, and trendline support drawn under its...
READ MORE
MEMBERS ONLY
ADDENDUM TO TODAY'S MESSAGE: UPSIDE TURNAROUND KEEPS STOCK INDEXES ABOVE 200-DAY LINES
by John Murphy,
Chief Technical Analyst, StockCharts.com
DOW AND SPX REGAIN 200-DAY LINE... An afternoon rally has the look of a potential upside reversal day that has allowed the Dow and the S&P 500 to regain their 200-day lines. Chart 1 shows the Dow Industrials trading higher after hitting a five-month low earlier today. That...
READ MORE
MEMBERS ONLY
STEEP FOREIGN LOSSES PULL U.S. STOCKS LOWER -- COPPER STOCKS LEAD MATERIALS LOWER -- SEMIS PLUNGE BELOW 200-DAY AVERAGE AND THREATEN TO DO SAME FOR TECHNOLOGY SPDR -- DOW FALLS TO FIVE-MONTH LOW AS SPX FALLS BELOW 200-DAY LINE
by John Murphy,
Chief Technical Analyst, StockCharts.com
DOW JONES GLOBAL INDEX CONTINUES TO PLUNGE ... Foreign losses continue to deepen. European stocks are down another -1%, while Chinese stocks are losing more ground. EAFE ishares are down -2%, while Emerging Markets iShares (EEM) are falling -3%. [A stronger dollar is hurting foreign stocks ETFs even more because they&...
READ MORE
MEMBERS ONLY
GREEK NO VOTE PULLS GLOBAL MARKETS LOWER AGAIN -- FOREIGN SHARES LEAD US LOWER -- FALLING ENERGY SHARES LEAD TO PLUNGE IN CRUDE -- FALLING CHINESE STOCKS HURT COPPER AND AUSSIE DOLLAR --
by John Murphy,
Chief Technical Analyst, StockCharts.com
FOREIGN STOCK ETFS TUMBLE ... Today's plunge in global stocks is reminiscent of what happened last Monday. Except the global downturn in getting more serious. Although U.S. stocks are falling, foreign markets are falling a lot more. Chart 1 shows EAFE iShares (EFA) falling more than 2% to...
READ MORE
MEMBERS ONLY
IS LOW VOLATILITY GOOD?, A LOOK AT THE 2008 BREAK DOWN, 2008 MARKET MESSAGE, $SPX AND THE CURRENT BBAND STATUS, CURRENT SMALL-CAP SIGNAL IS BULLISH, KEY SUPPORT FOR QQQ, CONTRACTIONS FOR HOUSING, SEMICONDUCTOR AND RETAIL SPDRS
by John Murphy,
Chief Technical Analyst, StockCharts.com
IS LOW VOLATILITY A GOOD THING?... Link for today's video. I am going to step back and look at some weekly charts using Bollinger Bands and the BandWidth indicator. As many of us are aware, volatility has declined over the last six months and trading ranges are quite...
READ MORE
MEMBERS ONLY
STOCKS BOUNCE ON HOPE FOR GREEK COMPROMISE -- LONGER RANGE INDICATORS, HOWEVER, SHOW NEGATIVE DIVERGENCES AND SUGGEST DETERIORATION BENEATH THE SURFACE -- DOW WEEKLY AND MONTHLY MACD LINES ARE NEGATIVE -- LESS THAN HALF OF NYSE STOCKS ARE IN UPTRENDS
by John Murphy,
Chief Technical Analyst, StockCharts.com
DOW JONES COMPOSITE AVERAGE HITS NEW LOW... I don't know about you, but I'm tired of hearing about Greece. It makes day-to-day market analysis a lot more difficult. Monday's global stock plunge followed reports of a Greek default. Stocks are now bouncing on reports...
READ MORE
MEMBERS ONLY
WEBINAR DETAILS, AUTO ETF CORRECTS, ITB MAINTAINS UPTREND, LEISURE AND ENTERTAINMENT ETF TRENDS LOWER, RETAIL ETFS TAKE HITS, SMALL-CAPS REMAIN BULLISH OVERALL, TECH AND INDUSTRIALS REDDEN, INDICATOR AND SIGNAL OVERVIEW, BREADTH CHART LINKS
by John Murphy,
Chief Technical Analyst, StockCharts.com
WEBINAR DETAILS... The charts and commentary below are from the Webinar on Tuesday, June 30th, at 1PM ET. In this Webinar, I looked at the key industry groups within the consumer discretionary sector because these hold the key to the most economically sensitive sector. I analyzed some key breadth indicators...
READ MORE
MEMBERS ONLY
GLOBAL STOCKS TUMBLE ON GREEK CRISIS -- EUROPE AND ASIA LEAD FOREIGN MARKETS LOWER -- TECHNICAL DAMAGE IS DONE TO U.S. MARKET -- DOW INDUSTRIALS FALL BELOW 200-DAY AVERAGE -- S&P 500 FALLS TO THREE-MONTH LOW
by John Murphy,
Chief Technical Analyst, StockCharts.com
FOREIGN SHARES TUMBLE... Global stocks tumbled today. Chart 1 shows EAFE iShares (EFA) falling 3% to the lowest level in nearly three months, and in very heavy trading. European stocks lost 4% on average, with Germany falling 3.5%. Asian stocks tumbled as well, including Japan (-2.8%) and China...
READ MORE
MEMBERS ONLY
SPY FALLS TO FIRST TEST, SEASONALITY CHARTS AND SUMMER, BONDS COULD BENEFIT FROM DOLDRUMS, JULY TOUGH FOR SMALL-CAPS, LT TREND SYSTEM REMAINS BULLISH, REFINERS CONSOLIDATE WITHIN UPTRENDS
by John Murphy,
Chief Technical Analyst, StockCharts.com
SPY FALLS TOWARDS FIRST TEST... Link for today's video. The major index ETFs are down across the board with the Nasdaq 100 Equal-Weight ETF (QQEW) getting hit the most. Small-caps and large-caps are also down with the Russell 2000 iShares (IWM) and S&P 500 SPDR (SPY)...
READ MORE
MEMBERS ONLY
HOMEBUILDERS HAVE A STRONG WEEK -- LENNAR GAPS HIGHER -- BEAZER HOMES AND KB HOME ALSO HAVE A STRONG WEEK -- RISING BOND YIELDS CONTINUE TO HELP BANKS AND INSURERS WHILE HURTING UTILITIES AND REITS
by John Murphy,
Chief Technical Analyst, StockCharts.com
HOMEBUILDERS HAVE A STRONG WEEK... The daily bars in Chart 1 show the Dow Jones U.S. Home Construction iShares (ITB) ending the week at the highest level in two months. Interestingly, that came in the face of rising bond yields. Earlier in the year, rising bond yields appeared to...
READ MORE
MEMBERS ONLY
MICRO-CAPS LEAD MIXED MARKET, SMALL-CAP ETF AND QQQ HIT NEW HIGHS, EW S&P 500 CONTINUES TO LAG, TREND SORTING WITH THE PPO (DEMO), FOUR KEY SECTOR ETFS ARE STILL TRENDING UP, INDUSTRIALS BREAK DOWN, OIL WEIGHT ON ENERGY
by John Murphy,
Chief Technical Analyst, StockCharts.com
MICRO-CAPS LEAD MIXED MARKET ... Link for today's video. The stock market is not clicking on all cylinders right now, but the majority of cylinders are still in uptrends, even after some selling pressure this month. Today I will look at some key uptrends and show what it would...
READ MORE
MEMBERS ONLY
TRANSPORTS AND UTILITIES STILL IN DOWNTRENDS AND MAY BE PREVENTING UPSIDE BREAKOUT IN THE DOW -- DOW JONES COMPOSITE AVERAGE STILL IN A DOWNTREND AS WELL -- THAT'S A CAUTION SIGN FOR THE DOW
by John Murphy,
Chief Technical Analyst, StockCharts.com
TRANSPORTS AND UTILITIES ARE 2015 LAGGARDS... Chart 1 shows the divergence by the Dow Industrials (which are close to a new record) and the Dow Transports and Utilities which are both in downtrends. Since the start of the year, the industrials have gained 1.6%, while the transports and utilities...
READ MORE
MEMBERS ONLY
SMALL-CAP, MID-CAP AND NASDAQ ETFS LEAD, GROWTH CONTINUES TO LEAD VALUE, CONSUMER DISCRETIONARY ETFS BREAK OUT, HOUSING AND RETAIL LEAD CONSUMER DISCRETIONARY, WEBINAR EXCLUSIVES
by John Murphy,
Chief Technical Analyst, StockCharts.com
SMALL-CAPS, MID-CAPS AND NASDAQ SHOW LEADERSHIP... Note that the charts below are part of the webinar, which was at 1PM on Tuesday, June 23rd (Click here for recording). It is hard to argue against the bulls with the Russell 2000 iShares (IWM), S&P MidCap SPDR (MDY) and Nasdaq...
READ MORE
MEMBERS ONLY
UNIQUE SECTOR BREADTH INDICATORS, LONG-TERM VERSUS MEDIUM-TERM, SECTOR TRENDS, FINANCE AND HEALTHCARE TOP RANKS, ENERGY AND UTILITIES SEE RED, INDUSTRIALS SECTOR RANKS THIRD
by John Murphy,
Chief Technical Analyst, StockCharts.com
SLICING AND DICING THE SECTORS WITH UNIQUE INDICATORS... Link for today's video.. As promised, I am showing a breadth and trend table for the nine sectors today. Using the unique indicators available at StockCharts, chartists can slice and dice a sector by analyzing sector-specific breadth indicators, the cap-weighted...
READ MORE
MEMBERS ONLY
IWM AND XLI FOLLOW UP, BULK OF THE EVIDENCE, SMALL-CAP BULLISHNESS, FINDING SHORT-TERM PULLBACKS, CRUDE FLAGS, XES RELATIVE WEAKNESS, AEROSPACE & DEFENSE ETF BREAKS AND MORE
by John Murphy,
Chief Technical Analyst, StockCharts.com
IWM AND XLI STRATEGY FOLLOW UP... Link for today's video.. Today I am going to step back and focus a little on strategy. The first part will show a basic chart strategy to identify the bigger trend and find pullbacks within this chart. The second part will show...
READ MORE