MEMBERS ONLY
AN INFLECTION POINT FOR TREASURIES (AND MAYBE STOCKS) -- GOLD TRACES OUT A BIG CONTINUATION PATTERN -- SILVER WALLOWS NEAR SUPPORT ZONE -- GOLD AND SILVER MINING ETFS BOUNCE NEAR KEY RETRACEMENTS -- SHANGHAI COMPOSITE EXTENDS SERIES OF LOWER HIGHS
by John Murphy,
Chief Technical Analyst, StockCharts.com
AN INFLECTION POINT FOR TREASURIES (AND MAYBE STOCKS)... Link for today's video. This week could mark an inflection point for Treasury bonds because the Fed makes its policy statement on Wednesday and the economic docket is overflowing with reports. The fundamentals alone do not make for the inflection...
READ MORE
MEMBERS ONLY
NASDAQ LEADS THE MARKET LOWER -- BIOTECH AND INTERNET STOCKS NEAR TEST OF 200-DAY AVERAGES -- MARKET VECTORS SEMICONDUCTOR ETF PLUNGES 3% ON FRIDAY TO LEAD TECH DECLINE -- SECTOR ALIGNMENT REMAINS DEFENSIVE
by John Murphy,
Chief Technical Analyst, StockCharts.com
NASDAQ RALLY ATTEMPT MAY BE FAILING... The Nasdaq lost -1.75% on Friday to lead the market lower once again. The relative strength line (top of Chart 1) shows the Nasdaq/S&P 500 ratio peaking at the start of March and falling to the lowest level in eight...
READ MORE
MEMBERS ONLY
LOWER HIGHS EXTEND FOR IWM AND QQQ -- HOW IS THE S&P 500 EVEN UP THIS YEAR? -- CHARTING THE RELATIVE BULLISH PERCENT INDEX -- RELATIVE BPI'S FOR UTILITIES AND STAPLES REMAIN STRONG -- RELATIVE BPI'S BREAK DOWN IN TECH AND CONSUMER DISCRETIONARY
by John Murphy,
Chief Technical Analyst, StockCharts.com
LOWER HIGHS EXTEND FOR IWM AND QQQ... Link for today's video. Selling pressure hit small-caps and techs hard in early trading on Friday. With further weakness over the last few days, the Russell 2000 ETF (IWM) and Nasdaq 100 ETF (QQQ) are poised to extend their string of...
READ MORE
MEMBERS ONLY
$SPX AND $INDU TEST RESISTANCE AGAIN -- $COMPQ CREATES A GARDEN HOSE PATTERN -- $NIKK AND $TNX CONTINUE TO TRACK -- CONSUMER STAPLES ETF MAKES NEW 52 WEEK HIGHS -- AAPL GRAPPLES WITH CASH MOUNTAIN, SPLITS SHARES -- FB CONTINUES MOBILE AD REVENUE GROWTH
by John Murphy,
Chief Technical Analyst, StockCharts.com
$SPX AND $INDU TEST RESISTANCE AGAIN... The $SPX shown in the 60 minute view on Chart 1 pushed above 1884 this week and settled back on Wednesday. This morning the market surged higher on the back of great numbers from AAPL and FB. This is an extremely important place on...
READ MORE
MEMBERS ONLY
FALLING BOND YIELDS ARE BOOSTING REITS, BUT HAVEN'T HELPED HOMEBUILDERS -- FALLING PRICE OF LUMBER SUGGESTS WANING DEMAND FOR NEW HOMES AND MAY EXPLAIN HOMEBUILDER WEAKNESS
by John Murphy,
Chief Technical Analyst, StockCharts.com
REITS BENEFIT FROM FALLING BOND YIELDS... Previous messages have shown falling bond yields benefiting dividend-paying stocks like utilities. REITS fall under the same category, and are getting the same lift from falling bond yields. The brown bars in Chart 1 show the MSCI US REIT Index ($RMX) trading it the...
READ MORE
MEMBERS ONLY
DOW INDUSTRIALS TRACES OUT BULLISH CONTINUATION PATTERN -- TRANSPORTS CONFIRM NEW HIGH IN INDUSTRIALS -- FEDEX AND UPS POWER THE TRANSPORTS -- EXPEDITORS BOUNCES OFF VOLUME-BY-PRICE ZONE -- HOME CONSTRUCTION ISHARES HITS SUPPORT AGAIN
by John Murphy,
Chief Technical Analyst, StockCharts.com
DOW INDUSTRIALS TRACES OUT BULLISH CONTINUATION PATTERN... Link for today's video. The Dow Industrials has been quite choppy over the last seven weeks, but the overall pattern looks like a cup-with-handle. Popularized by William O'Neil of Investors Business Daily, the cup-with-handle is a bullish continuation pattern,...
READ MORE
MEMBERS ONLY
QQQ AND IWM BOUNCE OFF SUPPORT ZONES -- REGIONAL BANK SPDR HITS A REVERSAL ZONE -- RETAIL SPDR FIRMS AT KEY RETRACEMENT -- HIGH-LOW PERCENT TRIGGERS A BULLISH SIGNAL -- 10-YR TREASURY YIELD SURGES OFF SUPPORT
by John Murphy,
Chief Technical Analyst, StockCharts.com
QQQ AND IWM BOUNCE OFF SUPPORT ZONES... Link for today's video. The Nasdaq 100 ETF (QQQ) and Russell 2000 ETF (IWM) started underperforming the S&P 500 SPDR (SPY) in March and led the market lower over the last three-to-four weeks. While relative weakness in large tech...
READ MORE
MEMBERS ONLY
DOW BACK TO RESISTANCE -- OPTIONS EXPIRATION BEHAVIOUR -- STOCKS CONTINUED THE DEFENSIVE POSTURE UNTIL TODAY -- ENERGY ENERGY ENERGY ENERGY -- $NATGAS SOARS ON INVENTORY DATA -- $WTIC TESTS RECENT HIGHS -- $BRENT BREAKS ABOVE A DOWN SLOPING TREND LINE
by John Murphy,
Chief Technical Analyst, StockCharts.com
DOW BACK TO RESISTANCE... The Dow continued to move higher but stalled at resistance. This is our first test of resistance since the bounce. We have seen the $INDU become the strongest index which is not abnormal during a correction. We would like to see the $INDU break out to...
READ MORE
MEMBERS ONLY
NASDAQ BOUNCES OFF 200-DAY AVERAGE AND HELPS STABILIZE MARKET -- SO DO SMALL CAPS AND CONSUMER DISCRETIONARY STOCKS -- UTILITY LEADERSHIP IS A CAUTION SIGN -- SO ARE UPSIDE BREAKOUTS IN CONSUMER STAPLES AND ENERGY SHARES
by John Murphy,
Chief Technical Analyst, StockCharts.com
NASDAQ BOUNCES OFF SUPPORT LEVELS... My last message suggested that the direction of the Nasdaq market held the key to overall market direction. That's because it led the spring selloff and was the first to test important support levels. So far those supports have held. Chart 1 shows...
READ MORE
MEMBERS ONLY
NASDAQ BOUNCES SOLIDLY AT 200 DMA -- SOME DRILLERS ROCK, OTHER DRILLERS SINK -- GOLD HOLDS 1300 -- COPPER GAPS DOWN OUT OF CONSOLIDATION -- TWITTER FINALLY MAKES A REVERSAL CANDLE
by John Murphy,
Chief Technical Analyst, StockCharts.com
NASDAQ BOUNCES SOLIDLY AT 200 DMA ... We need to spend some time here on the Nasdaq. The Nasdaq Composite bounced off the 200 DMA. After falling almost 10% exactly, the bounce off the lows was a full 2.3% reversal. For many reasons, this is a strong place to expect...
READ MORE
MEMBERS ONLY
MARKETS BUILD A SMALL BASE -- COAL STARTS TO LEAD AS $NATGAS RISES -- ARCH COAL STARTS TO HEAD HIGHER -- BEBE STORES BUCKS THE CYCLICAL SECTOR TREND -- EDWARDS LIFE SCIENCES CREATES A GAP BREAKOUT
by John Murphy,
Chief Technical Analyst, StockCharts.com
MARKETS BUILD A SMALL BASE... As I prepared my notes for today's message at 3 PM, the Nasdaq had fallen back into the red and the Dow had lost 120 points from the high. By the time the market closed, the $INDU closed near the highs. That is...
READ MORE
MEMBERS ONLY
NOTES FROM TOP ANALYSTS, TRADERS, PORTFOLIO MANAGERS AND STRATEGISTS -- DEALING WITH OUR BIASES -- FORECASTING VERSUS REACTING -- PECKING ORDER FOR FIVE KEY ECONOMIC INDICATORS
by John Murphy,
Chief Technical Analyst, StockCharts.com
MTA TIDBITS... Today's Market Message will provide tidbits from the Market Technicians Association's annual symposium, which was held in NYC on April 3rd and 4th. The Symposium focused on the fusion of technical analysis with fundamental valuation, behavioral finance, macroeconomics and quantitative methods. It was truly...
READ MORE
MEMBERS ONLY
NASDAQ AND SMALL CAPS LEAD MARKET INTO BEARISH WEEK -- DOW AND S&P 500 TURN DOWN IN HEAVY TRADING -- SECTOR ROTATION REMAINS DEFENSIVE -- CONSUMER CYCLICALS AND FINANCIALS SHOW RELATIVE WEAKNESS
by John Murphy,
Chief Technical Analyst, StockCharts.com
NASDAQ LEADS WEEKLY LOSSES -- DOW HOLDS UP BEST... The relative performance of U.S. stock indexes reflects the bearish tone of the past week's action. Chart 1 shows the two biggest losers since March 1 being the Nasdaq Composite Index (-6.4%) and the Russell 2000 Small...
READ MORE
MEMBERS ONLY
PRICE AND VOLUME ACTION PUSH STOCK MARKET DEEPER INTO CORRECTION -- DOW AND S&P 500 BREAK 50-DAY AVERAGES -- NASDAQ BEARS DOWN ON 200-DAY LINE AND MAY DETERMINE DEPTH OF DOWNTURN -- WEEKLY NASDAQ INDICATORS AREN'T ENCOURAGING
by John Murphy,
Chief Technical Analyst, StockCharts.com
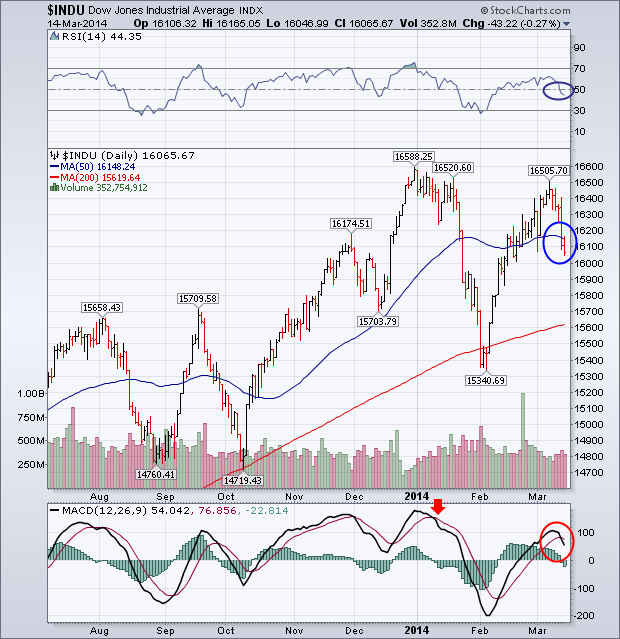
DOW AND S&P 500 FALL BELOW 50-DAY LINES... [Note: Although this message was posted earlier this afternoon, charts have been udpated to reflect closing prices]. The week's combination of falling prices in heavy trading is a bad combination. With small caps and the Nasdaq turning down...
READ MORE
MEMBERS ONLY
SPECIAL SITUATION -- $COMPQ CONFIRMS TREND LINE BREAK -- THE $SPX CLOSES ON THE LOWER BOLLINGER BAND -- $USB 30 YEAR TREASURY IS BACK ABOVE 200 DMA
by John Murphy,
Chief Technical Analyst, StockCharts.com
$COMPQ CONFIRMS TREND LINE BREAK... The $COMPQ has broken the long trend line off the Dec 2012 low. After yesterdays strong push up, it backtested the trend line from the underside. From there it pushed straight down. A 3% down day is very uncommon over the last few years so...
READ MORE
MEMBERS ONLY
UTILITIES AND CONSUMER STAPLES START THE MORNING -- BANKS DON'T BOUNCE -- PRECIOUS METALS TRY TO MOVE HIGHER -- $WTIC TAKES OFF FROM THE 200 DMA PLATFORM
by John Murphy,
Chief Technical Analyst, StockCharts.com
UTILITIES AND CONSUMER STAPLES START THE MORNING... After a big up day like yesterday, we would like to see follow through in the growth sectors. Unfortunately, Thursday started off with more upside for utilities and consumer staples. Chart 1 from the sector summary page shows the leaders in green.
While...
READ MORE
MEMBERS ONLY
INVESTORS ARE ROTATING FROM GROWTH TO VALUE -- MONEY IS LEAVING SOCIAL MEDIA, CONSUMER DISCRETIONARY, AND BIOTECHS INTO BANKS, ENERGY, STAPLES, TELECOM, AND TECH DIVIDEND-PAYERS
by John Murphy,
Chief Technical Analyst, StockCharts.com
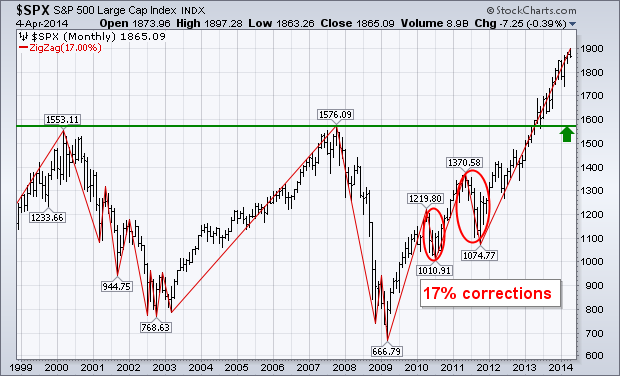
HOW TO DEAL WITH AN OVERBOUGHT MARKET... The stock market rally that started in March 2009 recently passed its fifth anniversary. That makes this a mature bull move in need of a period of consolidation or correction. The market is also in its most overbought region since 2007. Chart 1...
READ MORE
MEMBERS ONLY
A DRILL DOWN OF FINANCIALS -- THE LARGE BANK AND REGIONAL BANK ETFS LOOK STRONG -- JPM & WFC LOOK HIGHER AS BAC BREAKS A BIG TREND LINE -- CITI COMPLETES A ROUNDED TOP -- VISUAL CLUES FROM GOLDMAN SACHS AND MORGAN STANLEY
by John Murphy,
Chief Technical Analyst, StockCharts.com
A DRILL DOWN OF FINANCIALS... The financials are a critical component of the market. Ned Davis uses the phrase that financials will show the trouble before other sectors. So we have now had a 3% correction on the $SPX and it seems to have found support at the very important...
READ MORE
MEMBERS ONLY
STOCKS SUFFER ANOTHER BAD CHART DAY -- WEAK RETAILERS WEIGH HEAVILY ON CONSUMER DISCRETIONARY SECTOR -- MONEY FLOWS INTO CONSUMER STAPLES -- DEFENSIVE ROTATONS, AND WEAK CHART ACTION, RAISE RISKS FOR A SPRING TOP
by John Murphy,
Chief Technical Analyst, StockCharts.com
ANOTHER DOWN DAY IN HEAVIER TRADING ... The Nasdaq market continues to lead the rest of the market lower. Chart 1 shows the Power Shares QQQ Trust falling to another two-month low after falling below its 50-day line on Friday. Relative weakness by the Nasdaq (and small caps) is usually bad...
READ MORE
MEMBERS ONLY
$INDU MAKES A DOUBLE TOP (SO FAR) -- COMPARING THE 2000 AND 2007 TOPS -- THE $COMPQ AND $SPX ARE WELL ABOVE THE 200 DMA -- $LUMBER GETS STUCK BELOW 40 WMA -- BUILDING AND CONSTRUCTION TEST THE UPTREND -- $BRENT DIPPED BELOW THE SUPPORT LINE LAST WEEK
by John Murphy,
Chief Technical Analyst, StockCharts.com
$INDU MAKES A DOUBLE TOP (SO FAR)... The Dow has made a double top so far as seen on Chart 1. Does this seem important? Here we sit with a potential $INDU double top and only 3 days from the high. Google, the big market leader is down almost 14%...
READ MORE
MEMBERS ONLY
NOTES FROM TOP ANALYSTS, TRADERS, PORTFOLIO MANAGERS AND STRATEGISTS -- CHINA AND NUCLEAR ENERGY -- RELATIVE PERFORMANCE OF INDUSTRIALS -- MONETARY CONDITIONS MATTER
by John Murphy,
Chief Technical Analyst, StockCharts.com
NOTES FROM TOP ANALYSTS, TRADERS, PORTFOLIO MANAGERS AND STRATEGISTS... I am on vacation the next two weeks, but would like to share my notes from the recent MTA symposium. Today's Market Message will provide tidbits from the Market Technicians Association's annual symposium, which was held in...
READ MORE
MEMBERS ONLY
Watching for a Spring Top
by John Murphy,
Chief Technical Analyst, StockCharts.com
Last December 14 I wrote a message warning of the likelihood of a market correction during 2014. Midterm election years are the most dangerous of the four-year presidential cycle. ["The Four Year Presidential Cycle Suggests That 2014 Could Suffer a Major Downside Correction...The Strongest Six Month Period Ends...
READ MORE
MEMBERS ONLY
NASDAQ AND SMALL CAP INDEXES FALL BELOW 50-DAY AVERAGES ON BIG VOLUME -- SECTOR ROTATIONS TURN DEFENSIVE -- DOW AND S&P 500 SUFFER DOWNSIDE REVERSAL DAYS -- VOLUME PATTERNS ARE NEGATIVE -- WEEKLY MACD LINES REMAIN NEGATIVE FOR S&P
by John Murphy,
Chief Technical Analyst, StockCharts.com
NASDAQ AND SMALL CAPS LEAD MARKET LOWER... Stocks suffered a bad chart day on Friday. Stock indexes lost more than 1% in heavy trading. Small cap stocks and the Nasdaq market lost more than 2%. Chart 1 shows the Nasdaq Composite Index losing -2.6% on the day in very...
READ MORE
MEMBERS ONLY
10-YR TREASURY YIELD FAILS AT RESISTANCE -- 7-10 YR T-BOND ETF SURGES OFF WEDGE TREND LINE -- SMALL-CAPS AND TECHS LEAD MARKET LOWER -- RSP AND SPY STILL HOLDING UP -- BREATH INDICATORS SHOW NO DIVERGENCE
by John Murphy,
Chief Technical Analyst, StockCharts.com
10-YR TREASURY YIELD FAILS AT RESISTANCE... Programming Note: Chip, Greg, John and I are at the MTA Symposium on Thursday and Friday. Today's Market Message will not include a video because I am on the road. Also note that I will be taking a family vacation from April...
READ MORE
MEMBERS ONLY
$INDU, $SPX AND $TRAN MAKE NEW HIGHS TOGETHER -- TRUCKING INDEX MAKES HIGHER LOWS AND HIGHER HIGHS -- $SPX STOCKS ABOVE 200 DMA AND STOCKS ABOVE 50 DMA STILL HEALTHY -- $SPX IS NOW IN THE SECOND LONGEST RALLY IN 30 YEARS
by John Murphy,
Chief Technical Analyst, StockCharts.com
$INDU $SPX AND $TRAN MAKE NEW HIGHS TOGETHER... The $SPX made a new two day thrust higher this week. The $INDU shown in Chart 1 has made a new high today above the December 31st high. This new high confirms the breakout on the $SPX in Chart 2.
(click to...
READ MORE
MEMBERS ONLY
CONSUMER DISCRETIONARY SPDR LEADS MARKET HIGHER -- RETAIL SPDR CHALLENGES SUPPORT BREAK -- NUTRISYSTEM AND BEST BUY EXTEND CONSOLIDATIONS -- HOME CONSTRUCTION ISHARES SURGES OFF SUPPORT ZONE -- INTERNET ETF BOUNCES OFF SUPPORT
by John Murphy,
Chief Technical Analyst, StockCharts.com
CONSUMER DISCRETIONARY SPDR LEADS MARKET HIGHER... Link for today's video. The Consumer Discretionary SPDR (XLY) weighed on the stock market with a sharp decline in March, but the ETF found support at a key retracement and bounced over the last three days. Chart 1 shows XLY with a...
READ MORE
MEMBERS ONLY
DOW INDUSTRIALS AND TRANSPORTS CHALLENGE RESISTANCE -- MMM, TRV, CNW AND KSU GO FOR BREAKOUTS -- GLOBAL AUTO ETF SURGES TO NEW HIGH -- FIAT HITS NEW HIGH, FORD CONSOLIDATES AND GM TESTS SUPPORT -- FINANCE ETF FORMS FLAG AS BANKING SPDR BOUNCES OFF SUPPORT
by John Murphy,
Chief Technical Analyst, StockCharts.com
DOW INDUSTRIALS AND TRANSPORTS CHALLENGE RESISTANCE ... Link for today's video. With a surge the last two days, the Dow Industrials and Dow Transports are challenging consolidation resistance and poised for breakouts. Chart 1 shows the Dow surging above 16000 in February and then moving into a consolidation pattern....
READ MORE
MEMBERS ONLY
ENERGY SECTOR SHOWS NEW MARKET LEADERSHIP -- ENERGY SPDR HITS NEW RECORD -- OIL SERVICE STOCKS ALSO SEE BIG GAINS -- HALLIBURTON AND SCHLUMBERGER ACHIEVE MAJOR BULLISH BREAKOUTS -- CRUDE OIL MAY BE FORMING BULLISH TRIANGLE
by John Murphy,
Chief Technical Analyst, StockCharts.com
ENERGY IS WEEK'S STRONGEST SECTOR... Energy stocks had a very good week. In fact, they were the strongest part of the stock market. Chart 1 shows the Energy Sector SPDR (XLE) breaking out to a new record. Even more impressive is the big jump in the XLE/SPX...
READ MORE
MEMBERS ONLY
RSP AND SPY BOUNCE OFF CONSOLIDATION SUPPORT -- QQQ AND IWM BREAK 50-DAY LINES -- XLI, XLK AND XLF HOLD UP THE MARKET -- RUSSELL 2000 AND NASDAQ SERIOUSLY UNDERPERFORM -- TREASURIES START OUTPERFORMING STOCKS
by John Murphy,
Chief Technical Analyst, StockCharts.com
RSP AND SPY BOUNCE OFF CONSOLIDATION SUPPORT... Link for today's video. Even though selling pressure hit small-caps and momentum names over the last few weeks, the S&P 500 SPDR (SPY) and the Equal-Weight S&P 500 ETF (RSP) held up quite well and did not...
READ MORE
MEMBERS ONLY
A LOOK AT THE QQQ 5 YEAR RALLY -- QQQ BOUNCES OFF TREND LINE SUPPORT -- GOOG LOSES $100 IN 6 TRADING DAYS -- S&P SECTOR PERF CHARTS SHIFT TO DEFENSIVE SECTORS -- TOBACCO INDUSTRY IS #1 CONSUMER STAPLES INDUSTRY GROUP
by John Murphy,
Chief Technical Analyst, StockCharts.com
QQQ � A LOOK AT THE 5 YEAR RALLY ... QQQ has recently touched the top of the channel trend line as shown in Chart 1. We have been rubbing it for 4 months now. We have not visited the lower channel line since the 2011 October lows. I want to show...
READ MORE
MEMBERS ONLY
EAFE AND EEM ISHARES EARLY BOUNCE FADES -- EMERGING MARKET BONDS AND CURRENCIES ARE BOUNCING -- THE EURO RALLY HAS RUN INTO A MAJOR RESISTANCE LINE -- A STRONGER EURO HAS BOOSTED THE RELATIVE PERFORMANCE OF EUROZONE STOCKS OVER LAST TWO YEARS
by John Murphy,
Chief Technical Analyst, StockCharts.com
FOREIGN STOCK ETFS EARLY GAINS FADE... Foreign stock markets turned in a stronger performance earlier today, but their gains faded by day's end. Chart 1 shows EAFE iShares (which measures developed markets) trading above its 50-day moving average for most of the day. An afternoon fade, however, erased...
READ MORE
MEMBERS ONLY
WATCHING THE 10-YR YIELD FOR CLUES ON STOCKS -- TLT BOUNCES OFF GOLDEN CROSS (AGAIN) -- MINING AND RELATED STOCKS HOLD STRONG -- AA CHALLENGES RESISTANCE AS BHP BOUNCES -- APPAREL RETAILERS INDEX BREAKS SHORT-TERM SUPPORT
by John Murphy,
Chief Technical Analyst, StockCharts.com
WATCHING THE 10-YR YIELD FOR CLUES ON STOCKS... Programming note: We are having some technical issues and cannot produce a video at the moment. The 10-YR Treasury Yield ($TNX) continues to muddle along and trade above the October low. Chartists should watch Treasury yields because they are positively correlated with...
READ MORE
MEMBERS ONLY
BEARISH DIVERGENCE EXTENDS IN $NDX BREADTH INDICATOR -- AMAZON, FACEBOOK AND GOOGLE, WEIGH ON THE NASDAQ -- MOMENTUM AND INTERNET STOCKS GET HAMMERED -- APPLE BUCKS THE TREND WITH RESISTANCE CHALLENGE -- XLY LAGS AND TESTS SUPPORT AS XRT FALLS
by John Murphy,
Chief Technical Analyst, StockCharts.com
BEARISH DIVERGENCE EXTENDS IN $NDX BREADTH INDICATOR... After forming two big outside days the prior two weeks, the Nasdaq 100 ETF (QQQ) is falling on Monday and breaking its first support level. Chart 1 shows QQQ opening strong and closing weak on March 13th and 21st (red arrows). Basically, these...
READ MORE
MEMBERS ONLY
GILEAD AND BIOGEN LEAD BIOTECH SELLOFF WHICH PULLS NASDAQ LOWER -- MARKET SUFFERS DOWNSIDE REVERSAL DAY ON FRIDAY -- BIG JUMP IN 2-YEAR YIELD MAY HAVE ALSO UNSETTLED MARKET -- DOLLAR BOUNCE MAY CAP GOLD RALLY
by John Murphy,
Chief Technical Analyst, StockCharts.com
BIOTECHS TUMBLE ON FRIDAY... Biotech stocks, which have been market leaders for months, took a big hit on Friday. The catalyst for the heavy selling was a letter by a group of House Democrats asking Gilead Sciences to justify the high price of its hepatitis drug. That query caused the...
READ MORE
MEMBERS ONLY
THE FAB FIVE HOLD THEIR BREAKOUTS -- BULLISH HIGHLIGHTS OUTWEIGH CONCERNS -- THREE KEY INDUSTRY-GROUP ETFS CONSOLIDATE IN MARCH -- FINANCE SPDR AND BANK ETF SURGE TO NEW HIGHS -- AN INDEX DOES NOT ALWAYS TELL THE WHOLE STORY
by John Murphy,
Chief Technical Analyst, StockCharts.com
THE FAB FIVE HOLD THEIR BREAKOUTS... Link for today's video. It was a wild trading week as stocks dipped sharply on Wednesday and recovered with an equally sharp advance on Thursday. The Fed, of course, got the blame for this week's volatility. Despite the dip and...
READ MORE
MEMBERS ONLY
$USD SNAPS OUT OF A DOWNTREND -- THE CURRENCY PITS WERE YELLING YESTERDAY -- $XEU THE EURO HEADS LOWER AFTER A FAILED BREAKOUT -- $COPPER PRINTS A BULLISH OUTSIDE DAY -- $GOLD PULLS BACK LOOKING FOR SUPPORT -- THE BONDS WERE QUIET THROUGH THE FED MEETING
by John Murphy,
Chief Technical Analyst, StockCharts.com
$USD SNAPS OUT OF A DOWNTREND ... The $USD started falling the week after the last Fed meeting. Chart 1 shows a 2 hour chart of the UUP which gives us intraday data for the $USD. The six-week downtrend was relatively smooth and consistent. Two weeks ago, the dollar dropped below...
READ MORE
MEMBERS ONLY
SPY SUCCESSFULLY TESTS FIRST SUPPORT LEVEL -- XLI AND XLY BOUNCE OFF EARLY MARCH LOWS -- XLK LEADS MARKET HIGHER -- MSFT LEADS TECHS HIGHER -- INTEL EXTENDS CONSOLIDATION -- BIOTECH ISHARES BOUNCES OFF SUPPORT ZONE
by John Murphy,
Chief Technical Analyst, StockCharts.com
SPY SUCCESSFULLY TESTS FIRST SUPPORT LEVEL... Link for today's video. The S&P 500 SPDR (SPY) fell sharply last week, but firmed on Friday and bounced off support this week. Chart 1 shows SPY breaking out to a new high with a gap in early March. This...
READ MORE
MEMBERS ONLY
U.S. Stocks Have a Bad Week
by John Murphy,
Chief Technical Analyst, StockCharts.com
My Wednesday message warned that the Dow Industrials could run into profit-taking near its January highs, and that weekly indicators for the S&P 500 were giving "negative divergences" which also warned of a market pullback. Combined with increased tensions in the Ukraine and increased concerns about...
READ MORE
MEMBERS ONLY
FOREIGN STOCKS LEAD US MARKET LOWER -- SHORT-TERM MARKET CHARTS SHOW DETERIORATION -- UKRAINE TENSIONS WEIGH ON GERMANY -- CHINA WEAKNESS AND RISING YEN WEIGH ON JAPAN -- FALLING BOND YIELDS ALSO HINT AT STOCK WEAKNESS
by John Murphy,
Chief Technical Analyst, StockCharts.com
U.S. STOCKS HAVE A BAD WEEK ... My Wednesday message warned that the Dow Industrials could run into profit-taking near its January highs, and that weekly indicators for the S&P 500 were giving "negative divergences" which also warned of a market pullback. Combined with increased tensions...
READ MORE
MEMBERS ONLY
SPY FILLS THE GAP AND TESTS FIRST SUPPORT -- XLY, XLI AND XLK TEST FIRST SUPPORT LEVELS -- XRT IS STILL AN UNDERPERFORMER -- ITB NEARS IMPORTANT SUPPORT ZONE -- XME FORMS CUP-WITH-HANDLE PATTERN -- TLT AND IEF SURGE OFF KEY MOVING AVERAGES
by John Murphy,
Chief Technical Analyst, StockCharts.com
SPY FILLS THE GAP AND TESTS FIRST SUPPORT... Link for today's video. Stocks fell back this week and finally alleviated some of the short-term oversold conditions that built up in early March. The bulk of the evidence remains bullish for stocks, but the list of concerns grew this...
READ MORE