MEMBERS ONLY
FALLING DOLLAR GIVES BOOST TO EUROPEAN SHARES -- EUROPEAN STOCK INDEXES BREAK THROUGH RESISTANCE BARRIERS -- GERMANY ISHARES ARE CHALLENGING 2011 HIGH -- BOUNCING YEN HURTS JAPANESE STOCKS -- EUROPE LOOKS LIKE BEST BET FOR FOREIGN STOCK DIVERSIFICATION
by John Murphy,
Chief Technical Analyst, StockCharts.com
DOLLAR THREATENS SUPPORT ZONE... The U.S. Dollar has been falling since the start of July, when it failed a test of its May peak. It's now nearing a test of an important support level. Chart 1 shows the PowerShares US Dollar Index (UUP) threateningn its July intra-day...
READ MORE
MEMBERS ONLY
OBV HITS NEW HIGH FOR SPY AND QQQ -- SEMIS AND RETAILERS LEAD PULLBACK -- HOME CONSTRUCTION ISHARES TESTS NECKLINE -- THE HEAD-AND-SHOULDERS PATTERN THAT WASN'T -- BRIC SPDR MAINTAINS POSITIVE CORRELATION WITH THE CRB INDEX
by John Murphy,
Chief Technical Analyst, StockCharts.com
OBV HITS NEW HIGH FOR SPY AND QQQ... Link for today's video. The S&P 500 ETF (SPY) broke above its May highs in July and these highs are turning into the first support zone. Chart 1 shows this support zone in the 167.5 area. Since...
READ MORE
MEMBERS ONLY
A SECULAR BULL WITH NO SIGNS OF DISTRIBUTION -- XRT AND XLY REACH CHANNEL TREND LINES -- REITS SHOW RELATIVE WEAKNESS -- HOME CONSTRUCTION ISHARES EXTENDS ITS STALL -- UTILITIES SPDR STALLS NEAR KEY RETRACEMENT
by John Murphy,
Chief Technical Analyst, StockCharts.com
A SECULAR BULL WITH NO SIGNS OF DISTRIBUTION... Link for today's video. From a purely technical standpoint, it is pretty safe to assume that all time highs occur in secular up trends. With an all time high in April, the S&P 500 joined the Russell 2000,...
READ MORE
MEMBERS ONLY
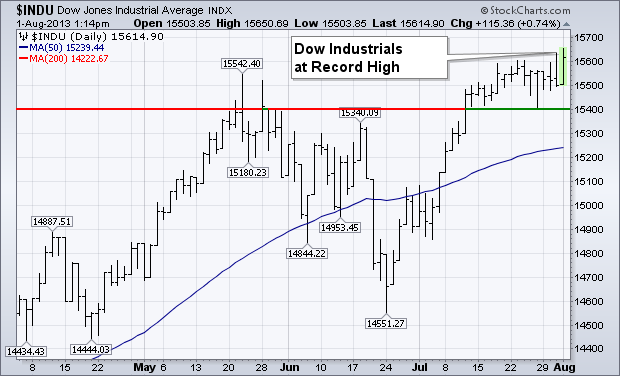
Dow Transports Confirm New Record in the Industrials
by John Murphy,
Chief Technical Analyst, StockCharts.com
The Dow Industrials and Transports are hitting new record highs together once again. That's a sign of an ongoing bull market. [Dow Theory holds that an upside breakout in either one needs to be confirmed by a similar breakout in the other]. Chart 1 shows the Dow Industrials...
READ MORE
MEMBERS ONLY
MARKING FIRST SUPPORT FOR THE S&P 500 -- CONSUMER DISCRETIONARY AND INDUSTRIALS SECTORS HIT NEW HIGHS -- KEY BREADTH INDICATORS CONFIRM INDICES -- NET NEW HIGHS EXPAND AGAIN -- SMALL-CAPS CONTINUE TO SHOW RELATIVE STRENGTH
by John Murphy,
Chief Technical Analyst, StockCharts.com
MARKING FIRST SUPPORT FOR THE S&P 500... Link for today's video. The Labor Department reported that the economy added 162,000 non-farm payrolls in July. This number was below expectations and marked the smallest increase in four months. Stocks futures quickly erased their gains and Treasury...
READ MORE
MEMBERS ONLY
DOW TRANSPORTS SURGE TO RECORD HIGH TODAY -- TRUCKING LEADER CON-WAY HITS NEW THREE-YEAR HIGH -- TRANPORTATION ISHARES ARE A GOOD WAY TO PLAY TRANSPORTATION RALLY -- BOND YIELD JUMPS ON STRONG ECONOMIC NEWS -- STOCKS HIT NEW RECORDS
by John Murphy,
Chief Technical Analyst, StockCharts.com
DOW TRANSPORTS CONFIRM NEW RECORD IN THE INDUSTRIALS... The Dow Industrials and Transports are hitting new record highs together once again. That's a sign of an ongoing bull market. [Dow Theory holds that an upside breakout in either one needs to be confirmed by a similar breakout in...
READ MORE
MEMBERS ONLY
TREASURIES BOUNCE AFTER FED STATEMENT -- QQQ GRABS THE LEAD WITH A NEW HIGH -- RETAILERS LEAD CONSUMER DISCRETIONARY SPDR WITH BREAKOUT -- HOME CONSTRUCTION ISHARES SURGES OFF NECKLINE SUPPORT -- GOLD STALLS AT BROKEN SUPPORT
by John Murphy,
Chief Technical Analyst, StockCharts.com
TREASURIES BOUNCE AFTER DISINFLATIONARY TONE IN FED STATEMENT... Link for today's video. The Fed did not change its quantitative easing stance, but did make some minor changes to its statement. In particular, the Fed noted that growth has moved from moderate to modest. The Fed also noted that...
READ MORE
MEMBERS ONLY
RISING DOLLAR BENEFITS US STOCKS MORE THAN FOREIGN STOCKS -- EMERGING MARKETS ARE ESPECIALLY VULNERABLE TO STRONGER DOLLAR BECAUSE OF FALLING COMMODITY PRICES -- FIRMER DOLLAR HELPS SMALL CAPS MORE THAN LARGE CAPS -- BOUNCING YEN HURTS JAPANESE STOCKS
by John Murphy,
Chief Technical Analyst, StockCharts.com
RISING DOLLAR BENEFITS US STOCKS... The direction of the U.S. dollar has an important impact on global money flows. For one thing, the direction of the dollar impacts the direction of commodity prices, and countries tied to natural resources (more on that later). For another, dollar direction helps determine...
READ MORE
MEMBERS ONLY
TREASURY YIELDS CONSOLIDATE AHEAD OF BIG ECONOMIC WEEK -- STOCKS OUTPERFORM TREASURIES -- SPY CONSOLIDATES ABOVE BREAKOUT -- THE NOOSE TIGHTENS FOR THE RETAIL SPDR -- SHANGHAI COMPOSITE AND SENSEX INDEX TURN LOWER
by John Murphy,
Chief Technical Analyst, StockCharts.com
TREASURY YIELDS CONSOLIDATE AHEAD OF BIG ECONOMIC WEEK... Link for today's video. It is a HUGE week on the economic front. The fireworks start on Wednesday with Chicago PMI and the FOMC policy statement. We then get the ISM Index, Jobless Claims and Auto-Truck sales on Thursday. The...
READ MORE
MEMBERS ONLY
CONSUMER DISCRETIONARY AND TECHNOLOGY SECTORS TAKE A DIVERGENCE -- UTILITIES LEAD EQUAL-WEIGHT SECTORS -- FALLING FLAG OR NEAR TERM TOP FOR XLY? -- TECHNOLOGY SPDR HOLDS GAP TO AFFIRM RESISTANCE -- NAKED MACD TRENDS LOWER FOR COMMODITY INDEX FUND
by John Murphy,
Chief Technical Analyst, StockCharts.com
CONSUMER DISCRETIONARY AND TECHNOLOGY SECTORS TAKE A DIVERGENCE... Link for today's video. Investors shifted away from the consumer discretionary and technology sectors over the last two weeks. Even though this is a relatively short-term development, it comes with the market short-term overbought and ripe for a correction. Relative...
READ MORE
MEMBERS ONLY
BOEING HITS NEW HIGH ON RECORD BACKLOG -- XLI CLOSES IN ON CHANNEL TREND LINE -- CATERPILLAR LAGS INDUSTRIALS SECTOR AND MARKET -- METALS AND MINING SPDR HITS RESISTANCE WITH SHARP REVERSAL -- HOME CONSTRUCTION ISHARES MOVES INTO GAP ZONE
by John Murphy,
Chief Technical Analyst, StockCharts.com
BOEING HITS NEW HIGH ON RECORD BACKLOG... Link for today's video. Boeing (BA) is leading the industrials sector higher with a fresh 52-week high as investors reacted positively to today's earnings report. Of note, the company reported a record $410 billion order backlog and some $40...
READ MORE
MEMBERS ONLY
WEAKER DOLLAR HELPS GOLD MARKET TURN UP FROM OVERSOLD AREA -- THE LONGER-TERM TREND FOR GOLD, HOWEVER, IS STILL DOWN -- WEAKER DOLLAR IS ALSO HELPING EMERGING MARKET CURRENCIES AND STOCKS -- CANADIAN AND GERMAN ISHARES ARE TESTING OVERHEAD RESISTANCE
by John Murphy,
Chief Technical Analyst, StockCharts.com
DOLLAR PULLS BACK AS EURO AND YEN BOUNCE... The U.S. Dollar continues the downside correction that started in early July. The green bars in Chart 1 show the U.S. Dollar Index (UUP) trading at the lowest level in a month. The blue line line shows the Euro climbing...
READ MORE
MEMBERS ONLY
HEALTHCARE ETFS LEAD MARKET WITH NEW HIGHS -- ACTAVIS BREAKS TRIANGLE RESISTANCE AS BOSTON SCI BREAKS JUNE HIGH -- 10-YEAR TREASURY YIELD HITS SUPPORT AS TLT FORMS BEAR FLAG -- AEROSPACE-DEFENSE ETF SHRUGS OFF SEQUESTER WITH NEW HIGHS
by John Murphy,
Chief Technical Analyst, StockCharts.com
HEALTHCARE ETFS LEAD MARKET WITH NEW HIGHS... Link for today's video. After a correction in June, the healthcare ETFs resumed their longer term uptrends and recorded fresh 52-week highs this month. Chart 1 shows the Healthcare SPDR (XLV) moving from the lower left of the chart to the...
READ MORE
MEMBERS ONLY
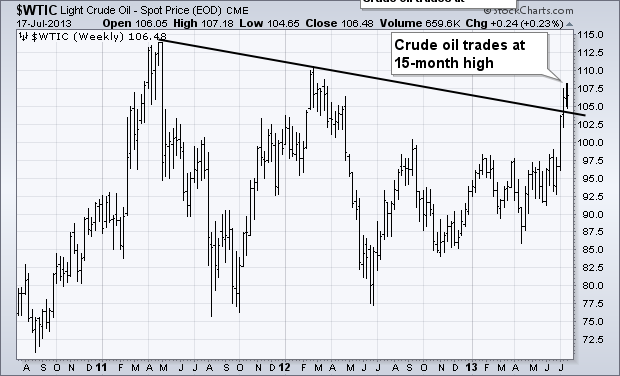
Crude Oil Reaches 15-Month High
by John Murphy,
Chief Technical Analyst, StockCharts.com
Chart 1 shows Light Crude Oil trading at the highest level in fifteen months. My July 5 message showed crude oil trading higher in an attempt to close the gap between it and higher priced brent crude. As of today, crude is only a dollar away from its European counterpart....
READ MORE
MEMBERS ONLY
A BEARISH FAILURE SWING COULD BE FORMING IN THE S&P 500 -- BIG TECHS WEIGH ON THE TECHNOLOGY SPDR -- GOLD SURGES TO RESISTANCE AND STALLS -- DOLLAR ABSORBS VOLATILITY TO MAINTAIN UPTREND -- A MACD SQUEEZE FOR THE EURO INDEX
by John Murphy,
Chief Technical Analyst, StockCharts.com
A BEARISH FAILURE SWING COULD BE FORMING IN THE S&P 500 ... Link for today's video. Chart 1 shows weekly bars for the S&P 500 with RSI in the indicator window. First, note that the overall trend is clearly up with a series of rising...
READ MORE
MEMBERS ONLY
CRUDE OIL REACHES HIGHEST LEVEL IN FIFTEEN MONTHS WHICH IS BOOSTING ENERGY SHARES -- OIL SERVICE ETF IS TESTING 2013 HIGH -- SCHLUMBERGER IS BREAKING THROUGH MAY RESISTANCE -- INTEGRATED OIL & GAS INDEX HITS RECORD HIGH
by John Murphy,
Chief Technical Analyst, StockCharts.com
CRUDE OIL REACHES 15-MONTH HIGH... Chart 1 shows Light Crude Oil trading at the highest level in fifteen months. My July 5 message showed crude oil trading higher in an attempt to close the gap between it and higher priced brent crude. As of today, crude is only a dollar...
READ MORE
MEMBERS ONLY
HOUSING STARTS AND BUILDING PERMITS PLUNGE -- HOME CONSTRUCTION ETF HOLD THE GAP TO WARD OFF BEARISH PATTERN -- KEY BREADTH INDICATORS SURGE TO NEW HIGHS -- HIGH-LOW LINE HAS BEEN RISING SINCE LATE NOVEMBER -- RUSSELL 2000 OUT PACES S&P 100 WITH NEW HIGH
by John Murphy,
Chief Technical Analyst, StockCharts.com
HOUSING STARTS AND BUILDING PERMITS PLUNGE... Link for today's video. The Commerce Department reported that June housing starts plunged almost 10% to 836,000 and building permits fell over 6% to 911,000. Chart 1 shows Housing Starts ($$HSNGSTARTS) sinking to their lowest level in over six months....
READ MORE
MEMBERS ONLY
IWM AND QQQ LEAD, BUT BECOME SHORT-TERM OVERBOUGHT -- CONSUMER DISCRETIONARY AND FINANCE SECTORS OUTPERFORM -- SETTING FIRST SUPPORTS FOR XLF AND XLY -- IBM TESTS SUPPORT AHEAD OF EARNINGS REPORT -- INTEL BREAKS WEDGE RESISTANCE WITH GAP
by John Murphy,
Chief Technical Analyst, StockCharts.com
IWM AND QQQ LEAD, BUT BECOME SHORT-TERM OVERBOUGHT ... Link for today's video. Stocks went on a tear the last three weeks with the Russell 2000 ETF (IWM) and the Nasdaq 100 ETF (QQQ) leading the major index ETFs. It is quite positive to see these two groups leading...
READ MORE
MEMBERS ONLY
GLOBAL STOCKS RALLY -- U.S. STOCK INDEXES NEAR OLD HIGH -- NASDAQ REACHES 13-YEAR HIGH -- BIG TECH LEADERS INCLUDE CISCO, KLAC, AND MICROSOFT -- DOLLAR DROP MAY GIVE BOUNCE TO OVERSOLD GOLD MARKET
by John Murphy,
Chief Technical Analyst, StockCharts.com
EAFE ISHARES CLEAR 50-DAY AVERAGE -- EMERGING MARKETS JUMP ... Yesterday's comments by Mr. Bernanke that the Fed was still in an easing mode gave a big lift to global stocks today, which has spilled over to the U.S. Chart 1, for example, shows EAFE iShares (EFA) trading...
READ MORE
MEMBERS ONLY
TRANSPORTS SURGE TO TWO-MONTH HIGH -- FEDEX AND UPS ARE LEADERS IN DELIVERY SERVICES -- TRUCKING STOCK CON-WAY HITS THREE-YEAR HIGH -- S&P 500 IS CHALLENGING MID-JUNE PEAK -- THE VIX BREAKS JUNE LOW WHICH SUPPORTS HIGHER STOCK PRICES
by John Murphy,
Chief Technical Analyst, StockCharts.com
DOW TRANSPORTS SURGES... According to Dow Theory, a necessary ingredient in a bull market is coincident gains in industrial and transportation stocks. And we appear to be getting just that. Chart 1 shows the Dow Industrials having cleared its 50-day average and nearing a test of its mid-June intra-day high...
READ MORE
MEMBERS ONLY
OIL SERVICE ETF BENEFITS FROM RISING OIL PRICE -- LEADERS INCLUDE BHI, NOV, AND RDC -- FRANCE AND GERMANY LEAD FOREIGN STOCK REBOUND -- RETAILERS LEAD CONSUMER DISCRETIONARY SPDR TO NEW HIGHS -- AMAZON.COM BREAKS OUT
by John Murphy,
Chief Technical Analyst, StockCharts.com
OIL SERVICE STOCKS RALLY ... Oil service stocks are finally showing some bounce. The main reason for that was last week's upside breakout in crude oil to the highest level in fourteen months. The weekly bars in Chart 1 show the Market Vectors Oil Services (OIH) moving up toward...
READ MORE
MEMBERS ONLY
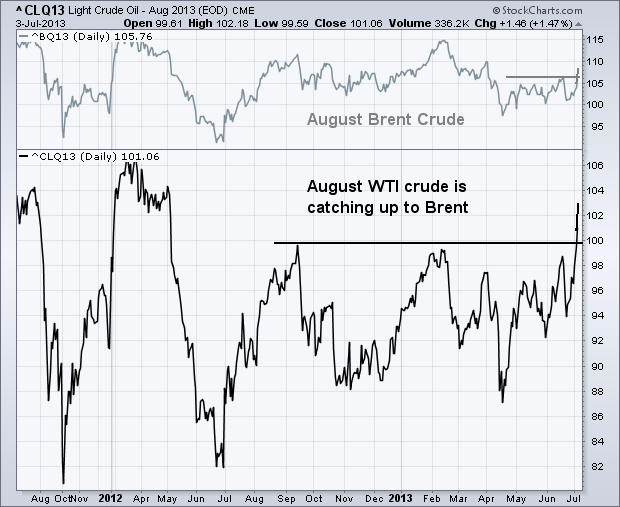
WTI CRUDE IS CATCHING UP TO BRENT
by John Murphy,
Chief Technical Analyst, StockCharts.com
The price of West Texas Intermediate Crude oil (the U.S. benchmark) has exploded over the last week. The lower line in the chart below shows the August light crude oil contract having broken out to the highest level in 14 months. Today's rise puts August crude at...
READ MORE
MEMBERS ONLY
SMALL CAP INDEX HITS NEW HIGH -- S&P 500 CLEARS 50-DAY AVERAGE -- EUROPEAN DECISION TO LEAVE RATES UNCHANGED CAUSES POUND AND EURO TO TUMBLE AND PUSHES DOLLAR SHARPLY HIGHER -- WTI CRUDE HITS 14-MONTH HIGH AND IS CATCHING UP TO BRENT
by John Murphy,
Chief Technical Analyst, StockCharts.com
S&P 500 CLEARS 50-DAY LINE... Tuesday's message showed small caps leading large cap stocks higher. That's still the case. Chart 1 shows the S&P 600 Small Cap Index ($SML) having cleared a resistance line drawn over its May/June highs and, more...
READ MORE
MEMBERS ONLY
JAPAN ETF CLEARS 50-DAY AVERAGE -- SMALL CAPS LEAD U.S. MARKET HIGHER -- SO DO CONSUMER DISCRETIONARY AND FINANCIAL STOCKS -- WEAKER STOCK INDEXES ARE BOUNCING OFF 200-DAY LINES -- RECENT UPSIDE BREAKOUT IN VIX INDEX IS NOW IN DOUBT
by John Murphy,
Chief Technical Analyst, StockCharts.com
JAPAN ETF RISES ABOVE 50-DAY AVERAGE... A falling yen is helping to lift Japanese stocks. Chart 1 shows the Japanese yen falling back below its 50-day average. A falling yen is bullish for Japanese stocks. Right on cue, Chart 2 shows the Wisdom Tree Japan Hedged Fund (DXJ) climbing above...
READ MORE
MEMBERS ONLY
RISING DOLLAR HURTS COMMODITIES -- FALLING YEN BOOSTS JAPANESE STOCKS -- 50-DAY AVERAGE BLOCKS LOW VOLUME STOCK BOUNCE --BOND YIELDS REACH TWO-YEAR HIGH, BUT ARE STILL VERY LOW
by John Murphy,
Chief Technical Analyst, StockCharts.com
RISING COMMODITIES KEEPS DOWNSIDE PRESSURE ON COMMODITIES... The U.S. Dollar Index has rebounded sharply over the last two weeks (see circle in Chart 1). Global turmoil has pulled money out of foreign currencies (especially emerging markets) and into the relative safety of the U.S. dollar. That's...
READ MORE
MEMBERS ONLY
USING BREADTH THRUSTS TO IDENTIFY REVERSALS -- BREADTH MOMENTUM REMAINS BEARISH FOR SPX AND NDX -- SURGE IN 10-YEAR YIELD OUTPACES RISE IN 2-YEAR -- YIELD CURVE STEEPENS TO 2011 LEVELS -- NOT ALL STOCKS ARE WEAK AS ONE ETF BREAKS TO A 52-WEEK HIGH
by John Murphy,
Chief Technical Analyst, StockCharts.com
USING BREADTH THRUSTS TO IDENTIFY REVERSALS ... Link for today's video. Programming note: I will be on vacation from June 28 to July 12 (Friday to Friday). This is the all important two-week family vacation. My contributions to Art's Charts and the Market Message will resume on...
READ MORE
MEMBERS ONLY
DIRECTIONAL MOVEMENT INDICATORS TRIGGER NEW SIGNAL FOR SPY -- QQQ PLUNGES INTO SUPPORT ZONE -- CHINESE STOCKS GET HAMMERED AS SHORT-TERM RATES SURGE -- EUROPEAN TOP 100 INDEX TURNS RED YEAR-TO-DATE
by John Murphy,
Chief Technical Analyst, StockCharts.com
DIRECTIONAL MOVEMENT INDICATORS TRIGGER NEW SIGNAL FOR SPY... Link for today's video. According to the Directional Movement Indicators and the Vortex Indicator, the S&P 500 ETF (SPY) was in an uptrend from mid December until last week. After falling 2% last week and over 4% the...
READ MORE
MEMBERS ONLY
S&P 500 TRIGGERS A MACD SELL SIGNAL, SETTING A CORRECTION TARGET FOR THE DOW, BREADTH LINES FAIL TO CONFIRM FOR KEY SECTORS, REGIONAL BANK ETFS SHOW RELATIVE STRENGTH, RETAIL SPDR TESTS KEY TREND LINE AFTER GAP
by John Murphy,
Chief Technical Analyst, StockCharts.com
S&P 500 TRIGGERS A MACD SELL SIGNAL ... Link for today's video. Remember "sell in May and go away"? This phrase is based on the six month cycle in the stock market. According to the Stock Trader's Almanac, the period from May to...
READ MORE
MEMBERS ONLY
STOCKS EXPERIENCE BIG SELLOFF ON FED PLAN TO SLOW BOND BUYING -- SO DO FOREIGN MARKETS -- EMERGING MARKET CURRENCIES LEAD STOCKS LOWER -- RISING RATES CAUSE GOLD TO PLUNGE -- S&P 500 BREAKS BREAKS JUNE SUPPORT AS VIX TURNS UP
by John Murphy,
Chief Technical Analyst, StockCharts.com
GOLD PLUNGES ... Two factors are causing the price of gold to tumble today. One is a sharp jump in the U.S. Dollar. The other, and probably more important reason, is the jump in U.S. bond yields after yesterday's Fed announcement that it was ready to start...
READ MORE
MEMBERS ONLY
TREASURY BOND ETF HITS MOMENT-OF-TRUTH -- ARE 10-YEAR TREASURY YIELDS SIMPLY RETURNING TO NORMALCY? -- RELATIONSHIP BETWEEN YIELDS AND STOCKS SOURS -- S&P 500 EQUAL-WEIGHT ETF STALLS AT CHANNEL TREND LINE
by John Murphy,
Chief Technical Analyst, StockCharts.com
TREASURY BOND ETF HITS MOMENT-OF-TRUTH ... Link for today's video. In an effort to distance myself one Fed meeting and reactionary analysis, today's commentary will come before the Fed meeting and focus on price action. Trying to second-guess a Fed moment and the market's immediate...
READ MORE
MEMBERS ONLY
SEMICONDUCTOR LEADERS INCLUDE APPLIED MATERIALS, MICRON TECHNOLOGY, AND SANDISK -- FOREIGN STOCKS STABILIZE AS JAPAN REBOUNDS -- EMERGING MARKETS ARE OVERSOLD -- U.S. STOCK INDEXES EXTEND RALLY WHILE VIX STAYS BELOW CHART RESISTANCE
by John Murphy,
Chief Technical Analyst, StockCharts.com
MORE SEMICONDUCTOR LEADERS ... My June 4 message showed the Market Vectors Semiconductor ETF (SMH) trading at a new 12-year high, and three semiconductor leaders which included Intel (INTC), KLA Tencor (KLAC) , and Texas Instruments (TXN). That group continues to lead the technology sector higher. Three more semiconductor leaders are shown...
READ MORE
MEMBERS ONLY
STOCKS FRONT RUN THE FED AS IWM CHALLENGES FLAG TREND LINE -- OIL BREAKS TRIANGLE CONSOLIDATION -- XLE FINDS SUPPORT NEAR BROKEN RESISTANCE -- NATURAL GAS SURGES OFF KEY RETRACEMENT ZONE -- S&P 1500 BREADTH INDICATORS EXTEND CORRECTION
by John Murphy,
Chief Technical Analyst, StockCharts.com
STOCKS FRONT RUN THE FED AS IWM CHALLENGES FLAG TREND LINE... Link for today's video. Stocks got off to a strong start on Monday with the major index ETFs surging over 1% in early trading. Note that the Fed meets on Wednesday and will make its policy statement...
READ MORE
MEMBERS ONLY
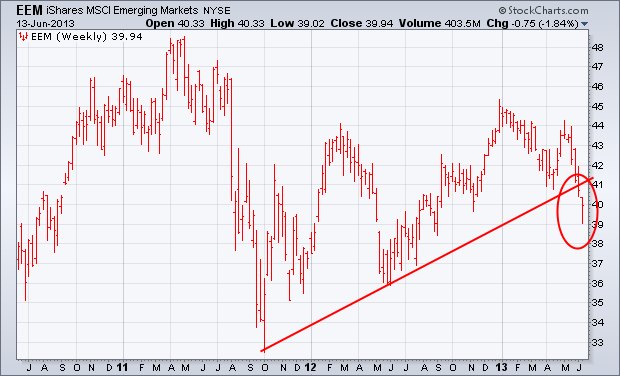
Emerging Market iShares Plunge
by John Murphy,
Chief Technical Analyst, StockCharts.com
The biggest threat to the global stock rally is coming from emerging markets. The weekly bars in the chart below show Emerging Market iShares (EEM) falling to the lowest level in nine months. It has also broken a support line extending back to the fourth quarter of 2011. Emerging market...
READ MORE
MEMBERS ONLY
TREASURIES BOUNCE AS IEF CONFIRMS OUTSIDE REVERSAL -- UTILITIES AND REIT ETFS HIT KEY RETRACEMENT ZONE -- FALLING FLAGS TAKE SHAPE IN FOUR OF NINE SECTOR SPDRS -- USING SECTOR BREADTH TO AUGMENT ANALYSIS -- AD LINES TREND LOWER FOR OFFENSIVE SECTORS
by John Murphy,
Chief Technical Analyst, StockCharts.com
TREASURIES BOUNCE AS IEF CONFIRMS OUTSIDE REVERSAL... Link for today's video. Treasury bonds are bouncing and yields are rising on Friday. This is interesting because Treasuries appeared to break down on Monday, but recovered and rebounded with a strong bounce the last two days. Chart 1 shows the...
READ MORE
MEMBERS ONLY
RISING YEN PUNISHES JAPANESE STOCKS -- WISDOM TREE JAPAN ETF, HOWEVER, IS NEAR MAJOR SUPPORT ZONE -- EMERGING MARKET ISHARES CONTINUE TO WEAKEN -- FOREIGN STOCK INDEX BACKS OFF FROM CHART RESISTANCE -- DOLLAR WEAKENS AS EURO RALLIES
by John Murphy,
Chief Technical Analyst, StockCharts.com
JAPANESE STOCKS PLUNGE AS YEN BOUNCES ... Between last November and mid-May, a plunging yen pushed Japanese stocks 80% higher. Over the last three weeks, however, the short yen/ long Nikkei trade has reversed. Chart 1 shows the upturn in the Japanese yen in mid-May coinciding exactly with a peak in...
READ MORE
MEMBERS ONLY
S&P 500 OUTPERFORMS ITS PEERS IN ASIA AND EUROPE -- QQQ AND SPY REMAIN WITH FALLING FLAGS -- SHANGHAI COMPOSITE FAILS TO HOLD BREAKOUT -- HANG SENG INDEX AND ALL ORDS BREAK APRIL LOWS -- JAPANESE BONDS GO BERSERK AS YEN TURNS UP
by John Murphy,
Chief Technical Analyst, StockCharts.com
S&P 500 OUTPERFORMS ITS PEERS IN ASIA AND EUROPE ... Link for today's video. There is a lot of talk lately that the US is not an island and weakness in emerging markets will eventually weigh on US stocks. US stocks, for the moment, are holding up...
READ MORE
MEMBERS ONLY
RETAIL SPDR BREAKS FLAG TREND LINE WITH GAP -- CONSUMER DISCRETIONARY SECTOR HAS STRONGEST CORRELATION -- XLY STALLS AT CHANNEL TREND LINE -- NETWORKING ISHARES SHOWS RELATIVE STRENGTH -- PAYROLL TREND SUPPORTS LONG-TERM UPTREND IN STOCKS
by John Murphy,
Chief Technical Analyst, StockCharts.com
RETAIL SPDR BREAKS FLAG TREND LINE WITH GAP... Link for today's video. It is a big week for retail stocks because retail sales for May will be reported on Thursday. The Retail SPDR (XRT) best represents the retail group and retailers are important to the consumer discretionary sector....
READ MORE
MEMBERS ONLY
STOCKS REMAIN STRONG, BUT SPY IS STILL RIPE FOR A CORRECTION -- S&P 1500 BREADTH NEARS SHORT-TERM OVERSOLD TERRITORY -- TREASURY ETF FIRMS AT SUPPORT AS 10-YEAR YIELD HITS RESISTANCE -- CONSOLIDATION ENDS AS GOLD CONTINUES IN DIRECTION OF BIGGER TREND
by John Murphy,
Chief Technical Analyst, StockCharts.com
STOCKS REMAIN STRONG, BUT STILL RIPE FOR A CORRECTION... Link for today's video. Tapering or no tapering, the S&P 500 ETF (SPY) remains in a long-term uptrend and shows no serious signs of selling pressure. The ETF dipped to the 160 area during the week and...
READ MORE
MEMBERS ONLY
U.S. STOCKS ARE THE STRONGEST IN THE WORLD -- EMERGING MARKETS ARE WORLD'S WEAKEST -- % OF NYSE ABOVE 50- AND 200-DAY AVERAGES IS DROPPING -- TODAY'S SHARP REBOUND IN FOREIGN CURRENCIES STEADIES FOREIGN MARKETS -- S&P 500 BOUNCES OFF 50-DAY MOVING AVERAGE
by John Murphy,
Chief Technical Analyst, StockCharts.com
U.S. STOCKS ARE THE STRONGEST IN THE WORLD... U.S. stocks remain the strongest in the world. The two charts below use relative strength analysis to demonstrate that. Chart 1 plots a relative strength ratio of the S&P 500 divided by EAFE iShares (EFA) over the last...
READ MORE
MEMBERS ONLY
SELLING PRESSURE CONTINUES AS STOCKS EXTEND CORRECTION -- DOW TRANSPORTS START TO LAG THE MARKET -- TREASURIES BOUNCE AS MONEY ROTATES INTO RELATIVE SAFETY -- METALS & MINING SPDR CONFIRMS BEARISH CONTINUATION PATTERN
by John Murphy,
Chief Technical Analyst, StockCharts.com
SELLING PRESSURE CONTINUES AS STOCKS EXTEND CORRECTION... Link for today's video. The stock market remained in corrected mode with weakness across the board. The major index ETFs were all lower, all nine sectors declined and almost all industry group ETFs were down. Chart 1 shows the S&...
READ MORE