MEMBERS ONLY
TECHNOLOGY SPDR CONSOLIDATING WITHIN UPTREND -- MICROSOFT HAS ACHIEVED MAJOR BULLISH BREAKOUT -- INTEL IS ALSO SURGING -- THE MARKET VECTORS SEMICONDUCTOR ETF HAS REACHED HIGHEST LEVEL IN MORE THAN A DECADE -- SO HAVE KLA-TENCOR AND TEXAS INSTRUMENTS
by John Murphy,
Chief Technical Analyst, StockCharts.com
TECHNOLOGY SPDR FORMS BULLISH PENNANT AT CHART SUPPORT... One group that has benefited from May rotations out of defensive stock groups into more economically-sensitive groups is technology. As a result, technology is transitioning from a previous market laggard to an emerging market leader. I've written about this before....
READ MORE
MEMBERS ONLY
MEASURING THE SECTOR SHIFT WITH PERFCHARTS -- BOND MARKET CONFIRMS CHANGE IN INTEREST RATE OUTLOOK -- XLY CORRECTS WITH A POTENTIAL BULLISH CONTINUATION PATTERN -- XLK HOLDS UP BETTER, BUT BREAKS PENNANT SUPPORT
by John Murphy,
Chief Technical Analyst, StockCharts.com
MEASURING THE SECTOR SHIFT WITH PERFCHARTS... Link for today's video. May brought about a big change in the equity market as leadership moved from the defensive sectors to the offensive sectors. We can define this shift by comparing PerfCharts for two different timeframes. The Consumer Staples SPDR (XLP)...
READ MORE
MEMBERS ONLY
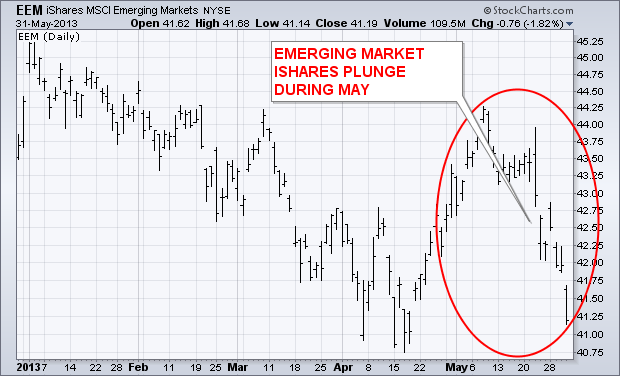
Emerging Market Stocks Fall Hard During May
by John Murphy,
Chief Technical Analyst, StockCharts.com
The main story of the past week has been the upside breakout in U.S. Treasury bond yields to the highest level in thirteen months, and the corresponding drop in bond prices. The jump in bond yields during the month of May contributed to heavy selling of dividend paying stocks...
READ MORE
MEMBERS ONLY
RISING U.S. TREASURY YIELDS UNDERCUT DEMAND FOR EMERGING MARKET STOCKS, BONDS, AND CURRENCIES -- LOCAL CURRENCY BONDS ARE HARDEST HIT BECAUSE OF WEAKER EMERGING CURRENCIES -- STRONGER DOLLAR FAVORS US OVER FOREIGN STOCKS
by John Murphy,
Chief Technical Analyst, StockCharts.com
EMERGING MARKET STOCKS FALL HARD DURING MAY... The main story of the past week has been the upside breakout in U.S. Treasury bond yields to the highest level in thirteen months, and the corresponding drop in bond prices. The jump in bond yields during the month of May contributed...
READ MORE
MEMBERS ONLY
SPY AND QQQ STALL WITHIN UPTRENDS -- YIELDS SURGE AND BONDS FALL ON ECONOMIC DATA -- CRUDE'S FALLING FLAG CONTINUES TO FALL -- ENERGY SPDR BACKS OFF CHANNEL TREND LINE
by John Murphy,
Chief Technical Analyst, StockCharts.com
SPY AND QQQ STALL WITHIN UPTRENDS... Link for today's video. There is no real change in the overall picture for stocks. The big trends are up for the major index ETFs and there are no signs of significant selling pressure, but the market is still quite extended and...
READ MORE
MEMBERS ONLY
BANKS ARE PLAYING CATCH-UP -- UPTURN IN HOUSING IS A BIG HELP -- SO IS THE RECENT UPTURN IN THE YIELD CURVE -- FALLING LUMBER MAY BE HINTING AT HOUSING PULLBACK -- AUTOS ARE BECOMING MARKET LEADERS -- IF INVESTORS AREN'T SELLING BONDS, WHO IS?
by John Murphy,
Chief Technical Analyst, StockCharts.com
BANKS BREAK OUT ... My Tuesday message mentioned a number of sector influences that deserve more explanation. I'll try to do that in this message. I've written recently about the impressive upturn in bank stocks, and some reasons for that upturn. Chart 1, for example, shows the...
READ MORE
MEMBERS ONLY
HOMEBUILDERS JOIN RATE SENSITIVE GROUPS WITH RETREAT -- EURO BOUNCES OFF NECKLINE SUPPORT -- DOLLAR WEAKENS, BUT HOLDS BREAKOUT -- GOLD FIRMS NEAR APRIL LOWS -- CORN CHALLENGES RESISTANCE -- SOYBEANS BREAKOUT WITH BIG MOVE
by John Murphy,
Chief Technical Analyst, StockCharts.com
HOMEBUILDERS JOIN RATE SENSITIVE GROUPS WITH RETREAT... Link for today's video. Stocks continue to price in a change in Fed policy by marking down interest rate sensitive shares. John Murphy and I commented on recent weakness in utilities and REITs. Treasuries are also falling sharply as Treasury yields...
READ MORE
MEMBERS ONLY
STRONG ECONOMIC NEWS PUSHES TEN-YEAR BOND YIELD TO ONE YEAR HIGH -- BOND PRICES TUMBLE AS STOCKS RISE -- AUTO STOCKS HAVE BECOME MARKET LEADERS -- UTILITIES AND REITS ARE HURT BY RISING RATES
by John Murphy,
Chief Technical Analyst, StockCharts.com
TEN-YEAR BOND YIELD JUMPS TO HIGHEST LEVEL IN A YEAR ... The backup in bond yields that started a month ago took a more serious turn today. Chart 1 shows the 10-Year Treasury Note Yield ($TNX) climbing above its March peak. That upside breakout puts the bond yield at the highest...
READ MORE
MEMBERS ONLY
S&P 500 REVERSES AT CHANNEL TREND LINE -- MAY IS ALMOST OVER, BUT SIX MONTH CYCLE IS STILL HERE -- RETAILERS LEAD CONSUMER DISCRETIONARY SECTOR LOWER -- INTEREST RATE SENSITIVE ETFS GET PUMMELED -- APPETITE FOR RISK WANES AS MID-CAPS START TO LAG
by John Murphy,
Chief Technical Analyst, StockCharts.com
S&P 500 REVERSES AT CHANNEL TREND LINE... Link for today's video. The S&P 500 is overbought by most metrics and remains ripe for a correction as the month of May draws to a close. Chart 1 shows the index surging to the upper trend...
READ MORE
MEMBERS ONLY
CHINA AND JAPAN LEAD GLOBAL RETREAT -- OVERBOUGHT S&P 500 SUFFERS DOWNSIDE REVERSAL DAY -- MAJOR TREND, HOWEVER, REMAINS HIGHER -- RISING BOND YIELD ALSO WORRIES STOCKS
by John Murphy,
Chief Technical Analyst, StockCharts.com
ASIAN STOCKS LEAD GLOBAL SELLOFF... The stock market downturn that started in the U.S. yesterday afternoon spread to Asia today. The Japanese stock market, which has led the world higher during 2013, fell 7% today. The weekly bars in Chart 1 show Japan iShares (EWJ) having the worst weekly...
READ MORE
MEMBERS ONLY
EURO TRUST FORMS BIG BEARISH PATTERN -- DOLLAR INDEX HOLDS FLAG BREAKOUT -- BRAZILIAN REAL FUND HITS KEY RETRACEMENT -- SPOT LIGHT CRUDE CHALLENGES MAJOR RESISTANCE ZONE -- CAREFUL WITH THAT DOUBLE BOTTOM SIGHTING IN GOLD
by John Murphy,
Chief Technical Analyst, StockCharts.com
EURO TRUST FORMS BEARISH REVERSAL PATTERN... Link for today's video. The Euro accounts for over 50% of the US Dollar Index ($USD) and the US Dollar Fund (UUP). This makes it the main Dollar driver to watch. Before looking at the bearish pattern, let's review the...
READ MORE
MEMBERS ONLY
RETAIL SALES SOFTEN, BUT SURPRISE -- RETAIL SPDR BECOMES OVERBOUGHT AND HITS CHANNEL TREND LINE -- INDUSTRIAL PRODUCTION REMAINS IN LONG-TERM UPTREND -- INDUSTRIALS SPDR SURGES 10% IN FOUR WEEKS -- JOBLESS CLAIMS JUMP TO SEVEN WEEK HIGH
by John Murphy,
Chief Technical Analyst, StockCharts.com
RETAIL SALES SOFTEN, BUT SURPRISE... Link for todays video. Last week we saw several key economic releases with mixed results. Retail sales beat expectations with a small gain. Industrial production came in weaker than expected with a larger decline. Jobless claims surged above 350 for the first time since early...
READ MORE
MEMBERS ONLY
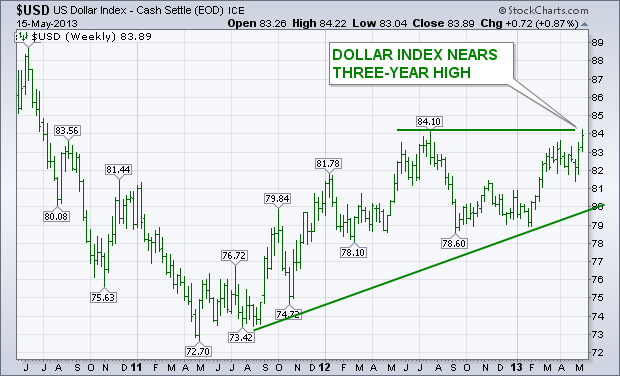
Dollar Index Nears Three-Year High, Plunging Yen Has Hurt Gold
by John Murphy,
Chief Technical Analyst, StockCharts.com
The chart below shows the U.S. Dollar Indexchallenging its mid-2012 high near 84. An upside breakout through that prior peak (which appears likely) would put the dollar at the highest level since mid-2010. The dollar has become the world's strongest currency. One of the reasons for the...
READ MORE
MEMBERS ONLY
RELATIVE STRENGTH IN OFFENSIVE SECTORS SUPPORTS UPTREND -- BREADTH INDICATORS CONFIRM NEW HIGHS IN S&P 1500 -- SPY HITS CHANNEL WITH FIFTH WAVE -- THREE SIMPLE MOMENTUM METRICS TO DEFINE THE TREND -- S&P 500 ETF ROCKS IN A RELATIVE WORLD
by John Murphy,
Chief Technical Analyst, StockCharts.com
RELATIVE STRENGTH IN OFFENSIVE SECTORS SUPPORTS UPTREND... Link for todays video. There were concerns a month ago when the defensive sectors were leading the market, but this changed as the offensive sectors took control over the past month. PerfChart 1 shows the percentage change for the nine sector SPDRs from...
READ MORE
MEMBERS ONLY
U.S. DOLLAR INDEX NEARS THREE-YEAR HIGH AND HAS BECOME WORLD'S STRONGEST CURRENCY -- EURO AND SWISS FRANC WEAKEN ON BAD ECONOMIC NEWS -- FALLING METAL PRICES WEIGH ON AUSTRALIAN DOLLAR -- SURGE IN DOLLAR/YEN REMAINS MAIN DEPRESSANT ON GOLD
by John Murphy,
Chief Technical Analyst, StockCharts.com
DOLLAR INDEX NEARS THREE-YEAR HIGH ... Chart 1 shows the U.S. Dollar Index challenging its mid-2012 high near 84. An upside breakout through that prior peak (which appears likely) would put the dollar at the highest level since mid-2010. The dollar has become the world's strongest currency. One...
READ MORE
MEMBERS ONLY
ANALYZING SECTOR BREADTH -- XLY REMAINS THE STRONGEST -- DIVERGENCES FORESHADOWED SURGE IN XLF -- XLK HITS CHANNEL TREND LINE -- BREADTH CONFIRMS NEW HIGH IN XLI -- XLP BREAKS PENNANT RESISTANCE -- XLU MOVES FROM RELATIVE STRENGTH TO RELATIVE WEAKNESS
by John Murphy,
Chief Technical Analyst, StockCharts.com
ANALYZING THE SECTOR BREADTH ... Link for today's video. Today's market message is going to dive deep into sector analysis. There are nine sector SPDRs and StockCharts.com offers four different breadth indicators to complement sector analysis. Breadth indicators are designed to measure the degree of participation....
READ MORE
MEMBERS ONLY
US DOLLAR INDEX IS POISED TO BREAKOUT AND CONTINUE UPTREND -- EURO FAILS AT KEY RETRACEMENT -- YEN NEARS LONG-TERM SUPPORT ZONE -- AUSSIE BREAKS SUPPORT WITH SHARP DECLINE -- SPOT LIGHT CRUDE SURGES TO RESISTANCE LINE
by John Murphy,
Chief Technical Analyst, StockCharts.com
US DOLLAR IS POISED TO BREAKOUT AND CONTINUE UPTREND... Link for todays video. With continuing Yen weakness and recent declines in the Euro, the US Dollar Index ($USD) surged and is poised to break flag resistance. Chart 1 shows the index with a large rising channel since April 2011. The...
READ MORE
MEMBERS ONLY
RISING PRICE CHANNEL SHOWS ROOM TO RUN FOR THE DOW -- MACD-HISTOGRAM EXTENDS POSITIVE STREAK FOR S&P 500 -- BREADTH CONFIRMS UNDERLYING STRENGTH IN BROADER MARKET -- SMALLER SPX STOCKS LAG, BUT EQUAL-WEIGH INDEX HITS NEW HIGH
by John Murphy,
Chief Technical Analyst, StockCharts.com
RISING PRICE CHANNEL SHOWS ROOM TO RUN FOR THE DOW... Link for todays video. Stocks have been on a tear since mid November and show now signs of reversing course. We can argue about overbought conditions, the employment participation rate and the Fed affect, but there is simply no debate...
READ MORE
MEMBERS ONLY
FINANCIAL SECTOR IS SHOWING MARKET LEADERSHIP, BUT STILL LOOKS RELATIVELY CHEAP -- BANK STOCKS HAVE BEEN FINANCIAL LAGGARDS -- INSURANCE STOCKS HAVE BEEN FINANCIAL LEADERS
by John Murphy,
Chief Technical Analyst, StockCharts.com
FINANCIAL SECTOR STILL LOOKS CHEAP... Fianancial stocks have been showing market leadership during May. That's usually a good sign for the rest of the stock market. Financial stocks have at least two things going for them. One is that they're in chart uptrends. The other is...
READ MORE
MEMBERS ONLY
USING THE BULLISH PERCENT INDICES TO FIND THE MOVERS -- ENERGY BPI MAKES A BIG MOVE ON THE PERFCHART -- CONSUMER DISCRETIONARY BPI IS BEST PERFORMER YEAR-TO-DATE -- FINANCE BPI HOVERS ABOVE 90% -- CONSUMER STAPLES BPI HITS ULTIMATE EXTREME
by John Murphy,
Chief Technical Analyst, StockCharts.com
USING THE BULLISH PERCENT INDICES TO FIND THE MOVERS... Link for todays video. Today I am going to look at the Bullish Percent Indices for the nine sector SPDRs and the S&P 500. First, I will give a little primer on these breadth indicators. Second, I will show...
READ MORE
MEMBERS ONLY
MOST NYSE STOCKS ARE BACK ABOVE 50-DAY AVERAGES -- NEW SECTOR LEADERS ARE IN GROWTH AREAS LIKE ENERGY, MATERIALS, INDUSTRIALS, AND TECHNOLOGY AS MONEY ROTATES OUT OF DEFENSIVE GROUPS
by John Murphy,
Chief Technical Analyst, StockCharts.com
MOST % NYSE STOCKS ARE BACK ABOVE THEIR 50-DAY AVERAGE... My market message written two weeks ago (Tuesday April 23) carried the headline that "Half of market is in a correction". I showed the % of NYSE stocks trading above their 50-day average falling below 50% during April. The situation...
READ MORE
MEMBERS ONLY
SHANGHAI COMPOSITE IGNORES NEWS AND BOUNCES OFF SUPPORT -- GERMAN AND FRENCH INDICES SURGE TO NEW HIGHS -- NON-FARM PAYROLLS EXTEND POSITIVE STREAK -- JOBLESS CLAIMS ARE TRENDING IN THE RIGHT DIRECTION -- ISM MANUFACTURING INDEX FLIRTS WITH 50
by John Murphy,
Chief Technical Analyst, StockCharts.com
SHANGHAI COMPOSITE IGNORES NEWS AND BOUNCES OFF SUPPORT... Link for todays video. Recent news out of China has been less than positive, but the market appears to be ignoring this negative news. Reports last week showed a slow down in the manufacturing sector and todays release of the PMI showed...
READ MORE
MEMBERS ONLY
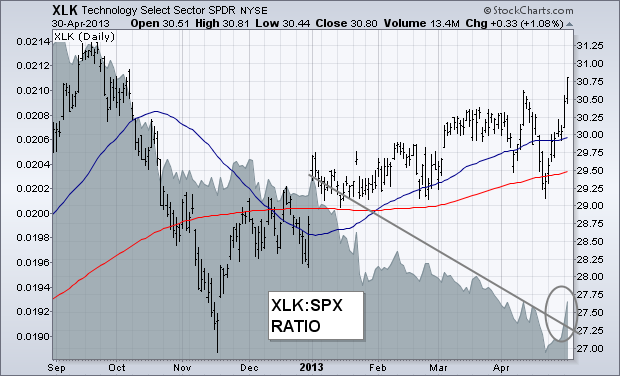
Technology SPDR Resumes Uptrend
by John Murphy,
Chief Technical Analyst, StockCharts.com
Thursday, April 25th I wrote about the technololgy sector being one of the markets weakest groups this year. That may finally be changing for the better. The chart below shows the Technology Sector SPDR (XLK) exceeding its early April high to reach the highest level in six months. The XLK/...
READ MORE
MEMBERS ONLY
TREASURY YIELDS SURGE ON JOBS REPORT AND REVISIONS -- SETTING A CHANNEL TARGET FOR THE S&P 500 ETF -- LEADERSHIP IN TECH AND CONSUMER DISCRETIONARY IS POSITIVE -- EW TECHNOLOGY ETF BREAKS CONSOLIDATION RESISTANCE
by John Murphy,
Chief Technical Analyst, StockCharts.com
TREASURY YIELDS SURGE ON JOBS REPORT AND REVISIONS... Link for todays video. The markets went through the employment wringer this week with the ADP report showing weak job growth on Wednesday, jobless claims dropping to a five year low on Thursday and non-farm payrolls growing a better-than-expected 165,000 in...
READ MORE
MEMBERS ONLY
IWM LEADS LOWER AS MDY FORMS BROADENING FORMATION -- MATERIALS SECTOR TURNS DOWN FROM RANGE RESISTANCE -- REBOUND STALLS FOR OIL & GAS EQUIPMENT/SERVICES SPDR -- COPPER-STOCK CORRELATION HITS LOWEST LEVEL IN OVER FIVE YEARS
by John Murphy,
Chief Technical Analyst, StockCharts.com
IWM LAGS AS MDY FORMS BROADENING FORMATION... Link for todays video. The Fed has come and gone without much fanfare, and no real change in policy as the Fed reiterated its pledge to continue the bond-buying program ($85 billion per month). The policy statement also noted that the committee would...
READ MORE
MEMBERS ONLY
TECHNOLOGY SPDR EXCEEDS APRIL HIGH AND SHOWS NEW UPSIDE LEADERSHIP -- APPLE AND MICROSOFT ARE LEADING GROUP HIGHER -- INTEL IS ANOTHER BIG TECH STOCK THAT'S RALLYING -- SO ARE OTHER CHIP STOCKS LIKE APPLIED MATERIALS, BROADCOM, AND NVIDIA
by John Murphy,
Chief Technical Analyst, StockCharts.com
TECHNOLOGY SPDR RESUMES UPTREND... Last Thursday's message wrote about the technololgy sector being one of the markets weakest groups this year. That may finally be changing for the better. Chart 1 shows the Technology Sector SPDR (XLK) exceeding its early April high to reach the highest level in...
READ MORE
MEMBERS ONLY
QQQ CHALLENGES SEPTEMBER HIGH -- APPLE AND GOOGLE PERK UP, BUT AMAZON UNDERPERFORMS -- IWM AND MDY TURN VOLATILE, BUT HOLD SUPPORT -- S&P 500 CONSOLIDATES NEAR CHANNEL TREND LINE -- PERCENTAGE OF STOCKS ABOVE 200-DAY SMA REMAINS AT HIGH LEVELS
by John Murphy,
Chief Technical Analyst, StockCharts.com
QQQ CHALLENGES SEPTEMBER HIGH... Link for todays video. April volatility continued as the Nasdaq 100 ETF (QQQ) surged back above 70 for the second time this month. With this gain, QQQ is again flirting with a 52-week high and showing upside leadership. Chart 1 shows the ETF with two patterns...
READ MORE
MEMBERS ONLY
TREASURY BOND ETFS HOLD BREAKOUTS AFTER GDP REPORT -- 30 YEAR YIELD REMAINS BELOW 3% -- RELATIVE STRENGTH IN TREASURIES COULD BE NEGATIVE FOR STOCKS -- COULD BLOW-OFF TOPS BE TAKING SHAPE IN XLP AND XLV?
by John Murphy,
Chief Technical Analyst, StockCharts.com
TREASURY BOND ETFS HOLD BREAKOUTS AFTER GDP REPORT ... Link for todays video. Either the relationship between stocks and Treasuries is changing or something needs to give. Stocks and Treasuries have shown a rather strong negative correlation since late 2010. This negative correlation is being challenged in April. The S&...
READ MORE
MEMBERS ONLY
APPLE HAS A LOT TO DO WITH TECHNOLOGY UNDERPERFORMANCE -- THE STOCK, HOWEVER, IS IN A POTENTIAL SUPPORT ZONE AND OVERSOLD -- MICROSOFT IS RISING -- SEMICONDUCTOR ETF REACHES NINE-YEAR HIGH -- KLA TENCOR AND TEXAS INSTRUMENTS NEAR MAJOR UPSIDE BREAKOUTS
by John Murphy,
Chief Technical Analyst, StockCharts.com
TECHNOLOGY SPDR HAS BEEN 2013 LAGGARD... My Tuesday message listed technology as one of this year's weakest market sectors. Let's take a look beneath the surface to see what's weighing on the sector, and where some strength lies. Chart 1 shows the Technology Sector...
READ MORE
MEMBERS ONLY
APRIL LOWS NOW MARK KEY SUPPORTS FOR SPY AND DIA -- CONSUMER DISCRETIONARY AND RETAIL SPDR MAINTAIN UPTREND -- OIL AND GOLD SURGE. IS IT AN OVERSOLD BOUNCE OR MORE? -- ENERGY-RELATED ETFS SURGE ALONG WITH OIL
by John Murphy,
Chief Technical Analyst, StockCharts.com
APRIL LOWS NOW MARK KEY SUPPORTS FOR SPY AND DIA... Link for todays video. With a big bounce over the last 3-4 days, the S&P 500 ETF (SPY) and the Dow SPDR (DIA) affirmed support levels that extend back to mid March. Chart 1 shows SPY plunging to...
READ MORE
MEMBERS ONLY
HALF OF MARKET IS IN A CORRECTION -- THAT'S WHAT NEEDS TO SHOW UPSIDE IMPROVEMENT -- THE GOOD NEWS IS THAT THE WEAKEST SECTORS -- ENERGY, MATERIAL, INDUSTRIALS AND TECHNOLOGY -- ARE BOUNCING OFF CHART SUPPORT
by John Murphy,
Chief Technical Analyst, StockCharts.com
HALF OF NYSE STOCKS ARE BELOW 50-DAY AVERAGE... The stock market continues to display remarkable resilience in the face of short-term warning signals of a possible downside correction. Although a number of short-term technical indicators have weakened, the market has kept rising. The resulting confusion may be the result of...
READ MORE
MEMBERS ONLY
FINANCE AND HOUSING WEIGH ON STOCK MARKET -- PULTE AND KB HOME TESTS KEY SUPPORT LEVELS -- TOLL BROTHERS AND USG CORP SHOW MORE SENSITIVITY -- PUTTING APPLES MARKET CAP LOSS INTO PERSPECTIVE -- APPLE HITS LONG-TERM SUPPORT AS EARNINGS LOOM
by John Murphy,
Chief Technical Analyst, StockCharts.com
FINANCE AND HOUSING WEIGH ON STOCK MARKET... Link for todays video. The stock market was trading flat at midday on Monday with the Finance SPDR (XLF) and the Home Construction iShares (ITB) sporting small declines and showing some relative weakness. Chart 1 shows XLF breaking the November trend line last...
READ MORE
MEMBERS ONLY
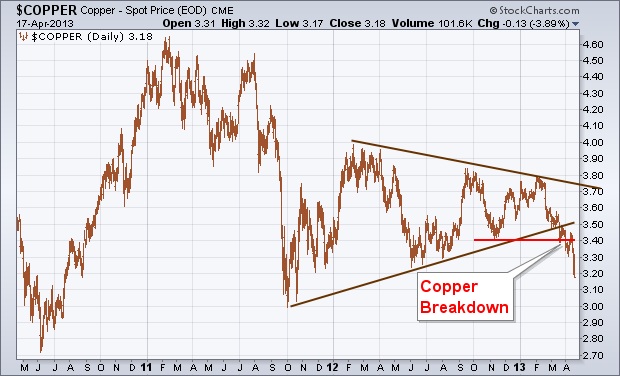
Copper Plunges To 18-Month Low-- FCX Tumbles With It
by John Murphy,
Chief Technical Analyst, StockCharts.com
Of all the commodity markets, copper is viewed as the most closely aligned with trends in the global economy. Copper and other commodities have been lagging behind global stocks over the past year (largely owing to a stronger dollar and weakness in Chinese stocks). This week's plunge in...
READ MORE
MEMBERS ONLY
SPY FIRMS AT SUPPORT AS DI TRIGGERS -- QQQ TRACES OUT A FAMILIAR PATTERN -- XLI FIRMS AT SUPPORT WITH INDECISIVE CANDLESTICK -- TREASURY BOND ETFS CHALLENGE RESISTANCE -- JOBLESS CLAIMS REMAIN IN DOWNTREND
by John Murphy,
Chief Technical Analyst, StockCharts.com
SPY FIRMS AT SUPPORT AS DI TRIGGERS... Link for todays video. It was a rough week for stocks as the S&P 500 ETF (SPY) and the Nasdaq 100 ETF (QQQ) declined to support from their mid March lows. Chart 1 shows SPY surging off the mid March lows...
READ MORE
MEMBERS ONLY
COPPER BREAKDOWN RATTLES GLOBAL MARKETS -- FREEPORT MCMORAN COPPER & GOLD ALSO TUMBLES -- FOREIGN STOCKS ARE PULLING U.S. STOCKS LOWER -- WEAKNESS IN TECHNOLOGY STOCKS HAS PULLED QQQ INTO DOWNSIDE CORRECTION -- SMALL CAPS HAVE TURNED DOWN
by John Murphy,
Chief Technical Analyst, StockCharts.com
COPPER PLUNGES TO 18-MONTH LOW-- FCX TUMBLES WITH IT... Of all the commodity markets, copper is viewed as the most closely aligned with trends in the global economy. Copper and other commodities have been lagging behind global stocks over the past year (largely owing to a stronger dollar and weakness...
READ MORE
MEMBERS ONLY
FINANCE SPDR STARTS SHOWING RELATIVE WEAKNESS -- JP MORGAN FORMS BEARISH REVERSAL PATTERN -- SEMICONDUCTOR SPDR TESTS KEY SUPPORT LEVEL WITH SHARP DECLINE -- BROADCOM, TEXAS INSTRUMENTS AND ANALOG DEVICES LEAD SEMIS LOWER
by John Murphy,
Chief Technical Analyst, StockCharts.com
FINANCE SPDR STARTS SHOWING RELATIVE WEAKNESS... Link for todays video. The three defensive sectors have been leading the market in 2013 and over the past four weeks. This means the Healthcare SPDR (XLV), Consumer Staples SPDR (XLP) and Utilities SPDR (XLU) are up more than the offensive sectors and the...
READ MORE
MEMBERS ONLY
A LOT OF TECHNICAL AND INTERMARKET FACTORS WARNED OF GOLD BREAKDOWN -- LONG TERM TECHNICAL INDICATORS HAVE BEEN WEAK -- GOLD MINERS HAD ALREADY BROKEN DOWN -- FALLING CHINESE STOCKS HAVE ALSO HURT COMMODITIES -- STOCKS HAVE SNAP BACK DAY BUT ON LOW VOLUME
by John Murphy,
Chief Technical Analyst, StockCharts.com
LONG TERM TECHNICAL INDICATORS WEAKEN... The financial media on TV spent all day yesterday trying to come up with a reason to explain gold's dramatic price plunge. I admit that I don't know why yesterday's drop was so big, or why it happened yesterday....
READ MORE
MEMBERS ONLY
DIA AND SPY LARGELY IGNORE THE NEGATIVES (SO FAR) -- RELATIVE WEAKNESS IN RSP FORESHADOWED LAST TWO CORRECTIONS -- OIL BREAKS KEY TREND LINE AND TESTS MARCH LOW -- XLE AND XES LEAD MARKET LOWER -- CHARTING THE DIPS IN NON-FARM PAYROLLS AND RETAIL SALES
by John Murphy,
Chief Technical Analyst, StockCharts.com
DIA AND SPY LARGELY IGNORE THE NEGATIVES (SO FAR)... Link for todays video. The S&P 500 ETF (SPY) and Dow Industrials SPDR (DIA) are within spitting distance of their highs, but the list of stock market negatives simply grows. Weakness in oil can be added to this list...
READ MORE
MEMBERS ONLY
MID-CAPS AND SMALL-CAPS LAG, BUT MAINTAIN UPTRENDS -- TREASURIES SURGE AFTER RETAIL SALES REPORT -- MCCLELLAN SUMMATION INDICES BREAK SUPPORT -- NASDAQ AD LINE FORMS BEARISH DIVERGENCE -- GOLD TESTS KEY SUPPORT ZONE WITH SHARP DECLINE
by John Murphy,
Chief Technical Analyst, StockCharts.com
MID-CAPS AND SMALL-CAPS LAG, BUT MAINTAIN UPTRENDS... Link for todays video. The S&P 500 ETF (SPY) and Dow Industrials SPDR (DIA) both hit fresh 52-week highs this week. Even the lowly Nasdaq 100 ETF (QQQ) managed a big gain and recorded a new high for 2013. The S&...
READ MORE
MEMBERS ONLY
S&P 500 CLOSES AT RECORD HIGH -- LAST WEEK'S LOW MARKS FIRST SUPPORT POINT -- POWERSHARES QQQ FINALLY SHOWS UPSIDE LEADERSHIP AND NEARS UPSIDE BREAKOUT -- EFA ISHARES REACH FIVE-YEAR HIGH -- JAPAN LEADS EAFE UPTURN -- EUROZONE BOUNCES OFF SUPPORT
by John Murphy,
Chief Technical Analyst, StockCharts.com
S&P 500 REACHES NEW INTRA-DAY RECORD... Yesterday's S&P 500 close pushed it through its October 2007 intra-day high at 1576. That means we can finally say that the S&P 500 is breaking out of its 13-year trading range that started in 2000...
READ MORE