MEMBERS ONLY
DOW AND S&P 500 EXTEND UPTRENDS WITH NEW HIGHS -- XLF LEADS WITH FLAG BREAKOUT - XLK CLEARS MARCH HIGHS -- INTERNET ETF SURGES TO CHANNEL RESISTANCE -- NETWORKING ISHARES BOUNCES TO BROKEN SUPPORT -- SEMICONDUCTOR ETF NEGATES SUPPORT BREAK
by John Murphy,
Chief Technical Analyst, StockCharts.com
DOW AND S&P 500 HIT NEW HIGHS... Link for todays video. bThe Dow Industrials and S&P 500 extended their uptrends and hit new highs on Wednesday. Fed minutes showed signs of dissent on quantitative easing and this put pressure on Treasuries and gold. This is a...
READ MORE
MEMBERS ONLY
RETAIL SPDR CONSOLIDATES ABOVE RESISTANCE BREAK -- TECHNOLOGY SPDR PULLS THE POP, STOP AND DROP -- KEY BREADTH INDICATOR FOR NASDAQ 100 TURNS BEARISH, BUT REMAINS BULLISH FOR SPX -- SPOT LIGHT CRUDE REVERSES AT TRIANGLE RESISTANCE
by John Murphy,
Chief Technical Analyst, StockCharts.com
RETAIL SPDR CONSOLIDATES ABOVE RESISTANCE BREAK... Link for todays video. Fridays employment report threw the stock market a curve ball on Friday, but the market managed to recover after a weak open. Non-farm payroll is a fairly volatile number that is subject to revision. The market will get another tests...
READ MORE
MEMBERS ONLY
Weak Commodities Hurt Producers
by John Murphy,
Chief Technical Analyst, StockCharts.com
This is the same headline used in my March 21 message which showed how falling commodities were hurting stocks of countries that produced commodities. A rising dollar causes foreign stocks to underperform U.S. stocks, which has been the case since the dollar bottomed during 2008. A rising dollar hurts...
READ MORE
MEMBERS ONLY
COMMODITY COUNTRIES HIT HARD BY FALLING PRICES -- PLUNGING YEN MAKES JAPAN WORLD'S STRONGEST MARKET -- GOLD TESTS SUPPORT BUT IS NO LONGER FAVORED OVER STOCKS -- OVERBOUGHT S&P 500 BACKS OFF FROM 2007 HIGH AND LOOKS TO BE ENTERING CORRECTION
by John Murphy,
Chief Technical Analyst, StockCharts.com
WEAK COMMODITIES HURT PRODUCERS... This is the same headline used in my March 21 message which showed how falling commodities were hurting stocks of countries that produced commodities. A rising dollar causes foreign stocks to underperform U.S. stocks, which has been the case since the dollar bottomed during 2008....
READ MORE
MEMBERS ONLY
WEAK JOBS REPORT PUSHES STOCKS DEEPER INTO CORRECTION -- FOREIGN STOCKS DROP AS WELL -- BOND PRICES JUMP AS YIELD DROPS
by John Murphy,
Chief Technical Analyst, StockCharts.com
NASDAQ BREAKS MARCH SUPPORT -- S&P IS CLOSE TO DOING THE SAME ... A very weak jobs report this morning has contributed to a sharply lower open in global stocks. Chart 1 shows the Nasdaq Composite falling below its March low near 3200, and its 50-day average. That raises...
READ MORE
MEMBERS ONLY
MARKET SUFFERS BAD COMBINATION OF FALLING PRICES AND RISING VOLUME -- SMALL CAPS AND TRANSPORTS LEAD DECLINE -- CANADIAN STOCKS TUMBLE -- BOND YIELD BREAKS SUPPORT -- NASDAQ AND S&P 500 ARE NEARING TEST OF FEBRUARY LOWS
by John Murphy,
Chief Technical Analyst, StockCharts.com
SMALL CAPS AND TRANSPORTS LEAD MARKET LOWER... Wednesday's stock drop was the weakest combination of falling prices and rising volume this year. Also disturbing are the number of former group leaders that have suffered short-term breakdowns. Chart 1 shows the Dow Transports falling to the lowest level in...
READ MORE
MEMBERS ONLY
SMALL-CAPS SHOW RELATIVE WEAKNESS AS IWM BREAKS SUPPORT -- USING THE VORTEX INDICATOR WITH SPY AND MDY -- FINANCIALS LEAD THE SECTORS LOWER -- HOMEBUILDERS LEAD CONSUMER DISCRETIONARY SECTOR LOWER -- FDN TESTS SUPPORT AS IGN AND SMH BREAK SUPPORT
by John Murphy,
Chief Technical Analyst, StockCharts.com
SMALL-CAPS SHOW RELATIVE WEAKNESS AS IWM BREAKS SUPPORT... Link for todays video. Small-caps started lagging large-caps last week and this relative weakness turned into absolute weakness as the Russell 2000 ETF (IWM) moved sharply lower the last few days. Chart 1 shows IWM consolidating the last two weeks of March...
READ MORE
MEMBERS ONLY
DIRECTIONAL MOVEMENT INDICATORS BATTLE IT OUT FOR DIA AND IWM -- SMALL-CAPS LEAD MARKET LOWER AFTER ISM -- BEARISH DIVERGENCES REMAIN FOR KEY BREADTH INDICATOR -- WHAT'S THE DEAL WITH APRIL?
by John Murphy,
Chief Technical Analyst, StockCharts.com
DIRECTIONAL MOVEMENT INDICATORS BATTLE IT OUT FOR DIA AND IWM... Link for todays video. Lots of people are looking for a stock market correction, but it remains elusive as the major index ETFs either consolidate or extend their gains. There is only one thing required for a correction: more selling...
READ MORE
MEMBERS ONLY
S&P 500 TESTS 2007 HIGH -- STOCK/BOND RATIO REACHES FIVE-YEAR HIGH -- FIXED INCOME MONEY ROTATES FROM TREASURIES TO CORPORATE BONDS -- HIGH YIELD BONDS REMAIN STRONGEST BOND CATEGORY -- DIVIDEND PAYING STOCKS ARE HELPING LEAD MARKET ADVANCE
by John Murphy,
Chief Technical Analyst, StockCharts.com
S&P NEARS TEST OF 2007 HIGH ... The monthly bars in Chart 1 show the S&P 500 nearing its October 2007 intra-day peak at 1576. [The SPX is right at its 2007 closing high at 1565]. A new record high by the SPX seems inevitable given the...
READ MORE
MEMBERS ONLY
QQQ RECOVERS AFTER WEAK OPEN -- ANALOG DEVICES, BROADCOM AND INTEL LEAD SEMIS HIGHER -- XLI AND XLF STALL WITH SMALL CONTINUATION PATTERNS -- EURO ETF EXTENDS PLUNGE TOWARDS NOVEMBER LOW -- TREASURIES SURGE IN FLIGHT TO SAFETY
by John Murphy,
Chief Technical Analyst, StockCharts.com
QQQ RECOVERS AFTER WEAK OPEN ... Link for todays video. The markets are a bit jittery on Wednesday, but US technology stocks are holding up rather well and showing some buying interest. Sharp declines in the Euro and European equities put investors on edge Wednesday. Oil was also trading lower, while...
READ MORE
MEMBERS ONLY
QQQ HITS RESISTANCE, BUT HOLDS THE WEDGE -- APPLE BREAKS 50-DAY AS AMZN TESTS SUPPORT -- FDN, IGN AND SMH NEAR KEY SUPPORT LEVELS -- EURO FALLS AFTER CYPRUS DEAL -- ITALIAN, FRENCH AND SPANISH STOCKS GIVE UP EARLY GAINS
by John Murphy,
Chief Technical Analyst, StockCharts.com
QQQ HITS RESISTANCE AT MARCH HIGH, BUT HOLDS THE WEDGE... Link for todays video. The Nasdaq 100 ETF (QQQ) may be forming a rising wedge, but that wedge is clearly rising and the medium-term trend is up as long as it rises. There are two sides to every trade, a...
READ MORE
MEMBERS ONLY
HEALTHCARE AND CONSUMER STAPLES SPDRS GRAB THE LEAD -- CONSUMER STAPLES SPDR EXCEEDS CHANNEL LINE -- EQUAL-WEIGHT SECTOR ETFS OUTPERFORM SECTOR SPDRS -- TECHS AND MATERIALS SHOW RELATIVE WEAKNESS -- GDX FORMS BEAR WEDGE WITH OVERSOLD BOUNCE
by John Murphy,
Chief Technical Analyst, StockCharts.com
HEALTHCARE AND CONSUMER STAPLES SPDRS GRAB THE LEAD... Link for todays video. By far, the Healthcare SPDR (XLV) and the Consumer Staples SPDR (XLP) are the top performing sectors SPDRs year-to-date. PerfChart 1 shows XLV and XLP crushing the competition with outperforming exceeding 3%. The Finance SPDR (XLF) is the...
READ MORE
MEMBERS ONLY
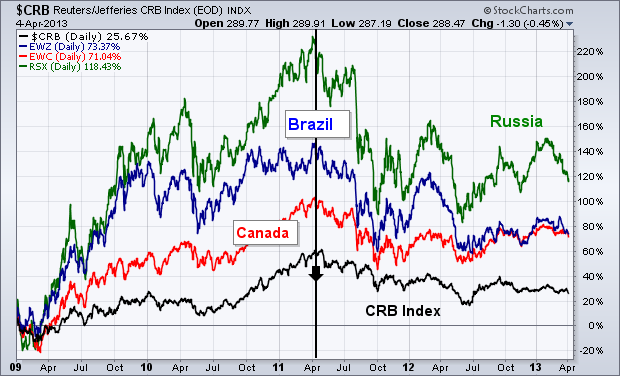
WEAK COMMODITIES HURT PRODUCERS LIKE BRAZIL AND CANADA -- THAT'S A SIDE-EFFECT OF A STRONGER U.S. DOLLAR -- WEAK CANADIAN DOLLAR IS PUTTING DOWNSIDE PRESSURE ON CANADA ISHARES -- VANGUARD EX-USA STOCK INDEX REMAINS STALLED BELOW 2011 HIGH
by John Murphy,
Chief Technical Analyst, StockCharts.com
BRAZIL AND CANADA ARE UNDERPERFORMING THE U.S.... Last Thursday's message focused on the side-effects of a stronger U.S. dollar. One of the most notable intermarket effects was weaker commodity markets. Another is that a firmer dollar favors U.S. stocks over foreign stocks. I showed a...
READ MORE
MEMBERS ONLY
SPY STALLS WITH A NARROW RANGE DAY -- QQQ AND XLK TURN VOLATILE, BUT HOLD THEIR GAPS -- HOUSING STARTS AND BUILDING PERMITS EXTEND LONG-TERM UPTRENDS -- HOME CONSTRUCTION ISHARES LEADS AGAIN WITH A NEW HIGH
by John Murphy,
Chief Technical Analyst, StockCharts.com
SPY STALLS WITH A NARROW RANGE DAY... Link for todays video. The Fed reiterated its intentions to purchase some $85 billion per month of Treasury and mortgage bonds and the market greeted this news with a yawn. Stocks were already up heading into the announcement and traded flat afterwards. Chart...
READ MORE
MEMBERS ONLY
FOREIGN MARKET WEAKNESS IS BEGINNING TO WEIGH ON OVERBOUGHT US STOCKS -- EMERGING MARKET ISHARES FALL TO LOWEST LEVEL IN FOUR MONTHS -- EUROPEAN ETF FALLS BELOW 50-DAY AVERAGE IN HEAVY TRADING -- RISING DOLLAR PUNISHES ENERGY STOCKS
by John Murphy,
Chief Technical Analyst, StockCharts.com
EMERGING MARKET ISHARES CONTINUE TO DROP ... Last Thursday's message showed emerging markets rolling over to the downside, and warned that might be signalling a pullback in the U.S. That situation has grown worse since then. Chart 1 shows Emerging Markets iShares (EEM) falling to the lowest level...
READ MORE
MEMBERS ONLY
IWM AND MDY RECOVER AFTER WEAK OPENINGS -- TREASURIES BOUNCE IN FLIGHT TO SAFETY -- EURO HITS KEY RETRACEMENT AND MOVING AVERAGE -- GOLD BOUNCES OFF RANGE SUPPORT -- COPPER BREAKDOWN SIGNALS A CONTINUATION LOWER
by John Murphy,
Chief Technical Analyst, StockCharts.com
IWM AND MDY REOVER AFTER WEAK OPENINGS... Link for todays video. Events in Cyprus triggered selling pressure that started with Asian stocks, continued in Europe and extended to the US on the open. The Hang Seng Index ($HSI) fell 2% and the Nikkei 225 ($NIKK) fell 2.71%. European equities...
READ MORE
MEMBERS ONLY
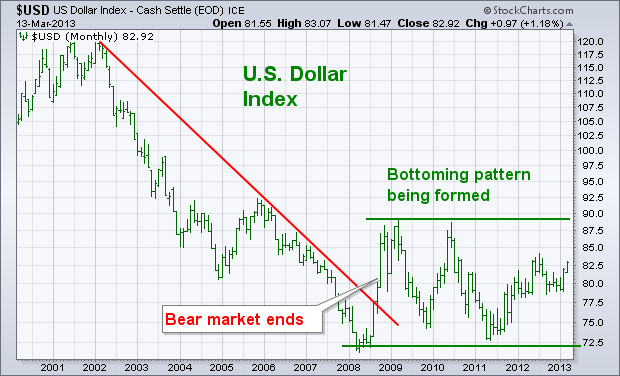
U.S. Dollar Appears To Be Bottoming
by John Murphy,
Chief Technical Analyst, StockCharts.com
The monthly bars in Chart 1 plot the U.S. Dollar Index since 2001. Two major trends are seen on the chart. The first is the major downtrend in the dollar between 2002 and 2008. During 2008, the USD broke its six-year down trendline which ended its bear market. Since...
READ MORE
MEMBERS ONLY
CHANNEL LINE MARKS UPSIDE TARGET FOR THE S&P 500 -- COMBINING THE MACD-HISTOGRAM AND THE SIX MONTH CYCLE -- WHY IS THE S&P 500 ETF ALREADY ABOVE ITS 2007 HIGH? -- S&P MIDCAP 400 IS THE ONE TRUE LEADER -- RUSSELL 2000 IS SECOND
by John Murphy,
Chief Technical Analyst, StockCharts.com
CHANNEL LINE MARKS UPSIDE TARGET FOR THE S&P 500 ... Link for todays video. There is certainly much ado about the S&P 500 and the 2007 highs these days. In the words of Mickey Blue Eyes, I say fuhgeddaboudit. Thats mob speak for forget about it. Why?...
READ MORE
MEMBERS ONLY
SIDE-EFFECTS OF A STRONGER DOLLAR INCLUDE STOCKS DOING BETTER THAN COMMODITIES -- A STRONGER DOLLAR ALSO FAVORS U.S. OVER FOREIGN STOCKS -- TREASURY BOND YIELD IS RISING FASTER THAN FOREIGN YIELDS WHICH FAVORS DOLLAR AND U.S. STOCKS
by John Murphy,
Chief Technical Analyst, StockCharts.com
U.S. DOLLAR APPEARS TO BE BOTTOMING... The monthly bars in Chart 1 plot the U.S. Dollar Index since 2001. Two major trends are seen on the chart. The first is the major downtrend in the dollar between 2002 and 2008. During 2008, the USD broke its six-year down...
READ MORE
MEMBERS ONLY
RETAIL SALES GROWTH BREAKS THE 1% THRESHOLD -- CONSUMER DISCRETIONARY SECTOR SHOWS RELATIVE STRENGTH IN MARCH -- HOME CONSTRUCTION ISHARES FORMS BULLISH CONTINUATION PATTERN -- RETAIL SPDR AND MV RETAIL ETF LEAD MARCH SURGE
by John Murphy,
Chief Technical Analyst, StockCharts.com
RETAIL SALES GROWTH BREAKS THE 1% THRESHOLD... Link for todays video. The Commerce Department reported a 1.1% rise in February retail sales and the January number was revised higher. This better-than-expected number put retail sales growth above 1% for the first time since September. Chart 1 shows an area...
READ MORE
MEMBERS ONLY
DROP IN EMERGING MARKETS MAY BE SIGNALLING MARKET PULLBACK -- EAFE ISHARES ARE ALSO STALLING AT THEIR 2012 PEAK AND ARE LOSING UPSIDE MOMENTUM -- THE S&P 500 HAS COME WITHIN FIVE POINT OF ITS 2007 TOP
by John Murphy,
Chief Technical Analyst, StockCharts.com
EMERGING MARKET ISHARES ARE SLIPPING ... While an overbought S&P 500 is nearing a test of its 2007 high, emerging markets are starting to run into potential trouble around their 2012 highs. Chart 1 shows Emerging Markets iShares (EEM) falling back below their 2012 high after moving above it...
READ MORE
MEMBERS ONLY
SPY HOLDS THE GAP WITH ANOTHER NEW HIGH -- REVISITING AROON FOR MDY AND IWM -- NETWORKING ETF AND SEMICONDUCTOR SPDR BREAK WEDGE RESISTANCE -- NET NEW HIGHS SURGE YET AGAIN
by John Murphy,
Chief Technical Analyst, StockCharts.com
SPY HOLDS THE GAP WITH ANOTHER NEW HIGH... Link for todays video. You will often here trend-followers say, "a trend in motion stays in motion". This implies that the trend extends until proven otherwise. The current uptrend in stocks is clearly a trend that is staying in motion....
READ MORE
MEMBERS ONLY
10-YEAR TREASURY YIELD SURGES ON POSITIVE JOBS REPORT -- 7-10 YR TREASURY BOND ETF TESTS MAJOR SUPPORT LINE -- NON-FARM PAYROLLS EXCEED 200,000 FOR THIRD TIME IN FOUR MONTHS -- SPOT LIGHT CRUDE HITS KEY RETRACEMENT
by John Murphy,
Chief Technical Analyst, StockCharts.com
10-YEAR TREASURY YIELD SURGES ON POSITIVE JOBS REPORT... Link for todays video. Treasury bonds got hammered and treasury yields surged on the heels of today's employment report. The February surge in non-farm payrolls takes some pressure off the Fed for quantitative easing because the unemployment rate fell to...
READ MORE
MEMBERS ONLY
DOW INDUSTRIALS JOIN TRANSPORTS IN RECORD TERRITORY -- S&P 500 NEARS TEST OF 2000-2007 HIGH -- SMALL AND MIDSIZE INDEXES HAVE ALREADY HIT NEW HIGHS -- SO HAS THE S&P 500 EQUAL WEIGHT ETF WHICH GIVES BIGGER WEIGHT TO SMALLER STOCKS
by John Murphy,
Chief Technical Analyst, StockCharts.com
DOW INDUSTRIALS JOIN TRANSPORTS AT RECORD HIGHS... The ability of the Dow Industrials to rise above its 2007 high to reach a new record is certainly a positive development for the stock market's long-term trend. The monthly bars in Chart 1 show the Dow Industrials trading above their...
READ MORE
MEMBERS ONLY
MDY AND IWM CHALLENGE THEIR FEBRUARY HIGHS -- ALL FOUR OFFENSIVE SECTORS HIT NEW HIGHS FOR 2013 -- XLK GAPS AND BREAKS ABOVE FEBRUARY HIGHS -- AD LINES HIT NEW HIGHS TO CONFIRM UNDERLYING STRENGTH
by John Murphy,
Chief Technical Analyst, StockCharts.com
MDY AND IWM CHALLENGE THEIR FEBRUARY HIGHS... Link for todays video. Despite signs of waning upside momentum, the Russell 2000 ETF (IWM) and S&P Midcap SPDR (MDY) held support and surged back to their February highs. Chart 1 shows IWM bouncing off the 89 area with a six...
READ MORE
MEMBERS ONLY
AROON INDICATORS TURN BEARISH FOR IWM AND MDY -- HOME CONSTRUCTION ETF BATTLES KEY RETRACEMENTS -- RETAIL SPDR FORMS WEDGE AFTER SUPPORT BOUNCE -- SHANGHAI COMPOSITE TUMBLES OVER 3.5% -- STEEL, COPPER MINERS AND COAL ETFS GET SLAMMED AGAIN
by John Murphy,
Chief Technical Analyst, StockCharts.com
AROON INDICATORS TURN BEARISH FOR IWM AND MDY... Link for todays video. Despite concerns that stocks are ripe for a correction, we have yet to see medium-term support breaks that would signal the start of these corrections. We are, however, starting to see some momentum indicators turn and short-term bearish...
READ MORE
MEMBERS ONLY
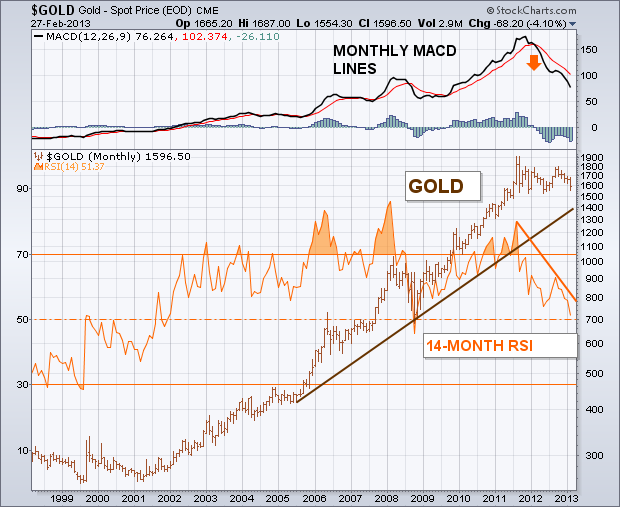
LONG-TERM INDICATORS ARE ROLLING OVER
by John Murphy,
Chief Technical Analyst, StockCharts.com
A lot of traders and investors are waiting for the bull market in gold to resume. They may have a very long wait. That's because a lot of traditional chart, technical, and intermarket signs are now working against gold. Let's start with a long-term look. The...
READ MORE
MEMBERS ONLY
DIA FALLS AFTER FORMING SHOOTING-STAR -- CCI BREAKDOWN COULD SIGNAL AN EMERGING DOWNTREND IN SPY -- DEFENSIVE SECTORS LEAD IN FEBRUARY AND OFFENSIVE SECTORS LAG -- DOLLAR ETF SURGES TO SIX MONTH HIGH
by John Murphy,
Chief Technical Analyst, StockCharts.com
DIA FALLS AFTER FORMING SHOOTING-STAR... Link for todays video. The Dow SPDR (DIA) was the strongest of the major index ETFs this week, but that did not stop the parade of bearish candlestick patterns. DIA was the only major index ETF to record a new high this week. The S&...
READ MORE
MEMBERS ONLY
THE BULL MARKET IN GOLD MAY BE OVER -- LONG-TERM TECHNICAL INDICATORS WEAKEN -- A STRONG DOLLAR, STRONGER STOCKS, AND WEAK GOLD MINERS ARE ALSO BAD FOR GOLD -- LONG-TERM RATIO ANALYSIS FAVORS STOCKS OVER COMMODITIES
by John Murphy,
Chief Technical Analyst, StockCharts.com
LONG-TERM INDICATORS ARE ROLLING OVER... A lot of traders and investors are waiting for the bull market in gold to resume. They may have a very long wait. That's because a lot of traditional chart, technical, and intermarket signs are now working against gold. Let's start...
READ MORE
MEMBERS ONLY
DOW RECAPTURES 14000 WITH TWO-DAY SURGE -- MDY AND IWM AFFIRM MEDIUM-TERM SUPPORT LEVELS -- ITB AND XLY LEAD REBOUND BY ERASING MONDAYS PLUNGE -- TREASURIES RETREAT, BUT BREAKOUT HOLDS
by John Murphy,
Chief Technical Analyst, StockCharts.com
DOW RECAPTURES 14000 WITH TWO-DAY SURGE... Link for todays video. After breaking below 13800 with a plunge on Monday, the Dow surged back above 14000 with a surge over the last two days. It has been a wild ride the last six trading days with the Dow moving over 100...
READ MORE
MEMBERS ONLY
DOW DIGESTS GAINS AS SUPPLY AND DEMAND EQUALIZE -- JUST A SHORT PULLBACK OR MORE FOR THE S&P 500 EW INDEX -- PRICE RELATIVE BREAKS SUPPORT FOR RETAIL SPDR -- TECHNOLOGY SPDR REFUSES TO BUCKLE -- KEY SUPPORTS FOR INTERNET, NETWORKING AND SEMICONDUCTOR ETFS
by John Murphy,
Chief Technical Analyst, StockCharts.com
DOW DIGESTS GAINS AS BUYING AND SELLING PRESSURE EQUALIZE... Link for todays video. There are two ways to alleviate overbought conditions: correct with a pullback in prices or consolidate with a trading range. The Dow may be taking the latter road with a consolidation in the 13800-14000 area. Chart 1...
READ MORE
MEMBERS ONLY
CORRECTION: NYSE BULLISH PERCENT INDEX IS STILL UP BUT REMAINS IN OVERBOUGHT TERRITORY -- FRIDAY'S PRICE GAIN CAME ON VERY LIGHT VOLUME -- CONSUMER STAPLES WERE WEEK'S TOP SECTOR
by John Murphy,
Chief Technical Analyst, StockCharts.com
NYSE BULLISH PERCENT INDEX IS STILL UP... My Thursday Market Message incorrectly stated that the NYSE Bullish Percent Index had turned down. Unfortunately, the chart I showed was the point & figure chart of the NYSE Composite Index which did turn down. Chart 1 shows that happening this week when...
READ MORE
MEMBERS ONLY
CONSUMER DISCRETIONARY SPDR STARTS TO UNDERPERFORM -- AUTO INDEX NEARS FIRST RETRACEMENT -- TREASURY YIELDS HOLD THE KEY TO THE STOCK MARKET -- GOLD NEARS SUPPORT FROM LONG-TERM TRADING RANGE -- SOYBEANS INDEX FORMS BULLISH REVERSAL PATTERN
by John Murphy,
Chief Technical Analyst, StockCharts.com
CONSUMER DISCRETIONARY SPDR STARTS TO UNDERPERFORM... Link for todays video. The Consumer Discretionary SPDR (XLY) is perhaps the most important of the nine sectors SPDRs because it is closely tied to the economy. Note that the housing, retail, restaurant and automobile industries are part of the consumer discretionary sector. Chartists...
READ MORE
MEMBERS ONLY
MONEY ROTATES OUT OF MATERIALS AND INTO CONSUMER STAPLES -- DOW MEETS HEAVY SELLING NEAR 14000 AS MARKET ENTERS DOWNSIDE CORRECTION -- RISING DOLLAR PUNISHES COMMODITIES -- DROP IN FOREIGN CURRENCIES SHOWS LOSS OF CONFIDENCE
by John Murphy,
Chief Technical Analyst, StockCharts.com
DEFENSIVE ROTATION ... Sector rotation often gives clues about the mood of the market. This week's sector trends suggest a more defensive mood. Chart 1, for example, shows the Materials SPDR (XLB) tumbling below its 50-day average over the last two days -- and on very heavy volume. The...
READ MORE
MEMBERS ONLY
EXTENDING THE RAFF REGRESSION CHANNELS FOR MDY AND IWM -- XLB BREAKS SUPPORT AND SHOWS RELATIVE WEAKNESS -- XME, COPX AND SLX WEIGH ON MATERIALS SECTOR -- COPPER ETN BREAKS WEDGE SUPPORT -- ITB FAILS TO CONFIRM NEW HIGH IN SPY
by John Murphy,
Chief Technical Analyst, StockCharts.com
EXTENDING THE RAFF REGRESSION CHANNELS FOR MDY AND IWM... Link for todays video. Last week I featured the Russell 2000 ETF (IWM) and the S&P Midcap SPDR (MDY) with Raff Regression Channels. Both ETFs moved to new highs on Tuesday and this means the Raff Regression Channels need...
READ MORE
MEMBERS ONLY
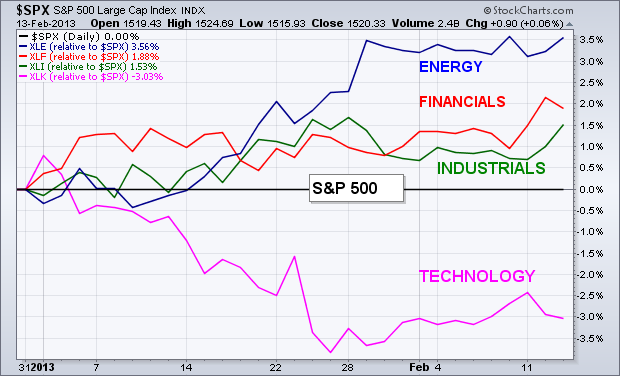
2013 Sector Leaders are Energy and Financials
by John Murphy,
Chief Technical Analyst, StockCharts.com
SECTOR LEADERS YEAR TO DATE... Chart 1 plots relative strength ratios of the energy, financial, and industrial sectors versus the S&P 500 (the black zero line). Those three sectors have been the top performers year to date. Technology has been the weakest (on a relative basis). Let'...
READ MORE
MEMBERS ONLY
QQQ HOLDS BREAKOUT WITH SMALLER CONSOLIDATION -- RSI FAILURE SWINGS TAKE SHAPE IN XLY, SPY, XHB AND IGN -- BULLISH PERCENT INDEX LAGS THE DOW INDUSTRIALS -- LIGHT CRUDE AND BRENT CRUDE FALL SHARPLY -- FALLING FLAGS FORM IN THREE EMERGING MARKET ETFS
by John Murphy,
Chief Technical Analyst, StockCharts.com
QQQ HOLDS BREAKOUT WITH SMALLER CONSOLIDATION... Link for todays video. Last week I wrote about narrowing Bollinger Bands in the Nasdaq 100 ETF (QQQ) and the ETF broke above the upper band with a close above 68 last Thursday. This move looked significant because QQQ also broke out of a...
READ MORE
MEMBERS ONLY
2013 SECTOR LEADERS ARE ENERGY AND FINANCIALS -- THEIR ETFS HAVE ACHIEVED BULLISH BREAKOUTS -- FINANCIAL LEADERS INCLUDE AMERICAN EXPRESS, GOLDMAN SACHS, AND JP MORGAN -- SEMICONDUCTOR ETF NEARS 10-YEAR HIGH
by John Murphy,
Chief Technical Analyst, StockCharts.com
SECTOR LEADERS YEAR TO DATE... Chart 1 plots relative strength ratios of the energy, financial, and industrial sectors versus the S&P 500 (the black zero line). Those three sectors have been the top performers year to date. Technology has been the weakest (on a relative basis). Let'...
READ MORE
MEMBERS ONLY
USING RAFF AND AROON TO DEFINE THE UPTRENDS IN MDY AND IWM -- XLI, XLY AND XLF RECORD FRESH NEW HIGHS -- BASIC MATERIALS SPDR STILL SHOWS RELATIVE WEAKNESS -- NOOSE TIGHTENS FOR CONSOLIDATION IN THE STEEL ETF
by John Murphy,
Chief Technical Analyst, StockCharts.com
USING RAFF AND AROON TO DEFINE THE UPTRENDS IN MDY AND IWM... Link for todays video. The trend is your friend until the end. While I cannot tell you when these uptrends will end, I can offer a technical approach to define the trend and marking key support. It is...
READ MORE
MEMBERS ONLY
SPY ADVANCES FOR SIX CONSECUTIVE WEEKS -- QQQ LAGS SPY, BUT REMAINS IN UPTREND -- CONSUMER DISCRETIONARY SPDR TESTS RELATIVE PERFORMANCE TREND LINE -- XRT HOLDS CONSOLIDATION BREAKOUT -- GOLD BREAKS WEDGE SUPPORT TO EXTEND DOWNTREND
by John Murphy,
Chief Technical Analyst, StockCharts.com
SPY ADVANCES FOR SIX CONSECUTIVE WEEKS... Link for todays video. The S&P 500 ETF (SPY) is up six consecutive weeks and ten of the last twelve (since mid November). Even though the advance has turned into a grind this year, chart 1 shows SPY continuing to gain ground...
READ MORE