MEMBERS ONLY
BOND YIELDS CONTINUE TO CLIMB -- THAT'S HELPING BANK STOCKS
by John Murphy,
Chief Technical Analyst, StockCharts.com
TEN-YEAR YIELD EXTENDS UPTREND... The uptrend in bond yields is continuing. The daily bars in Chart 1 show the 10-Year Treasury yield touching a new recovery high in today's trading. That puts the TNX at the highest level since last March. The horizontal line in Chart 2 shows...
READ MORE
MEMBERS ONLY
COMMODITY PRICES CONTINUE TO RISE WHICH SUGGESTS MORE INFLATION -- RISING COMMODITIES ARE BOOSTING BOND YIELDS AND THE YIELD CURVE
by John Murphy,
Chief Technical Analyst, StockCharts.com
CRB INDEX BREAKS TRENDLINE RESISTANCE... The current rally in commodity markets is attracting a lot of attention. Not just because commodities represent an asset class that's been attracting a lot of money over the last year. But also because of their intermarket implications. Stronger commodity markets are usually...
READ MORE
MEMBERS ONLY
ENERGY SPDR NEARS TEST OF JUNE HIGH -- A NUMBER OF INDIVIDUAL STOCKS ARE ALSO TESTING THAT CHART BARRIER -- CRUDE OIL PRICES CONTINUE TO CLIMB
by John Murphy,
Chief Technical Analyst, StockCharts.com
ENERGY SPDR NEARS TEST OF JUNE HIGH...Energy stocks continue to show both absolute and relative strength. They're leading the market higher today, and have been the market's strongest sector over the last three months. And they're approaching an important test. The daily bars...
READ MORE
MEMBERS ONLY
Russell 2000 Hits New Record as Small Cap Leadership Continues
by John Murphy,
Chief Technical Analyst, StockCharts.com
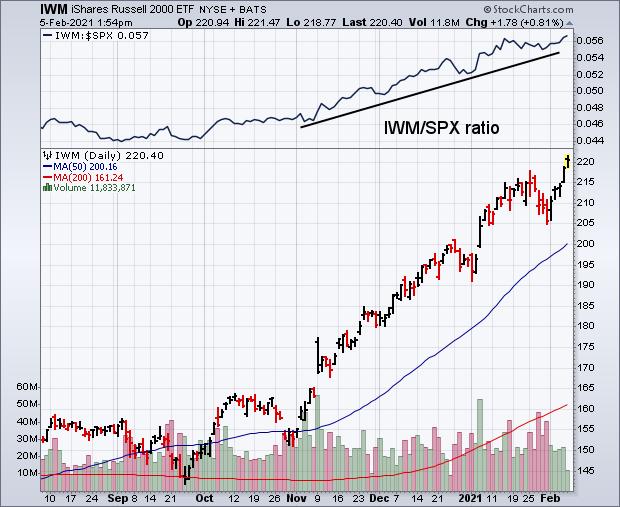
Stocks are ending the week on a firm note with the S&P 500 and Nasdaq trading in record territory. The Dow isn't far behind. Small cap stocks, however, continue to lead the market higher. The daily bars in Chart 1 show the Russell 2000 iShares (IWM)...
READ MORE
MEMBERS ONLY
RUSSELL 2000 HITS NEW RECORD AS SMALL CAP LEADERSHIP CONTINUES -- SMALL CAP LEADERSHIP IS THE STRONGEST IN DECADE -- RISING BOND YIELDS HELP SMALL CAPS
by John Murphy,
Chief Technical Analyst, StockCharts.com
RUSSELL 2000 ISHARES HIT NEW RECORD... Stocks are ending the week on a firm note with the S&P 500 and Nasdaq trading in record territory. The Dow isn't far behind. Small cap stocks, however, continue to lead the market higher. The daily bars in Chart 1...
READ MORE
MEMBERS ONLY
TAKING ANOTHER LOOK AT BITCOIN
by John Murphy,
Chief Technical Analyst, StockCharts.com
BITCOIN BOUNCES OFF ITS 50-DAY AVERAGE... A couple of recent messages took a look at Bitcoin as it underwent a downside correction. We'll take another look today. The main message is that it's starting to look stronger. Chart 1 shows Bitcoin in what looks like a...
READ MORE
MEMBERS ONLY
GAMESTOP AND AMC GAP LOWER -- SO DOES SILVER AND ITS MINERS -- DOW REGAINS 50-DAY LINE
by John Murphy,
Chief Technical Analyst, StockCharts.com
GAMESTOP AND AMC GAP SHARPLY LOWER... The recent short-squeeze mania may have finally run its course. Charts 1 and 2 show GameStop And AMC gapping sharply lower today. Other stocks caught up in the short squeeze are trading sharply lower as well. To the extent that last week's...
READ MORE
MEMBERS ONLY
TECHNOLOGY LEADING MARKET HIGHER -- A LOOK AT THE BIGGEST TECHS -- SILVER SQUEEZE?
by John Murphy,
Chief Technical Analyst, StockCharts.com
TECHNOLOGY STOCKS LEAD MARKET HIGHER ... Technology stocks are the strongest sector in a strong market day. The Technology SPDR (XLK) is trading nearly 3% higher today. The biggest tech stocks are also having a strong day. Chart 1 shows Apple gaining nearly 2% while keeping its uptrend intact. Chart 2...
READ MORE
MEMBERS ONLY
GameStop Mania May Be Contributing to Selling
by John Murphy,
Chief Technical Analyst, StockCharts.com
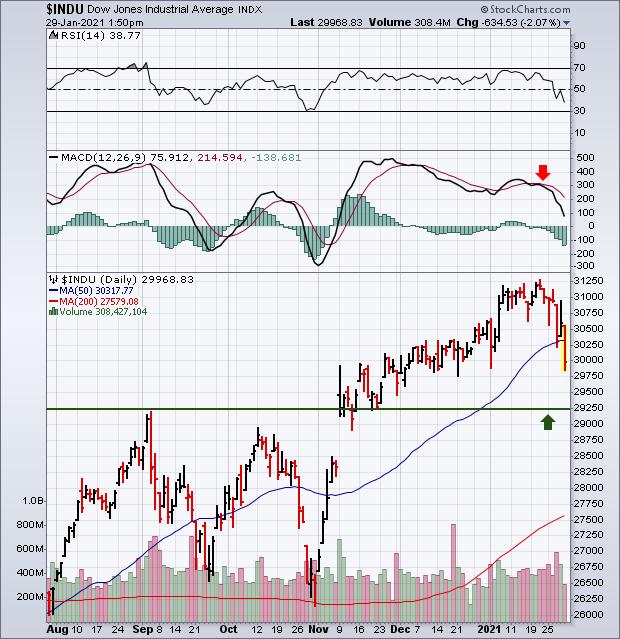
Stock indexes remain under pressure again today and are pressuring moving average lines. Chart 1 shows the Dow Industrials falling below its 50-day moving average for the first time since early November. It may be headed for a test of a potential support line drawn over its early September high....
READ MORE
MEMBERS ONLY
WEEKLY SECTOR RANKING SHOWS MORE CAUTION
by John Murphy,
Chief Technical Analyst, StockCharts.com
STOCKS TURN MORE DEFENSIVE...With stocks under pressure this week, it makes sense to see its eleven market sectors taking a more defensive turn as well. Chart 1 ranks the eleven market sectors from the strongest at the top to the weakest on the bottom. The first thing to notice...
READ MORE
MEMBERS ONLY
STOCKS REMAIN UNDER PRESSURE -- SOME MOVING AVERAGE LINES ARE BEING BROKEN -- GAMESTOP MANIA MAY BE CONTRIBUTING TO SELLING
by John Murphy,
Chief Technical Analyst, StockCharts.com
STOCKS TEST MOVING AVERAGE LINES... Stock indexes remain under pressure again today and are pressuring moving average lines. Chart 1 shows the Dow Industrials falling below its 50-day moving average for the first time since early November. It may be headed for a test of a potential support line drawn...
READ MORE
MEMBERS ONLY
STOCKS UNDERGO SOME PROFIT-TAKING -- SOME MACD DIVERGENCES TO WATCH
by John Murphy,
Chief Technical Analyst, StockCharts.com
DAILY MACD LINES SHOW NEGATIVE DIVERGENCE... Stocks are undergoing some profit-taking today in a market that looks stretched on the upside. One of the factors that concerns me is the relatively weak performance by daily MACD lines. Chart 1 overlays the MACD lines on a daily chart of the S&...
READ MORE
MEMBERS ONLY
BITCOIN TESTS UNDERLYING SUPPORT LEVELS
by John Murphy,
Chief Technical Analyst, StockCharts.com
BITCOIN RETESTS JANUARY LOW... Bitcoin remains in a downside correction that started earlier in January. And it's testing some important support levels. The daily bars in Chart 1 show bitcoin testing a couple of support levels formed earlier in the month (horizontal lines). It's also nearing...
READ MORE
MEMBERS ONLY
BIG TECH STOCKS ARE MAKING A COMEBACK -- QQQ IS SHOWING NEW LEADERSHIP
by John Murphy,
Chief Technical Analyst, StockCharts.com
BIT TECHS ARE DOING BETTER... The largest technology stocks have been trading sideways over the past few months while the rest of the market has been rallying. The last two days, however, are showing money starting to flow back into some of the biggest tech stocks. Chart 1 shows Apple...
READ MORE
MEMBERS ONLY
A Three-Month Look at Sector Leadership Shows More Optimism
by John Murphy,
Chief Technical Analyst, StockCharts.com
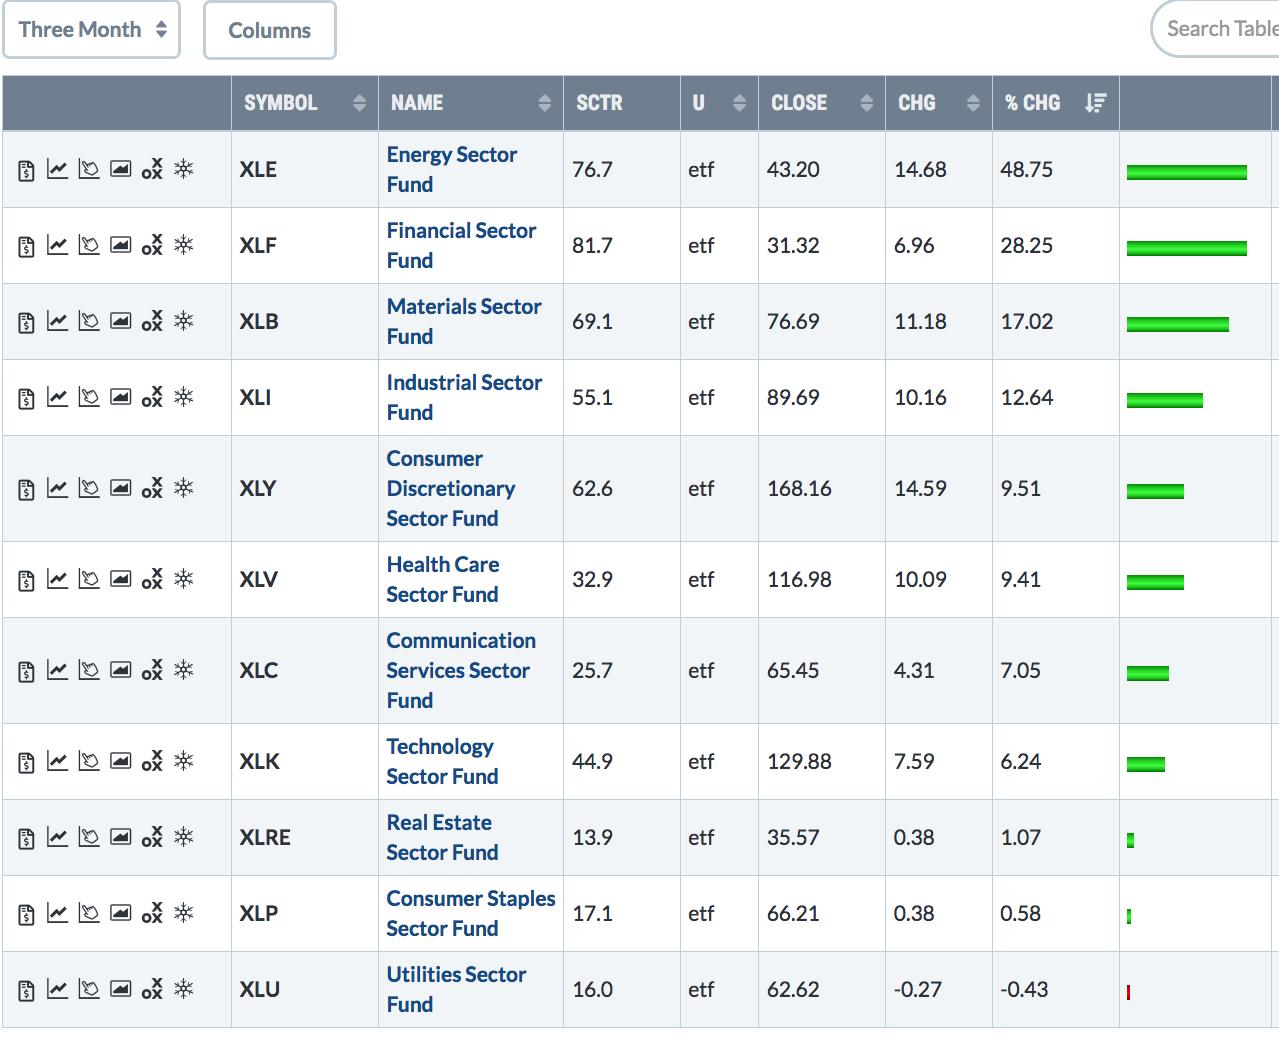
The last three months have seen rising stock prices. What's especially encouraging is which sectors have led the market higher. Chart 1 plots the sector performance over those three months. The top five sectors have been energy, financials, materials, industrials, and consumer cyclicals. All five are economically-sensitive stock...
READ MORE
MEMBERS ONLY
A THREE-MONTH LOOK AT SECTOR LEADERSHIP SHOWS MORE OPTIMISM -- RISING COMMODITY PRICES AND RISING BOND YIELDS HAVE ALSO PLAYED A ROLE
by John Murphy,
Chief Technical Analyst, StockCharts.com
ECONOMICALLY-SENSTIVE GROUPS HAVE BEEN MARKET LEADERS...The last three months have seen rising stock prices. What's especially encouraging is which sectors have led the market higher. Chart 1 plots the sector performance over those three months. The top five sectors have been energy, financials, materials, industrials, and consumer...
READ MORE
MEMBERS ONLY
ECONOMICALLY-SENSITIVE TRANSPORTS HIT NEW HIGHS -- WHILE DEFENSIVE UTILITIES LAG BEHIND -- BITCOIN REBOUNDS
by John Murphy,
Chief Technical Analyst, StockCharts.com
TRANSPORTS HIT NEW RECORD... It's usually a good sign to see more economically-sensitive groups hitting new highs, while more defensive groups are lagging behind. Two examples of that are seen by comparing the transportation stocks and utilities. Chart 1 shows the Dow Transports hitting a new record again...
READ MORE
MEMBERS ONLY
GRAIN MARKETS REACH MULTI-YEAR HIGHS -- CRB INDEX TESTS TRENDLINE RESISTANCE -- A LONGER-TERM LOOK AT COMMODITY PRICES
by John Murphy,
Chief Technical Analyst, StockCharts.com
GRAIN MARKETS ARE IN NEW UPTRENDS... Higher commodity markets are starting to attract more attention because of the potential for higher inflation. Past messages have written about new uptrends in energy markets or industrial commodities like copper. Some of the biggest gains, however, are being seen in agricultural markets, and...
READ MORE
MEMBERS ONLY
ENERGY ETFS NEAR UPSIDE BREAKOUTS -- OIH HAS ALREADY CLEARED ITS JUNE HIGH -- RISING ENERGY SHARES ARE PART OF THE REFLATION TRADE
by John Murphy,
Chief Technical Analyst, StockCharts.com
ENERGY ETFS CONTINUE CLIMBING... Energy stocks continue to show new market leadership. That leadership is reflected in two energy ETFs that may be nearing some upside breakouts, and one having already achieved one. Chart 1 shows the Energy Sector SPDR (XLE) trading at the highest level in more than six...
READ MORE
MEMBERS ONLY
BITCOIN FINALLY CORRECTS
by John Murphy,
Chief Technical Analyst, StockCharts.com
BITCOIN CORRECTS VERY OVERBOUGHT CONDITION...The rally in bitcoin over the past year has been nothing short of spectacular. The daily bars in Chart 1 show how big that gain has been. Prices have gone from $4000 in the spring to $40000 last week. It also doubled in price from...
READ MORE
MEMBERS ONLY
TEN-YEAR TREASURY YIELD EXCEEDS 1% FOR FIRST TIME SINCE MARCH -- THAT'S HELPING MAKE FINANCIALS THE DAY'S STRONGEST SECTOR -- MATERIALS AND INDUSTRIALS HIT RECORDS
by John Murphy,
Chief Technical Analyst, StockCharts.com
10-YEAR TREASURY YIELD EXCEEDS 1%... Bond yields and stocks are climbing sharply today on hopes for more stimulus spending. And the market is being led higher by more economically-sensitive stocks like financials, materials, energy, and industrials. Financials in particular are getting big boost from rising bond yields. Chart 1 shows...
READ MORE
MEMBERS ONLY
GOLD AND SILVER SURGE -- SILVER AND ITS MINERS ARE RISING FASTER -- STOCKS WEAKEN
by John Murphy,
Chief Technical Analyst, StockCharts.com
GOLD AND SILVER SURGE... A couple of recent messages described the price of gold being in a downside correction but finding support near its 200-day moving average. The most recent message showed both metals gaining more ground which suggested that their correction might be ending. Both precious metals are surging...
READ MORE
MEMBERS ONLY
A Longer Term Look at Freeport McMoran Shows a New Bull Trend
by John Murphy,
Chief Technical Analyst, StockCharts.com
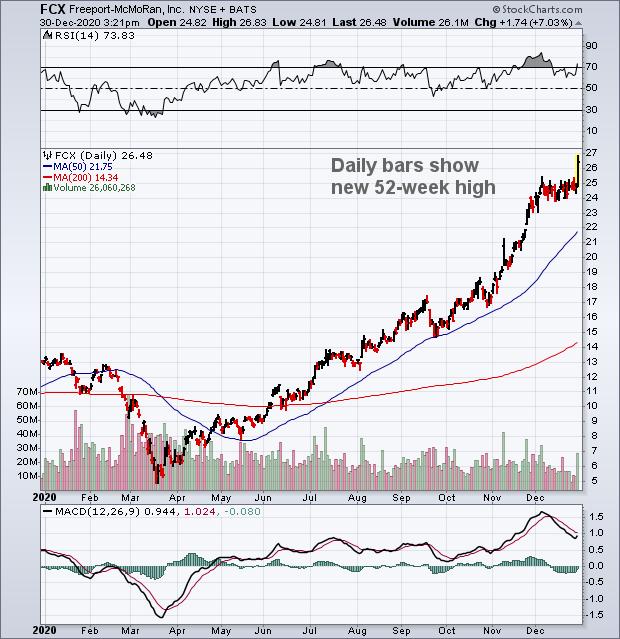
This article is about using charts in different time spans to gain a better perspective on an individual stock or any other market. I'm using copper producer Freeport McMoran (FCX) to make that point. I'm picking that stock because it's Wednesday's biggest...
READ MORE
MEMBERS ONLY
A LONGER TERM LOOK AT FREEPORT MCMORAN SHOWS A NEW BULL TREND
by John Murphy,
Chief Technical Analyst, StockCharts.com
FREEPORT MCMORAN HITS NEW 52-WEEK HIGH... This article is about using charts in different time spans to gain a better perspective on an individual stock or any other market. I'm using copper producer Freeport McMoran (FCX) to make that point. I'm picking that stock because it&...
READ MORE
MEMBERS ONLY
RUSSELL 2000 GIVES SHORT-TERM WARNING -- RSI WEAKENS -- MACD LINES TURN NEGATIVE
by John Murphy,
Chief Technical Analyst, StockCharts.com
RUSSELL 2000 ISHARES WEAKEN...Stocks are having trouble holding onto today's intra-day records. Small caps in particular are showing some new signs of weakness. The daily bars in Chart 1 show the Russell 2000 iShares (IWM) trading lower for the third day in a row. Of more concern...
READ MORE
MEMBERS ONLY
Stock Uptrend Continues
by John Murphy,
Chief Technical Analyst, StockCharts.com
Tuesday's message used hourly bar charts to show the three major stock indexes holding short-term support levels. Wednesday's daily bars show stocks continuing to stay above their green 20-day moving averages. They're usually the first line of support on market pullbacks. Ten of eleven...
READ MORE
MEMBERS ONLY
STOCK UPTREND CONTINUES -- FINANCIALS HIT NEW RECOVERY HIGH -- CORPORATE BONDS MOVE UP WITH STOCKS
by John Murphy,
Chief Technical Analyst, StockCharts.com
20-DAY AVERAGES ARE HOLDING... Yesterday's message used hourly bar charts to show the three major stock indexes holding short-term support levels. Today's daily bars show stocks continuing to stay above their green 20-day moving averages. They're usually the first line of support on market...
READ MORE
MEMBERS ONLY
STOCK INDEXES HOLD SHORT-TERM SUPPORT LEVELS -- THE QQQ IS THE STRONGEST OF THE THREE
by John Murphy,
Chief Technical Analyst, StockCharts.com
STOCK INDEXES HOLD SHORT-TERM SUPPORT... The Dow and S&P 500 have spend the past the last couple of weeks consolidating within existing uptrends. And they've managed to hold onto their existing uptrends. The hourly bars in Chart 1 show yesterday morning's pullback in the...
READ MORE
MEMBERS ONLY
GOLD ETF MOVES FURTHER ABOVE 200-DAY AVERAGE -- SILVER ETF HITS THREE-MONTH HIGH -- DEFINITION OF SANTA CLAUS RALLY
by John Murphy,
Chief Technical Analyst, StockCharts.com
PRECIOUS METALS ADVANCE... My message from December 8 wrote about gold trying to find support near its 200-day moving average. It also showed silver trying to stabilize as well. Both precious metals are having a strong day and moving above some short-term resistance levels. Chart 1 shows the Gold Shares...
READ MORE
MEMBERS ONLY
20-DAY MOVING AVERAGES ARE HOLDING FOR MAJOR STOCK INDEXES -- TECHNOLOGY SPDR NEARS TEST OF OLD HIGH -- APPLE HAS A BREAKOUT DAY
by John Murphy,
Chief Technical Analyst, StockCharts.com
STOCK INDEXES MAINTAIN UPTREND... Stocks experienced some minor profit-taking over the last week but have maintained their uptrends. All three of the major stock indexes have found support along their 20-day moving averages. Chart 1 shows the Dow Industrials bouncing off their green 20-day line. Charts 2 and 3 show...
READ MORE
MEMBERS ONLY
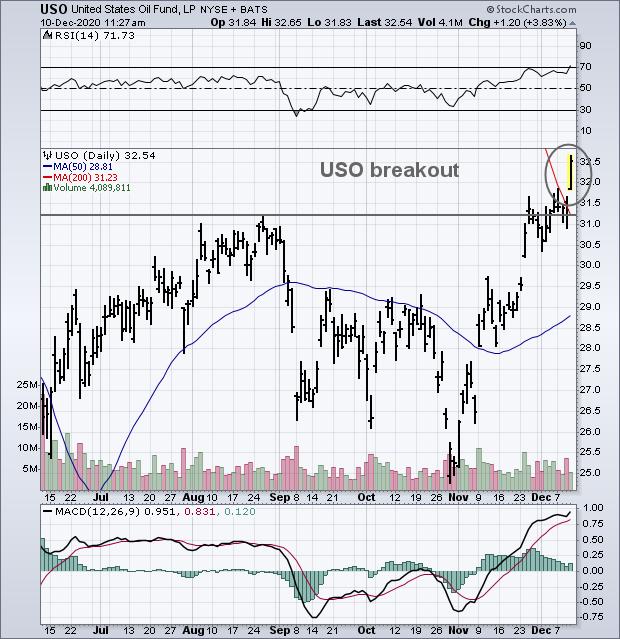
United States Oil Fund Breaks Out
by John Murphy,
Chief Technical Analyst, StockCharts.com
The price of crude oil continues to rise and is pulling energy shares along with it. Chart 1 shows the United States Oil Fund (USO) surging to the highest level in eight months after clearing its previous high formed during August. The USO has also climbed above its 200-day moving...
READ MORE
MEMBERS ONLY
TODAY'S ENERGY LEADERS INCLUDE APACHE, HESS, DEVON ENERGY, AND CHEVRON
by John Murphy,
Chief Technical Analyst, StockCharts.com
ENERGY LEADERS...This morning's message showed the price of oil breaking above its August high which helped make energy the day's strongest sector. Energy stocks are also among the day's biggest individual gainers in the overall market. Three of the individual leaders are shown...
READ MORE
MEMBERS ONLY
UNITED STATES OIL FUND BREAKS OUT -- ENERGY CONTINUES TO SHOW NEW LEADERSHIP -- ENERGY ETFS APPEAR HEADED TOWARD JUNE HIGHS
by John Murphy,
Chief Technical Analyst, StockCharts.com
UNITED STATES OIL FUND BREAKOUT... The price of crude oil continues to rise and is pulling energy shares along with it. Chart 1 shows the United States Oil Fund (USO) surging to the highest level in eight months after clearing its previous high formed during August. The USO has also...
READ MORE
MEMBERS ONLY
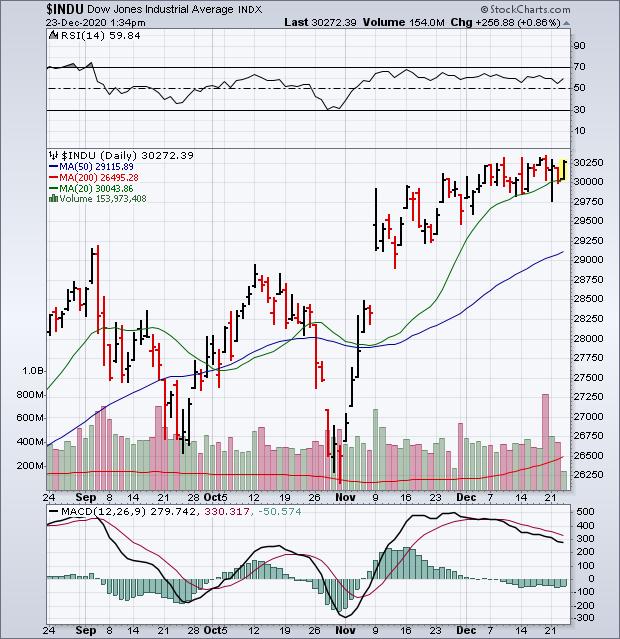
STOCK INDEXES MAY BE LOSING SOME UPSIDE MOMENTUM
by John Murphy,
Chief Technical Analyst, StockCharts.com
SHORT-TERM MOMENTUM INDICATORS START TO WEAKEN... Stocks are still in the midst of a strong run that started in early November. But they're starting to look stretched over the short run; and may be vulnerable to some profit-taking. The two upper boxes in Chart 1 show the RSI...
READ MORE
MEMBERS ONLY
GOLD AND ITS MINERS TRY TO HOLD 200-DAY LINES -- SILVER AND ITS MINERS ARE SLIGHTLY STRONGER BUT ALSO TESTING UNDERYING SUPPORT LEVELS -- RISING BOND YIELDS MAY BE HOLDING GOLD BACK
by John Murphy,
Chief Technical Analyst, StockCharts.com
GOLD SPDR TRIES TO HOLD 200-DAY LINE...Gold has been in a downside correction since the start of August. And it's now undergoing an important test. Chart 1 shows the Gold Shares SPDR (GLD) trading back above their 200-day moving average after slipping below it near the end...
READ MORE
MEMBERS ONLY
CANADIAN DOLLAR HITS TWO-YEAR HIGH -- WHILE CANADIAN ISHARES HIT NEW RECORD -- RISING CURRENCY FAVORS CANADA ISHARES
by John Murphy,
Chief Technical Analyst, StockCharts.com
CANADIAN DOLLAR HITS TWO-YEAR HIGH...With the U.S. dollar falling to the lowest level in more than two years, foreign currencies are rising. One of them is the Canadian Dollar. The weekly bars in Chart 1 show the $CDW rising to the highest level in two years. Since Canada...
READ MORE
MEMBERS ONLY
FALLING DOLLAR IS BOOSTING COMMODITY PRICES -- MOST COMMODITY GROUPS ARE RISING -- COPPER HITS SEVEN YEAR HIGH -- WHILE GOLD RETREATS
by John Murphy,
Chief Technical Analyst, StockCharts.com
FALLING DOLLAR BOOSTS COMMODITY PRICES...One of the side-effects of a falling dollar is usually rising commodity prices. That's partly because global commodities are priced in dollars. And our first chart reflects their inverse relationship. Chart 1 shows the Invesco DB Commodity Index (DBC) in a rising trend...
READ MORE
MEMBERS ONLY
TEN-YEAR TREASURY YIELD NEAR 1% MARK... STOCK INDEXES ARE HITTING NEW RECORDS -- FINANCIAL SPDR HITS NEW RECOVERY HIGH
by John Murphy,
Chief Technical Analyst, StockCharts.com
TEN-YEAR TREASURY YIELD NEARS 1%... Treasury bond yields continue to climb and are hitting new recovery highs. Chart 1 shows the 10-Year Treasury Yield trading rising 5 basis points today to .96%. It also touched the highest level since March. That's obviously bad for Treasury bond prices which...
READ MORE
MEMBERS ONLY
AIRLINE ETF TURNS UP -- AIRLINE LEADERS ARE DELTA, ALASKA AIR, AND SOUTHWEST -- BOEING HAS A BREAKOUT DAY
by John Murphy,
Chief Technical Analyst, StockCharts.com
AIRLINE ETF CLEARS JUNE HIGH... Airline stocks continue to gain more altitude and show stronger chart patterns. Chart 1 shows the US Global Jets ETF (JETS) surging to the highest level since the spring. The upper box shows its relative strength ratio rising to the highest level since June. A...
READ MORE
MEMBERS ONLY
NASDAQ 100 HITS NEW RECORD -- A NUMBER OF ITS LARGEST STOCKS ARE IN CONSOLIDATION PATTERNS -- APPLE HITS SEVEN-WEEK HIGH -- MICROSFT, AMAZON, AND FACEBOOK MAY BE IN TRIANGULAR FORMATIONS
by John Murphy,
Chief Technical Analyst, StockCharts.com
NASDAQ 100 HITS NEW RECORD...With the Dow and S&P 500 reaching new records, the tech-dominated Nasdaq market has been lagging behind. Not anymore. Chart 1 shows the Invesco QQQ Trust trading in record territory today. It's also the strongest of the major U.S. stock...
READ MORE