MEMBERS ONLY
S&P 500 HAS REACHED FIRST UPSIDE TARGET BUT SHOULD REACH HIGHER LEVELS DURING FOURTH QUARTER -- DISCRETIONARY AND TECHNOLOGY LEADERSHIP IS POSITIVE SIGN -- REGIONAL BANKS LOOK BETTER -- % OF NYSE ABOVE 50-DAY AVERAGES IS CLIMBING
by John Murphy,
Chief Technical Analyst, StockCharts.com
S&P 500 HAS REACHED TOP OF WAVE FOUR ... Two Thursdays ago (October 6) I suggested that the S&P 500 had completed a five-wave decline which should lead to a fourth quarter rebound. I also suggested that the rebound would reach the top of wave 4 which...
READ MORE
MEMBERS ONLY
DOW INDUSTRIALS AND TRANSPORTS TURN BACK AT RESISTANCE -- WELLS FARGO WEIGHS ON THE FINANCE SPDR -- DOLLAR ETF BOUNCES NEAR BROKEN RESISTANCE -- GOLD FOLLOWS DOLLAR LOWER -- SILVER ETF STALLS AT RESISTANCE
by John Murphy,
Chief Technical Analyst, StockCharts.com
DOW INDUSTRIALS AND TRANSPORTS TURN BACK AT RESISTANCE... Link for todays video. Stocks moved lower on Monday with a broad decline hitting all sectors. Financial media blamed the decline on comments from German Chancellor Merkel, who poured cold water on the prospects for a comprehensive solution to European debt issues....
READ MORE
MEMBERS ONLY
INTERMARKET TRENDS CONFIRM CHART SIGNALS
by John Murphy,
Chief Technical Analyst, StockCharts.com
Last Thursday I showed some traditional charts that suggested stocks and commodities were due for a rally. In the case of stocks, a lot of global stock and U.S. stock indexes had reached important support at their mid-2010 lows and were in oversold territory. In addition, I suggested that...
READ MORE
MEMBERS ONLY
SPY CHALLENGES RESISTANCE AGAIN -- S&P 500 EQUAL WEIGHT ETF STILL SHOWS RELATIVE WEAKNESS -- ELLIOTT WAVE SUGGESTS AN ABC CORRECTION IN PROGRESS -- TECHNOLOGY, CONSUMER DISCRETIONARY AND UTILITIES LEAD -- TREASURIES EXTEND DECLINE AFTER RETAIL SALES JUMP
by John Murphy,
Chief Technical Analyst, StockCharts.com
SPY CHALLENGES RESISTANCE AGAIN... Link for todays video. Chart 1 shows the S&P 500 ETF (SPY) moving back above 121 in early trading on Friday and once again challenging resistance. Resistance here stems from broken support and the prior peaks in late August and mid September. So far,...
READ MORE
MEMBERS ONLY
1000 POINT SURGE PUTS DOW AT RESISTANCE ZONE -- EURO RETRACES 50% OF SEPTEMBER DECLINE -- LEARNING FROM PRIOR REVERSALS AND FAILURES -- 2010 INVERSE HEAD-AND-SHOULDERS BOTTOM -- 2008 DOUBLE BOTTOM AND RISING WEDGE
by John Murphy,
Chief Technical Analyst, StockCharts.com
1000 POINT SURGE PUTS DOW AT RESISTANCE ZONE... Link for todays video. The risk-on trade continued its run as stocks moved higher again on Wednesday. Traders move into riskier assets with the risk-on trade and shun riskier assets with the risk-off trade. Risk-on favors stocks, the Euro and commodities. Risk-off...
READ MORE
MEMBERS ONLY
FALLING DOLLAR BOOSTS STOCKS AND COMMODITIES -- BOND PRICES DROP AS YIELDS JUMP -- IT'S ALWAYS BETTER WHEN INTERMARKET INFLUENCES CONFIRM INDIVIDUAL CHART ANALYSIS
by John Murphy,
Chief Technical Analyst, StockCharts.com
INTERMARKET TRENDS CONFIRM CHART SIGNALS... Last Thursday I showed some traditional charts that suggested stocks and commodities were due for a rally. In the case of stocks, a lot of global stock and U.S. stock indexes had reached important support at their mid-2010 lows and were in oversold territory....
READ MORE
MEMBERS ONLY
IWM VOLATILITY REMAINS HIGH AS RESISTANCE ZONE NEARS -- SEMICONDUCTOR HOLDRS CHALLENGES SEPTEMBER HIGH -- BROKEN RESISTANCE MARKS NEXT SUPPORT ZONE FOR DOLLAR -- EURO SURGES AS LATEST PLEDGE IS ANNOUNCED -- GOLD ETF CHALLENGES CONSOLIDATION RESISTANCE
by John Murphy,
Chief Technical Analyst, StockCharts.com
IWM VOLATILITY REMAINS HIGH AS RESISTANCE ZONE NEARS... Link for todays video. The Russell 2000 ETF (IWM) is up over 10% in the last five trading days. While this is certainly a strong move, it is still within the realm of the new normal in volatility. Chart 1 shows IWM...
READ MORE
MEMBERS ONLY
DOW SPDR HEADS FOR BIG TEST -- RETAIL SPDR SURGES TOWARDS RESISTANCE -- TREASURIES GET HAMMERED AFTER EMPLOYMENT REPORT -- OIL BOUNCES AS BONDS RETREAT -- OIL SERVICES HOLDRS CONTINUES TO UNDERPERFORM OIL
by John Murphy,
Chief Technical Analyst, StockCharts.com
DOW SPDR HEADS FOR BIG RESISTANCE TEST... Link for todays video. Point & Figure charts are good for defining key support and resistance levels. In addition, P&F charts at StockCharts.com come with automatic trendlines that can be used to define the trend. Chart 1 shows a 1/...
READ MORE
MEMBERS ONLY
A LOT OF MARKETS ARE TESTING IMPORTANT SUPPORT LEVELS AT THEIR 2010 LOWS -- THAT WOULD BE A LOGICAL SPOT FOR OVERSOLD MARKETS TO ATTEMPT A RALLY -- THE MARKET ALSO APPEARS TO HAVE COMPLETED A FIVE-WAVE DECLINE WHICH COULD LEAD TO A FOURTH QUARTER REBOUND
by John Murphy,
Chief Technical Analyst, StockCharts.com
FOREIGN ETFS TESTING 2010 LOWS ... What started off as a potentially bearish week may be turning into something more positive. A large part of the reason for that is the ability of so many global markets to find support at their mid-2010 lows. Given the steepness of the recent declines...
READ MORE
MEMBERS ONLY
RISING FLAG BREAKDOWN REMAINS FOR SPY -- A POSSIBLE FALLING WEDGE AND A DEFINITIVE DOWNTREND -- NASDAQ RECOVERS AFTER BREAK BELOW AUGUST LOWS -- DELL, INTEL AND MICROSOFT LIFT NASDAQ -- NETWORKING ETF HOLDS AUGUST LOW WITH BULLISH ENGULFING
by John Murphy,
Chief Technical Analyst, StockCharts.com
RISING FLAG BREAKDOWN REMAINS FOR SPY... Link for todays video. Stocks staged one heck of a come back in the final hour of trading on Tuesday. Actually, the rally was even shorter than that as the surge started around 3:10PM and carried on to the 4PM close. Despite this...
READ MORE
MEMBERS ONLY
LATE BOUNCE PREVENTS BREAKDOWNS NEAR 2010 LOWS -- SMALL CAPS AND TRANSPORTS LEAD AFTERNOON RALLY ON STRONG VOLUME -- UPSIDE REVERSAL DAY KEEPS QQQ OVER AUGUST LOW -- FIVE-WAVE DECLINES OFTEN LEAD TO RALLY ATTEMPTS
by John Murphy,
Chief Technical Analyst, StockCharts.com
UPSIDE REVERSAL ON RISING VOLUME... This morning's message showed a number of foreign and U.S. stock indexes testing important support at their mid-2010 lows. Some foreign ETFS (like the EEM and EWG) were actually trading below those levels. By late afternoon, however, upside reversals prevented those breakdowns...
READ MORE
MEMBERS ONLY
SMALL-CAPS LEAD STOCKS LOWER AGAIN -- DOWNSIDE TARGET FOR SPY IS AROUND 100 -- WEAKNESS IN RETAILERS PUSHES XLY BELOW SEPTEMBER LOWS -- JUNK BONDS PLUNGE AS TREASURIES SURGE -- DOLLAR EXTENDS SURGE AS EURO PLUNGES
by John Murphy,
Chief Technical Analyst, StockCharts.com
SMALL-CAPS LEAD STOCKS LOWER AGAIN... Link for todays video. Stocks moved broadly lower on Monday with small-caps leading the way. All major index ETFs were down 2% or more. Eight of the nine sector SPDRs were down 2% or more. Only the Consumer Staples SPDR (XLP) was down less. Chart...
READ MORE
MEMBERS ONLY
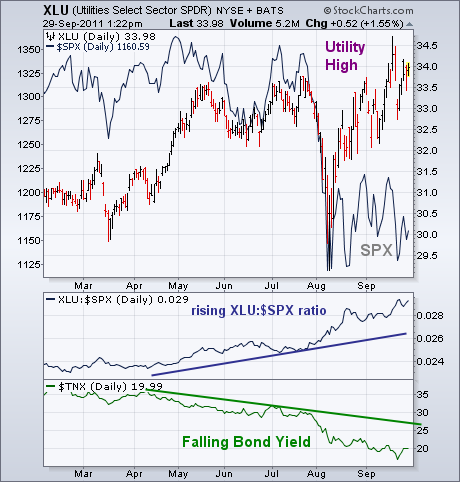
UTILITIES THRIVE ON FALLING RATES AND RISING VIX
by John Murphy,
Chief Technical Analyst, StockCharts.com
Utilities have emerged as the year's strongest sector. The chart below shows the Utilities Sector SPDR (XLU) trading near a new 52-week high while the S&P 500 (solid line) is closer to a new lows. The rising XLU:SPX relative strength ratio (below chart) also shows...
READ MORE
MEMBERS ONLY
STOCKS SHOW LOTS OF MOVEMENT AND NO REAL CHANGE -- DECLINE IN ADX REFLECTS LACK OF TREND IN SPY -- XLK AND XLY FAIL AT KEY RETRACEMENTS -- RETAILERS HOLD THE KEY TO XLY -- NYSE AD VOLUME LINE BREAKS AUGUST LOW
by John Murphy,
Chief Technical Analyst, StockCharts.com
STOCKS SHOW LOTS OF MOVEMENT AND NO REAL CHANGE... Link for todays video. It is clear that the short-term trend is being influenced by news, hope and fear, all of which are four letter words. Chart 1 shows the S&P 500 ETF (SPY) since August 8th. The Zigzag...
READ MORE
MEMBERS ONLY
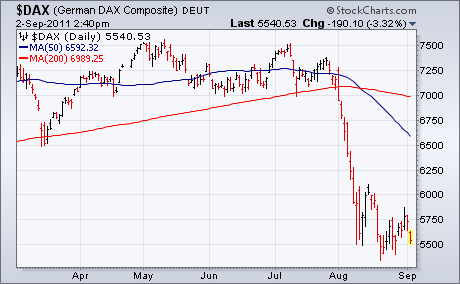
OVERSOLD GERMAN STOCKS ARE TRYING TO STABILIZE -- GERMAN ISHARES ARE ALSO TESTING SUPPORT AT THEIR 2010 LOWS -- FOREIGN ETFS INCORPORATE DOLLAR TRENDS AND, IN MY VIEW, ARE BETTER TO CHART -- NASDAQ COMPOSITE STALLS AT 2600 RESISTANCE
by John Murphy,
Chief Technical Analyst, StockCharts.com
GERMAN DAX STABILIZES NEAR LONG-TERM SUPPORT ... A couple of Thursdays ago (September 15), I included in my market message a story about the German DAX Index trying to bounce from oversold territory after having reached a potential support level. The weekly bars in Chart 1 show that's still...
READ MORE
MEMBERS ONLY
SMALL AND MID-CAPS LEAD STOCKS LOWER -- OIL ETF PLUNGES AS BASE METALS ETF HITS NEW LOW -- USING HEIKIN-ASHI CANDLESTICKS TO REDUCE VOLATILITY -- SPY FORMS TRIANGLE ON WEEKLY HEIKIN-ASHI CHART -- WHEN DOES A RISING FLAG BECOME SOMETHING MORE
by John Murphy,
Chief Technical Analyst, StockCharts.com
SMALL AND MID-CAPS LEAD STOCKS LOWER... Link for todays video. Stocks moved lower on Wednesday with small-caps leading the way. Before looking at the charts, just a note on the current Euro-Greek hysteria. It all boils down to the economy. If the US economy were strong and growing, the European...
READ MORE
MEMBERS ONLY
GOLD ENTERS ITS FIFTH CORRECTION SINCE 2006 -- GLD NEARS MAJOR SUPPORT ZONE WITH FREEFALL -- SILVER FOLLOWS GOLD WITH BREAK BELOW MAY-JUNE LOWS -- DOLLAR EXTENDS AFTER DOUBLE BOTTOM BREAKOUT -- OIL LEADS THE STOCK MARKET LOWER
by John Murphy,
Chief Technical Analyst, StockCharts.com
GOLD IS IN ITS FIFTH CORRECTION SINCE 2006... Link for todays video. Despite a sharp decline the last two weeks, the Gold SPDR (GLD) remains in a long-term uptrend. Chart 1 shows daily closing prices for Spot Gold ($GOLD) over the last six years. The Zigzag indicator is overlaid and...
READ MORE
MEMBERS ONLY
ELLIOTT WAVE COUNTS SHOW FIFTH WAVE STARTING -- PRICE CHANNEL PROJECTION FOR SPX -- MEASURING DOWNSIDE TARGETS FOR BEAR FLAGS -- TRANSPORT AVERAGE BREAKS AUGUST LOWS -- FEDEX AND UPS BREAK SUPPORTS AND SHOW RELATIVE WEAKNESS
by John Murphy,
Chief Technical Analyst, StockCharts.com
ELLIOTT WAVE COUNTS SHOW FIFTH WAVE STARTING... Link for todays video. The Elliott Wave picture shows the S&P 500 in Wave-5 of a five-wave decline (red numbers). Chart 1 shows the S&P 500 peaking in the spring as it hit the fifth (green 5) of the...
READ MORE
MEMBERS ONLY
FOREIGN STOCKS ARE ALREADY IN BEAR MARKET TERRITORY WITH THE US HEADING IN THE SAME DIRECTION -- SURGING DOLLAR PUSHES COMMODITIES SHARPLY LOWER -- CHINESE STOCK MARKET HAS ALREADY LOST 30% AND WARNED OF GLOBAL WEAKNESS
by John Murphy,
Chief Technical Analyst, StockCharts.com
GLOBAL BEAR PULLS US MARKET LOWER... One of the basic elements of intermarket analysis is the close linkage among global stock markets. In other words, they rise and fall together. Right now, they're falling. A bad sign for the U.S. market is that foreign markets are falling...
READ MORE
MEMBERS ONLY
YIELDS PLUNGE AND TREASURIES SOAR ON THE FED TWIST -- SMALL-CAPS SHOW RELATIVE WEAKNESS -- STOCKS SELL OFF SHARPLY AFTER FED -- IWM BREAKS NECKLINE SUPPORT ON INTRADAY CHART -- FINANCE, MATERIALS AND ENERGY SPDRS BREAK TRIANGLES
by John Murphy,
Chief Technical Analyst, StockCharts.com
YIELDS PLUNGE AND TREASURIES SOAR ON THE FED TWIST ... Link for todays video. The Fed made Operation Twist official today. As the name implies, the goal of this program is to twist the yield curve by buying 6-30 Year Treasuries and selling Treasuries with maturities of three years or less....
READ MORE
MEMBERS ONLY
STOCK INDEXES STALL AT RESISTANCE BARRIERS -- SECTOR ROTATION REFLECTS PESSIMISM -- NEWMONT JUMPS TO RECORD ON RISING GOLD WHILE FCX PLUNGES ALONG WITH COPPER -- CELGENE AND BRISTOL MYERS SQUIBB LEAD HEALTHCARE RALLY -- VIX BOUNCES OFF CHART SUPPORT
by John Murphy,
Chief Technical Analyst, StockCharts.com
S&P 500 STALLS AT 50-DAY LINE ... Today's modest rally stalled at some important resistance barriers. Chart 1 shows the S&P 500 backing off from its 50-day moving average and its late August high. Chart 2 shows the Nasdaq Composite closing just below chart resistance...
READ MORE
MEMBERS ONLY
SPY FORMS BEARISH CONTINUATION PATTERN ON WEEKLY CHART -- SPY GAPS DOWN WITHIN FLAG -- FINANCE SECTOR LEADS THE MARKET LOWER AGAIN -- OIL LEADS COMMODITIES LOWER -- INDUSTRIALS METALS ETF BREAKS AUGUST LOW -- GOLD AND SILVER SUCCUMB TO SELLING PRESSURE
by John Murphy,
Chief Technical Analyst, StockCharts.com
SPY FORMS BEARISH CONTINUATION PATTERN ON WEEKLY CHART... Link for todays video. There can be different trends in different timeframes. A three year weekly chart can show an emerging downtrend, but a three month daily chart can show an uptrend. Moreover, there can, and are, counter-trend rallies within bear markets....
READ MORE
MEMBERS ONLY
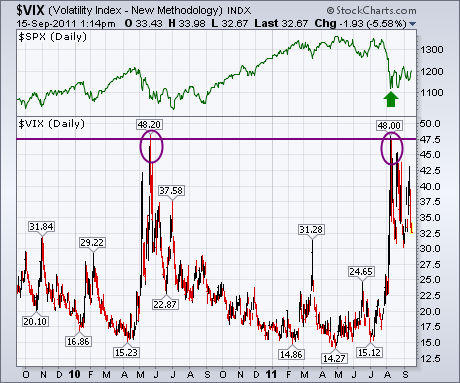
VIX STALLS AT PREVIOUS RESISTANCE LEVEL
by John Murphy,
Chief Technical Analyst, StockCharts.com
Two Thursdays ago (September 1) I wrote about the CBOE Volatility (VIX) having reached previous resistance formed during the spring of 2010 near 48. The chart below shows that the VIX has backed off from that overhead barrier which has helped stabilize the stock market (green arrow). In fact, the...
READ MORE
MEMBERS ONLY
CONSUMER DISCRETIONARY SPDR RUNS INTO RESISTANCE -- NASDAQ AD LINE HITS NEW LOW AS NYSE AD LINE BOUNCES -- BIG TECHS LIFT NASDAQ AD VOLUME LINE -- BANKS WEIGH ON NYSE AD VOLUME LINE -- CUMULATIVE NET NEW HIGHS LINES REMAIN WEAK
by John Murphy,
Chief Technical Analyst, StockCharts.com
CONSUMER DISCRETIONARY SPDR RUNS INTO RESISTANCE... The Consumer Discretionary SPDR (XLY) is a bit of a conundrum right now. Chart 1 shows the ETF moving into bear mode with a break below the June lows in August. After this decline, the ETF formed a rising flag over the last 5-6...
READ MORE
MEMBERS ONLY
VIX IS TESTING BOTTOM END OF SHORT-TERM TRADING RANGE --RISING VOLATILITY IS GOOD FOR DEFENSIVE STOCKS -- NASDAQ RETESTS BROKEN SUPPORT NEAR 2600 -- GERMAN DAX IS BOUNCING FROM OVERSOLD CONDITION BUT REMAINS IN BEAR MARKET
by John Murphy,
Chief Technical Analyst, StockCharts.com
VIX STALLS AT PREVIOUS RESISTANCE LEVEL ... Two Thursdays ago (September 1) I wrote about the CBOE Volatility (VIX) having reached previous resistance formed during the spring of 2010 near 48. Chart 1 shows that the VIX has backed off from that overhead barrier which has helped stabilize the stock market...
READ MORE
MEMBERS ONLY
LARGE-CAP TECH STOCKS LEAD MARKET HIGHER -- QQQ ESTABLISHES KEY SUPPORT WITH 3-DAY SURGE -- APPLE, MICROSOFT AND ORACLE SURGE -- RETAILERS SHRUG OFF DISAPPOINTING RETAIL SALES REPORT -- OIL ETF HITS RESISTANCE AS BASE METALS ETF TESTS SUPPORT
by John Murphy,
Chief Technical Analyst, StockCharts.com
LARGE-CAP TECH STOCKS LEAD MARKET HIGHER... Link for todays video. The bulls refuse to buckle as stocks moved higher for the third day running. Overall, large-cap tech stocks have been leading the market since the August 19th low. Chips were particularly strong on Monday with the Semiconductor HOLDRS (SMH) surging...
READ MORE
MEMBERS ONLY
NASDAQ UNDERPERFORMS NASDAQ 100 IN RISK-OFF ENVIRONMENT -- SEMICONDUCTOR HOLDRS FORMS DESCENDING TRIANGLE -- INTEL FAILS AT RESISTANCE AS NVDA FORMS FALLING FLAG -- SILVER ETF TESTS TRIANGLE SUPPORT
by John Murphy,
Chief Technical Analyst, StockCharts.com
NASDAQ UNDERPERFORMS NASDAQ 100 IN RISK-OFF ENVIRONMENT... Link for todays video. There are a number of ways to measure the appetite for risk in the stock market. In particular, chartists can use ratio charts to compare the performance of two different indices or ETFs. Chartists first need to choose the...
READ MORE
MEMBERS ONLY
RECENT MARKET TRENDS FOLLOW "NEW NORMAL" INTERMARKET SCRIPT VERY CLOSELY -- BOND YIELDS AND CRUDE OIL PRICES HAVE LED STOCKS LOWER SINCE THE SPRING -- RISING DOLLAR PUSHED STOCKS SHARPLY LOWER THIS WEEK AS EURO PLUNGES
by John Murphy,
Chief Technical Analyst, StockCharts.com
NEW NORMAL IN INTERMARKET RELATIONSHIPS ... Back on April 5, I wrote a Market Message explaining the "new normal" in intermarket relationships. I did that to highlight two changes that had taken place over the past decade owing primarily to deflationary pressures not seen since the Great Depression of...
READ MORE
MEMBERS ONLY
SPY STARTS WAVE 3 OF 5 DOWN -- GOLD HITS UPPER TRENDLINE OF RISING CHANNEL -- OIL AND STOCKS MAINTAIN POSITIVE CORRELATION -- XLE AND OIH CONSOLIDATE AFTER BREAKDOWNS -- DOLLAR CHALLENGES MAY HIGHS AS EURO CRUMBLES
by John Murphy,
Chief Technical Analyst, StockCharts.com
SPY STARTS WAVE 3 OF 5 DOWN... Link for todays video. The zigzag higher since early August looks like an ABC correction that ended Wave-4 in the S&P 500 ETF (SPY). Chart 1 shows SPY with the 5% Zigzag indicator. This is not an indicator per se. It...
READ MORE
MEMBERS ONLY
MARKET VECTORS GOLD MINING INDEX HITS NEW HIGH -- RECENT GOLD BREAKOUTS INCLUDE NEWMONT MINING AND ELDORADO GOLD -- BARRICK MAY BE NEXT -- CORRELATION COEFFICIENT SHOWED GOLD STOCKS REL-LINKING WITH GOLD DURING JULY
by John Murphy,
Chief Technical Analyst, StockCharts.com
GOLD MINERS INDEX HITS NEW HIGH... My Market Message last Friday morning showed the Market Vectors Gold Miners ETF (GDX) on the verge of a bullish breakout to a new record high. Chart 1 shows that bullish breakout taking place this week (see circle). And this has happened while gold...
READ MORE
MEMBERS ONLY
IWM AND SPY FORM RISING FLAG PATTERNS -- FINANCE SECTOR AND REGIONAL BANKS LEAD MARKET REBOUND -- UTILITIES SECTOR REMAINS THE STRONGEST SECTOR OVERALL -- PERCENT OF STOCKS ABOVE 200-DAY HITS BEAR MARKET TERRITORY
by John Murphy,
Chief Technical Analyst, StockCharts.com
IWM AND SPY FORM RISING FLAG PATTERNS ... Link for todays video. Price action remains quite choppy for stocks over the last five weeks. In particular, the Russell 2000 ETF (IWM) has had five swings of at least 5% in the last five weeks. These swings, which were based on closing...
READ MORE
MEMBERS ONLY
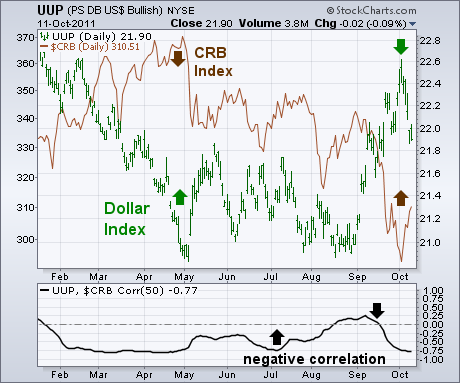
US DOLLAR SURGES AGAINST ALL CURRENCIES -- THAT'S USUALLY BAD FOR STOCKS AND COMMODITIES WHICH TREND IN THE OPPOSITE DIRECTION OF THE DOLLAR -- S&P 500 BOUNCES OFF SHORT-TERM SUPPORT LINE BUT REMAINS IN DOWNTREND
by John Murphy,
Chief Technical Analyst, StockCharts.com
US DOLLAR INDEXES SURGES TO SIX-WEEK HIGH ... Besides today's selling in stocks, the most notable feature of the day's trading was the 1.74% surge in the U.S. Dollar Index. Chart 1 shows the Bullish Dollar ETF (UUP) surging to the highest level since mid-July...
READ MORE
MEMBERS ONLY
NEW LOW IN GERMAN DAX AND 10-YEAR TREASURY YIELD POINT TO BAD MARKET DAY AHEAD -- US FUTURES EXPECTED TO OPEN SHARPLY LOWER -- NASDAQ FAILS TEST OF MAJOR RESISTANCE AT 2600 AND FORMS BEARISH "ISLAND REVERSAL" PATTERN -- SEPTEMBER IS USUALLY A WEAK MONTH
by John Murphy,
Chief Technical Analyst, StockCharts.com
DAX AND BOND YIELDS HIT NEW LOWS... European stocks fell sharply on Monday (while U.S. markets were closed) and are weak again today. Chart 1 shows the German DAX Composite, which is largest market in Europe, falling to another 52-week low. Given its strong correlation to the U.S....
READ MORE
MEMBERS ONLY
EUROPEAN RALLY PROBABLY OVER
by John Murphy,
Chief Technical Analyst, StockCharts.com
EUROPEAN STOCKS FALL ... This morning's weak employment report is having a negative impact on global stock markets. European stocks are down 3%. Chart 1 shows the German DAXto be the weakest of the three after having achieved a feeble rally over the last month. Chart 2 shows the...
READ MORE
MEMBERS ONLY
DIA FORMS ISLAND REVERSAL WITHIN BEAR WEDGE -- IWM RETRACES LESS THAN DIA ON OVERSOLD BOUNCE -- 2010 LOWS MARK NEXT BIG SUPPORT ZONE -- OIL HITS RESISTANCE WITHIN A DOWNTREND -- EURO TRUST FORGES OUTSIDE REVERSAL WEEK
by John Murphy,
Chief Technical Analyst, StockCharts.com
DIA FORMS ISLAND REVERSAL WITHIN BEARISH WEDGE... Link for todays video. Chart 1 shows that classic technical analysis is alive and well for the Dow Industrials SPDR (DIA). First, the ETF formed a Double Top and confirmed this pattern with a break below the intermittent low. A major bearish reversal...
READ MORE
MEMBERS ONLY
WEAK PAYROLL NUMBERS PUSH GLOBAL STOCKS LOWER AND BONDS HIGHER -- IT NOW LOOKS LIKE SUMMER BOUNCE HAS ENDED -- GOLD MINERS INDEX COULD ACHIEVE BULLISH BREAKOUT ON RISING GOLD AND SILVER PRICES
by John Murphy,
Chief Technical Analyst, StockCharts.com
EUROPEAN STOCKS FALL ... This morning's weak employment report is having a negative impact on global stock markets. European stocks are down 3%. Chart 1 shows the German DAX to be the weakest of the three after having achieved a feeble rally over the last month. Chart 2 shows...
READ MORE
MEMBERS ONLY
TWO FUNDS OFFER WAYS TO PARTICIPATE IN RISING AGRICULTURAL COMMODITIES -- IPATH GRAIN ETN OFFERS EXPOSURE TO CORN, SOYBEANS, AND WHEAT -- COFFEE AND SUGAR ETNS OFFER ENTRY INTO THOSE TWO RISING MARKETS
by John Murphy,
Chief Technical Analyst, StockCharts.com
AGRICUTURAL MARKETS SHOW COMMODITY STRENGTH ... With all of the recent focus on the trend of commodities like gold and oil, it shouldn't go unnoticed that agricultural commodities turned up sharply during August. Perhaps the best known vehicle for trading that commodity sector is the Power Shares DB Agricultural...
READ MORE
MEMBERS ONLY
SPX BREAKS BELOW 12-MONTH MOVING AVERAGE -- AUGUST MARKS 4TH CONSECUTIVE MONTHLY DECLINE -- EXCESSIVELY LOW SHORT-TERM YIELDS REFLECT UNCERTAINTY -- FALLING 10-YEAR YIELD IS BEARISH FOR STOCKS -- STEEPENING YIELD CURVE POINTS TO QE3
by John Murphy,
Chief Technical Analyst, StockCharts.com
SPX BREAKS BELOW 12-MONTH MOVING AVERAGE... Link for todays video. Long-term signals require long-term charts. Chart 1 shows monthly bars for the S&P 500 and the 12-period simple moving average. Over the last 17 years, there were five good crosses (signals) and at least two whipsaws (blue ovals)...
READ MORE
MEMBERS ONLY
BANKS AND HOMEBUILDERS ARE CLOSELY LINKED -- AND BOTH ARE WEIGHING ON THE REST OF THE MARKET -- HOMEBUILDERS BOUNCE BUT REMAIN IN MAJOR DOWNTRENDS -- NEWMONT MINING AND ROYAL GOLD ARE DAY'S GOLD LEADERS
by John Murphy,
Chief Technical Analyst, StockCharts.com
BANKS AND HOUSING ARE LINKED ... Since banks and homebuilders have been the weakest parts of the market, I decided to take a closer look at how closely they're linked. The answer is "very". Chart 1 compares the PHLX Housing Index (bars) to the PHLX Banking Index...
READ MORE
MEMBERS ONLY
SMALL AND MID-CAPS LEAD STOCKS HIGHER -- REGIONAL BANK SPDR SURGES HIGHER -- RETAIL SPDR BREAKS MID AUGUST HIGH -- HOMEBUILDERS SPDR ADVANCES 5-DAYS STRAIGHT -- PERCENT OF SPX STOCKS ABOVE 50-DAY BREAKS 10%
by John Murphy,
Chief Technical Analyst, StockCharts.com
SMALL AND MID-CAPS LEAD STOCKS HIGHER... Link for todays video. Stocks extended last weeks rally with strong gains on Monday. The appetite for risk reappeared as small-caps and mid-caps led the way higher. Chart 1 shows the Russell 2000 ETF (IWM) advancing over 4% with a surge above 72 today....
READ MORE