MEMBERS ONLY
SPY FORMS TRIANGLE WITHIN DOWNTREND -- AUGUST 2010 LOWS MARK NEXT SUPPORT -- LARGE TECHS SPRING TO LIFE WITH QQQ LEADING -- NETWORKING AND SEMIS LEAD TECHS HIGHER -- PROVING A BEARISH REVERSAL OTHERWISE
by John Murphy,
Chief Technical Analyst, StockCharts.com
SPY FORMS TRIANGLE WITHIN DOWNTREND... Link for todays video. After sharp declines in late July and early August, stocks have been moving sideways the last 3-4 weeks. This is pretty normal because stocks were quite oversold on August 8th, which is when the S&P 500 ETF (SPY) first...
READ MORE
MEMBERS ONLY
GOLD STOCKS FAIL TO REACH NEW HIGH -- THIS IS THE FOURTH TIME THIS HAS HAPPENED IN THE LAST DECADE AND USUALLY LEADS TO A GOLD PULLBACK -- GOLD SHARES UNDERPERFORM BULLION BUT OUTPERFORM STOCKS
by John Murphy,
Chief Technical Analyst, StockCharts.com
GOLD MINERS FAIL TEST OF HIGHS... On Tuesday I showed the Market Vectors Gold Miners ETF (GDX) hitting a new four-month high which set up a test of its late 2010 and spring 2011 peaks. Chart 1 shows that test of prior resistance at 64 failed this week as miners...
READ MORE
MEMBERS ONLY
SMALL-CAPS LEAD LATE SURGE, BUT BIG TECHS LAG -- STOCKS AND TREASURIES MAINTAIN NEGATIVE CORRELATION -- 7-10 YEAR BOND ETF CORRECTS AFTER FIFTH OF THE FIFTH -- CHANNEL TRENDLINE MARKS LONG-TERM SUPPORT FOR GOLD
by John Murphy,
Chief Technical Analyst, StockCharts.com
SMALL-CAPS LEAD LATE SURGE, BUT TECHS SHOW RELATIVE WEAKNESS... Link for todays video. Small-caps led a ninth inning surge as the stock market rallied for a strong close. Chart 1 shows the Russell 2000 ETF (IWM) advancing around 1.5% on the day. The two day advance is certainly impressive...
READ MORE
MEMBERS ONLY
MARKET VECTORS GOLD MINERS ETF CLEARS SUMMER HIGH -- A LOT OF GOLD MINERS HIT 52-WEEK HIGHS -- TWO RECENT BREAKOUTS INCLUDE BARRICK AND NEWMONT -- SILVER BREAKOUT BOOSTS SILVER SHARES -- SILVER WHEATON IS GROUP LEADER
by John Murphy,
Chief Technical Analyst, StockCharts.com
GDX HITS NEARS 2011 HIGH... Chart 1 shows the Market Vectors Gold Miners Index (GDX) surging 4% yesterday through its July high on rising volume. That puts the GDX in position to challenge its previous highs near 64 formed late last year and this April. The rising relative strength line...
READ MORE
MEMBERS ONLY
BOND MARKET PRICES IN AN ECONOMIC DIP -- YIELD CURVE FLATTENS, BUT REMAINS STEEP -- TLT LEADS HIGHER WITH MOVE TO 2008 HIGHS -- 30-YEAR TREASURY YIELD HAS FURTHER ROOM TO FALL -- GOLD GOES PARABOLIC WITH STEEP MOVE
by John Murphy,
Chief Technical Analyst, StockCharts.com
BOND MARKET PRICES IN AN ECONOMIC DIP... Link for todays video. Double dip seems to be the economic topic djour. A CNN poll on August 10th noted that 25% of economists expect a double dip. This number was up from 15% just three months ago. Double dip refers to another...
READ MORE
MEMBERS ONLY
DOWNSIDE MOVING AVERAGE CROSSINGS INCREASE MARKET RISK -- 10 - AND 40- WEEK EMA DOWNTURN HAS GOOD TRACK RECORD OF IDENTIFYING BEAR MARKETS -- SO DOES 13-34 WEEKLY COMBINATION WHICH ALSO TURNED DOWN
by John Murphy,
Chief Technical Analyst, StockCharts.com
10 WEEK AVERAGE FALLS BELOW 40 WEEK ... Another sign that the stock market has probably entered a bear market is the fact that the 10-week moving average (or 50-day) has fallen below the 40-week (or 200 days). [For long term signals like these, I prefer weekly to daily signals].
Chart...
READ MORE
MEMBERS ONLY
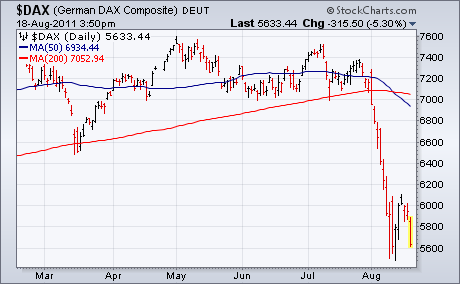
GERMANY LEADS GLOBAL STOCKS LOWER
by John Murphy,
Chief Technical Analyst, StockCharts.com
A 5% drop in German stocks is contributing to heavy selling in Europe which has spread to the U.S. Chart 1 shows the German DAX falling 5.3% to make it Europe's biggest loser. Most other European stocks are down 4%. Chart 2 EAFE Index iShares (EFA)...
READ MORE
MEMBERS ONLY
COMMON CHARACTERISTICS OF MARKET TOPS -- RSI MOVES INTO BEAR MODE FOR THE S&P 500 -- CONSUMER DISCRETIONARY MOVES FROM LEADER TO LAGGARD -- STEEL AND HOMEBUILDERS LEAD KEY INDUSTRY GROUPS LOWER -- EUROPEAN BANKS LEAD EUROPEAN INDICES LOWER
by John Murphy,
Chief Technical Analyst, StockCharts.com
COMMON CHARACTERISTICS OF PRIOR MARKET TOPS... Link for todays video. Now is a good time to review the prior market reversals for clues on what to expect with this reversal. History does not repeat itself, but it sure does rhyme (Mark Twain). The current bearish reversal in the S&...
READ MORE
MEMBERS ONLY
GLOBAL STOCKS TUMBLE WHICH MEANS SHORT-TERM BOUNCE IS PROBABLY OVER -- GERMANY IS BIGGEST EUROPEAN LOSER -- GOLD HITS NEW HIGHS AS OTHER COMMODITIES TUMBLE -- FLIGHT TO TREASURIES PUSHES 10-YEAR YIELD TO ALL-TIME LOW
by John Murphy,
Chief Technical Analyst, StockCharts.com
GERMANY LEADS GLOBAL STOCKS LOWER ... A 5% drop in German stocks is contributing to heavy selling in Europe which has spread to the U.S. Chart 1 shows the German DAX falling 5.3% to make it Europe's biggest loser. Most other European stocks are down 4%. Chart...
READ MORE
MEMBERS ONLY
SURGING EURO KEEPS RISK-ON TRADE AFLOAT -- AGRICULTURE ETF CORRECTS WITH FALLING WEDGE -- CORN INDEX BREAKS TRIANGLE RESISTANCE -- ELLIOTT WAVE COUNTS SHOWS S&P 500 IN 5-WAVE DECLINE -- CURRENT BOUNCE LOOKS LIKE CORRECTIVE WAVE 4
by John Murphy,
Chief Technical Analyst, StockCharts.com
SURGING EURO KEEPS RISK-ON TRADE AFLOAT... Link for todays video. The Euro Currency Trust (FXE) broke medium-term and short-term patterns to signal a continuation higher. Chart 1 shows the Euro Currency Trust (FXE) within an uptrend overall. First, notice that the ETF formed a higher low in January and moved...
READ MORE
MEMBERS ONLY
NYSE AND NASDAQ NET ADVANCES SURGE TO HIGHEST LEVELS OF THE YEAR -- SETTING RESISTANCE FOR THE DOW, NASDAQ AND NY COMPOSITE
by John Murphy,
Chief Technical Analyst, StockCharts.com
NYSE AND NASDAQ NET ADVANCES SURGE TO HIGHEST LEVELS OF THE YEAR... Link for todays video. The July-August decline started with a negative breadth surge on July 27th. Charts in the Market Message for that day showed Net Advances for both the NYSE and the Nasdaq plunging to their lowest...
READ MORE
MEMBERS ONLY
BULLS GET A DRAW FOR THE WEEK, BUT SUPPORT BREAKS REMAIN -- BROKEN SUPPORT LEVELS MARK FIRST RESISTANCE TO WATCH -- FINANCE AND BANKING ETFS HIT NEW 52-WEEK LOWS -- AD VOLUME LINES AFFIRM RECENT SELLING PRESSURE
by John Murphy,
Chief Technical Analyst, StockCharts.com
BULLS REGROUP, BUT SUPPORT BREAKS REMAIN... With a rebound over the last two days, the S&P 500 ETF (SPY) held the support level that was shown in Mondays market message. At the time, SPY was also severely oversold. This weeks bounce alleviated oversold conditions, but it was not...
READ MORE
MEMBERS ONLY
STOCKS REACH MOST OVERSOLD LEVEL IN TWO YEARS -- THAT DOESN'T NECESSARILY SIGNAL A BOTTOM -- BUT IT MAY LEAD TO A SHORT-TERM RELIEF RALLY -- USE FIBONACCI LINES TO FIND OVERHEAD RESISTANCE
by John Murphy,
Chief Technical Analyst, StockCharts.com
S&P OVERSHOOTS DOWNSIDE TARGET... Last Thursday's message offered a downside target in the S&P 500 to 1150. That level was based on a measurement from the "head and shoulders" top that was completed last week. The 1150 was also a 62% retracement...
READ MORE
MEMBERS ONLY
SECTOR CARPET SHOWS ONE GAINER IN 11 DAYS -- PANIC SELLING GRIPS WALL STREET AND THE CCI -- MARKING POTENTIAL SUPPORTS FOR SPY -- BOND ETF BREAKS 2010 HIGH -- KEEPING PERSPECTIVE WITH LOUIS RUKEYSER
by John Murphy,
Chief Technical Analyst, StockCharts.com
SECTOR CARPET SHOWS ONE GAINER IN 11 DAYS... Link for todays video. Investors hit the panic button as stocks moved sharply lower on Monday. Today might be considered a black Monday, even though stocks finished deeply in the red. There are at least two other black Mondays of note. First,...
READ MORE
MEMBERS ONLY
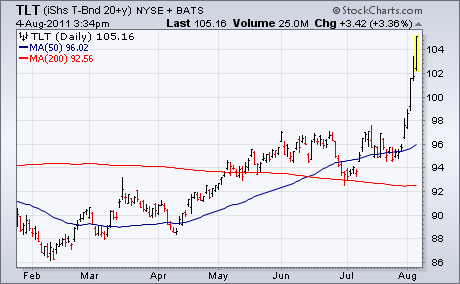
JUNK BONDS TUMBLE WITH STOCKS
by John Murphy,
Chief Technical Analyst, StockCharts.com
With global stocks and commodities in a rout, most U.S. bonds are surging again. Chart 1 shows the T-Bond 20+Year iShares (TLT) continuing its recent surge (as bond yields tumble to the lowest level in a year). The only exception is high yield corporates. Chart 2 shows the...
READ MORE
MEMBERS ONLY
BROKEN SUPPORTS TURN FIRST RESISTANCE -- NY COMPOSITE HITS FIBONACCI RETRACEMENT -- NON-CONFIRMATION PRECEDED DOW THEORY SELL SIGNAL -- S&P 500 CORRECTS AFTER THE 5TH OF THE 5TH -- BEARISH SCENARIO SHOWS S&P 500 ENTERING 3 OF III
by John Murphy,
Chief Technical Analyst, StockCharts.com
BROKEN SUPPORTS TURN FIRST RESISTANCE... Link for todays video. Fridays employment report provided a little good news on the labor market, but stocks still struggled with sharp losses in early trading on Friday. The major index ETFs are quite oversold, but showing no signs of support or firmness that could...
READ MORE
MEMBERS ONLY
GLOBAL STOCKS AND COMMODITIES PLUNGE -- EVEN GOLD SUCCUMBS TO PROFIT-TAKING -- YEN INTERVENTION BOOSTS DOLLAR -- BONDS ARE THE ONLY WINNERS -- EXCEPT FOR JUNK BONDS -- NASDAQ IS LAST U.S. INDEX TO BREAK MAJOR SUPPORT
by John Murphy,
Chief Technical Analyst, StockCharts.com
JUNK BONDS TUMBLE WITH STOCKS ... With global stocks and commodities in a rout, most U.S. bonds are surging again. Chart 1 shows the T-Bond 20+Year iShares (TLT) continuing its recent surge (as bond yields tumble to the lowest level in a year). The only exception is high yield...
READ MORE
MEMBERS ONLY
MORE SELLING IN EUROPEAN STOCKS SHOULD KEEP DOWNWARD PRESSURE ON U.S. STOCKS
by John Murphy,
Chief Technical Analyst, StockCharts.com
EUROPEAN STOCKS HIT NEW LOWS... More selling in European stocks this morning casts doubt on the staying power of yesterday afternoon's rebound in U.S. stocks. Chart 1, for example, shows the German DAX Composite Index trading lower again today and bearing down on its March low. French...
READ MORE
MEMBERS ONLY
2000 TOP EVOLVED OVER 9-MONTH PERIOD RSI BREAK DOWN CONFIRMED 2007 TOP -- RSI FORMS BEARISH FAILURE SWING ON SPX WEEKLY CHART -- DOLLAR FAILS TO ATTRACT MONEY AS SAFE-HAVEN -- JUNK BONDS ARE VULNERABLE WITH WEAK STOCK MARKET
by John Murphy,
Chief Technical Analyst, StockCharts.com
2000 TOP EVOLVED OVER 9-MONTH PERIOD ... Link for todays video. While no two tops are the same, we can learn from prior market tops by dissecting the price action and pinpointing the reversal points. With this in mind, I am going to dissect the 2000 and 2007 tops, both of...
READ MORE
MEMBERS ONLY
GLOBAL STOCKS FALL SHARPLY WITH A LOT SUPPORT LEVELS BEING BROKEN -- S&P 500 BREAKDOWN COMPLETES HEAD AND SHOULDERS TOPPING PATTERN -- MONEY POURS INTO SAFE HAVENS LIKE THE SWISS FRANC, PRECIOUS METALS, AND TREASURIES
by John Murphy,
Chief Technical Analyst, StockCharts.com
SAVE HAVENS SOAR... With global stocks under heavy selling pressure, money poured into safe haven markets. The three biggest winners on the day were precious metals (Chart 1), U.S. Treasuries (Chart 2), and the Swiss Franc (Chart 3). Unfortunately, most of the money moving into those three markets came...
READ MORE
MEMBERS ONLY
FRENCH AND GERMAN STOCKS BREAK IMPORTANT SUPPORT LEVELS -- S&P 500 MAY BE IN LATTER STAGES OF HEAD AND SHOULDERS TOP -- FALLING BOND YIELDS RAISE RISK LEVEL FOR STOCKS
by John Murphy,
Chief Technical Analyst, StockCharts.com
EUROPE'S TWO BIGGEST MARKETS BREAK DOWN... Two weeks ago (July 11) I showed that two of Europe's largest markets (Germany and France) were succumbing to selling in weaker countries like Italy and Spain. With France being the weaker of the two, I warned that a drop...
READ MORE
MEMBERS ONLY
DOW INDUSTRIALS SPDR TESTS TWO MAJOR TRENDLINES -- HEALTHCARE SECTOR HAMMERED AFTER DEBT DEAL -- AETNA, CIGNA AND UNITEDHEALTH LEAD LOWER -- RETAIL ETF EDGES LOWER WITH FALLING WEDGE
by John Murphy,
Chief Technical Analyst, StockCharts.com
DOW INDUSTRIALS SPDR TESTS TWO MAJOR TRENDLINES... Link for todays video. The debt-ceiling debacle turned into a deal over the weekend, but stocks continued to focus on the economy Monday as did bonds. In keeping with last weeks wave of bad economic news, the ISM Manufacturing Index dropped to its...
READ MORE
MEMBERS ONLY
RUSSELL 2000 ETF HEADS TOWARDS KEY SUPPORT TESTS -- 7-10 YEAR BOND ETF SURGES TO NEW 52-WEEK HIGH -- AD VOLUME LINES FORM LOWER HIGHS WITH JULY PLUNGE -- PERCENTAGE OF SPX STOCKS ABOVE 150-DAY SMA BREAKS 50%
by John Murphy,
Chief Technical Analyst, StockCharts.com
RUSSELL 2000 ETF HEADS TOWARDS KEY SUPPORT TESTS... Link for todays video. When it rains it pours. While most of this weeks media focus has been on the debt-ceiling debacle, Wall Street appears more focused on recent economic reports that show slowing growth. On Wednesday, it was reported that Durable...
READ MORE
MEMBERS ONLY
STOCKS DECLINE SHARPLY WITH BEARISH BREADTH SURGE -- UTILITIES HOLD UP THE BEST -- MICRO-CAPS AND SMALL-CAPS LEAD LOWER -- NY COMPOSITE TRACES OUT HEAD-AND-SHOULDERS PATTERN -- NASDAQ BACKS OFF RESISTANCE AGAIN XLI AND SMH TEST 2011 LOWS
by John Murphy,
Chief Technical Analyst, StockCharts.com
STOCKS DECLINE SHARPLY WITH BEARISH BREADTH SURGE... Link for todays video. Negative news on the economy and the debt-ceiling debacle knocked the wind out of stocks on Wednesday. First, Durable Goods orders unexpectedly declined in June. Second, the Feds beige book showed slowing in eight of twelve regions. Third, the...
READ MORE
MEMBERS ONLY
FALLING DOLLAR BOOSTS COMMODITY ASSETS -- FREEPORT MCMORAN FOLLOWS COPPER HIGHER -- ANADARKO PETROLEUM GIVES ENERGY SECTOR A BOOST -- MICROSOFT SHOWS NEW MARKET LEADERSHIP
by John Murphy,
Chief Technical Analyst, StockCharts.com
DOLLAR BREAKS TRIANGLE SUPPORT LINE... Arthur Hill and myself have described the sideways consolidation pattern in the U.S. Dollar Index ETF (UUP) as a bearish triangle which is identified by two converging trendlines. The UUP has clearly broken the lower support line this week which suggests the start of...
READ MORE
MEMBERS ONLY
QQQ PROVIDES THE LONE BREAKOUT -- SPY FORMS LARGE TRIANGLE -- INDUSTRIALS AND FINANCE LAGGING THE MARKET -- US DOLLAR FUND BREAKS TRIANGLE SUPPORT -- EURO TRUST CHALLENGES WEDGE RESISTANCE
by John Murphy,
Chief Technical Analyst, StockCharts.com
QQQ PROVIDES THE LONE BREAKOUT... Link for todays video. It remains a story of two stock markets, or more. The Nasdaq 100 ($NDX) broke above its 2011 highs with a surge above 59.5 on Friday. The ETF is struggling today, but largely holding above these highs. New highs are...
READ MORE
MEMBERS ONLY
FINANCE SPDR BATTLES CENTERLINE OF BIG CONSOLIDATION -- BROKER-DEALER ISHARES FORMS WEEKLY BULLISH ENGULFING -- AD VOLUME LINES BOUNCE OFF 200-DAY SMAS -- NASDAQ 100 BREADTH IS LAGGING THE INDEX -- BOND ETF HITS KEY RETRACEMENT AS MOMENTUM WANES
by John Murphy,
Chief Technical Analyst, StockCharts.com
FINANCE SPDR BATTLES CENTERLINE OF BIG CONSOLIDATION... Link for todays video. The finance sector has weighed on the broader market most of the year. While the ETF shows signs of firming this week, it remains short of the breakout needed to reverse the current downtrend. Chart 1 shows the Finance...
READ MORE
MEMBERS ONLY
STOCKCHARTS ADDS NEW CORRELATION COEFFICIENT INDICATOR WHICH IS ESPECIALLY HELPFUL IN INTERMARKET WORK -- IT CONFIRMS POSITIVE CORRELATION BETWEEN STOCKS AND COMMODITIES AND NEGATIVE CORRELATION TO BONDS AND THE DOLLAR
by John Murphy,
Chief Technical Analyst, StockCharts.com
IT QUANTIFIES INTERMARKET RELATIONSHIPS... The Correlation Coefficient which has just been added to the Stockcharts.com indicator list measures the strength of a relationship between two markets. That relationship can be positive or negative. For example, a coefficient of +1.0 means that two markets are perfectly correlated which means...
READ MORE
MEMBERS ONLY
APPLE BREAKS OUT AS QQQ CHALLENGES 2011 HIGHS -- SEMI ETF TESTS MAJOR SUPPORT LEVEL -- AMAT AND TXN WEIGH ON SEMIS -- NETWORKING ETF SHOWS RELATIVE WEAKNESS -- S&P EQUAL WEIGHT INDEX UNDERPERFORMS -- INTERNET ETF POWERS NASDAQ
by John Murphy,
Chief Technical Analyst, StockCharts.com
APPLE BREAKS OUT AS QQQ CHALLENGES 2011 HIGHS... Link for todays video. Led by Apple (APPL), the Nasdaq 100 ETF (QQQ) is once again challenging its 2011 highs. Chart 1 shows AAPL surging through resistance with a massive surge the last four weeks. Even though the breakout is bullish, the...
READ MORE
MEMBERS ONLY
QQQ AND IWM BACK OFF RESISTANCE -- FINANCIALS CONTINUE TO WEIGH ON STOCKS -- HOMEBUILDERS SPDR FORMS HEAD-AND-SHOULDERS PATTERN -- SWISS FRANC AND YEN ARE STRONGEST CURRENCIES -- DOLLAR REMAINS STUCK IN CONSOLIDATION PATTERN
by John Murphy,
Chief Technical Analyst, StockCharts.com
QQQ AND IWM BACK OFF RESISTANCE... Link for todays video. With a decline over the last seven days, the Russell 2000 ETF (IWM) and the Nasdaq 100 ETF (QQQ) backed off resistance from the 2011 highs. Taking a step back to look at the big picture, these ETF charts show...
READ MORE
MEMBERS ONLY
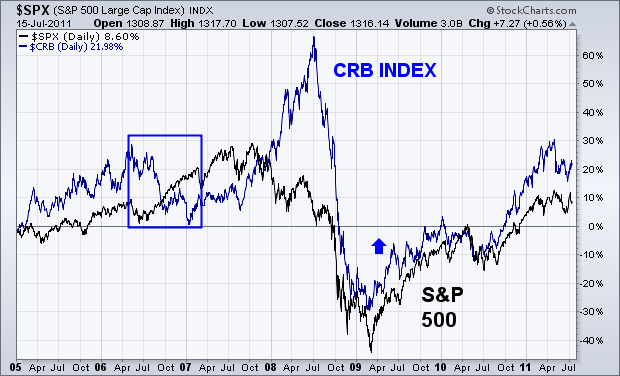
WILL RISING COMMODITIES BOOST STOCKS?
by John Murphy,
Chief Technical Analyst, StockCharts.com
The positive link between stocks and commodities doesn't always exist as shown in Chart 1. There have been periods in the past when they've trended in opposite directions like the second half of 2006 (see box). Stocks also have a history of peaking before commodities. Chart...
READ MORE
MEMBERS ONLY
FRIDAY'S LEADERS WERE ENERGY, MATERIALS, AND TECHNOLOGY -- GOOGLE, APPLE, AND MICROSOFT LEAD NASDAQ BOUNCE -- MSFT SHOWS NEW LEADERSHIP -- ADD FREEPORT MCMORAN COPPER AND GOLD TO METAL LEADERS -- S&P 500 REGAINS 50-DAY AVERAGE
by John Murphy,
Chief Technical Analyst, StockCharts.com
ENERGY AND MATERIAL STOCKS HAVE STRONG WEEK... The stock market staged a modest rally on Friday. It was enough, however, to either keep some indexes (like the Nasdaq) above its 50-day average, or to push some others (S&P 500) back above it. The three strongest sectors on Friday...
READ MORE
MEMBERS ONLY
INVESTORS BUY DRUGS AND SELL CHIPS -- S&P 500 SLIPS BELOW 50-DAY AVERAGE TURNING SHORT-TERM MOMENTUM BACK DOWN
by John Murphy,
Chief Technical Analyst, StockCharts.com
PHARM HOLDERS ARE DAY'S TOP ETF ... On another day when stocks are coming under selling pressure, investors are favoring defensive stock groups like pharmaceuticals. Chart 1 shows Pharm Holders (PPH) trading up on the day (while most of the rest of the market is down). The rising PPH/...
READ MORE
MEMBERS ONLY
SILVER JOINS GOLD IN PRECIOUS METALS RALLY -- MARKET VECTORS GOLD MINING INDEX (GDX) CLEARS RESISTANCE -- SILVER STOCKS LIKE SILVER WHEATON JUMP WITH METAL -- GOLD MINERS BPI TURNS POSITIVE
by John Murphy,
Chief Technical Analyst, StockCharts.com
GOLD MINERS BPI TURNS UP ... Last Wednesday's message wrote about a potential upturn in precious metals and stocks tied to them, and showed the Gold Miners Bullish Perent Index ($BPGDM) in oversold territory (below 30%) and on the verge of turning higher. [The BPGDM measures the percent of...
READ MORE
MEMBERS ONLY
COMMODITIES MAKE IMPRESSIVE COMEBACK FROM YESTERDAY'S SELLING -- GOLD CLEARS OVERHEAD RESISTANCE -- GOLD SHARES BOUNCE AS WELL LED BY GOLDCORP, YAMANA, AND KINROSS GOLD
by John Murphy,
Chief Technical Analyst, StockCharts.com
ALL COMMODITY GROUPS REBOUND... While global stocks are trying to stabilize after yesterday's selloff, commodity markets are making a decent comeback. Chart 1 shows the DB Commodities Tracking Index Fund (DBC) bouncing off its (blue) 50-day moving average. Chart 2 shows the DB Energy ETF (DBE) doing the...
READ MORE
MEMBERS ONLY
FRENCH AND GERMAN STOCKS SUCCUMB TO HEAVY SELLING IN SPAIN AND ITALY -- GERMAN DAX GAPS LOWER AND BREAKS 50-DAY LINE -- IT'S IMPORTANT THAT THE DAX STAY ABOVE ITS JUNE LOW -- S&P 500 RETESTS 50-DAY AVERAGE -- GOLD AND TREASURIES ATTRACT SAFE HAVEN BUYING
by John Murphy,
Chief Technical Analyst, StockCharts.com
SPAIN AND ITALY PULL REST OF EUROPE LOWER... European debt problems have spread to Spain and Italy which are pulling the rest of Europe (and global stocks) lower today. The four lines in Chart 1 the two of the day's weakest European stock markets (Italy and Spain) starting...
READ MORE
MEMBERS ONLY
SPAIN AND ITALY LEAD EUROPEAN AND GLOBAL STOCKS LOWER -- EURO TUMBLE PUSHES US DOLLAR SHARPLY HIGHER -- MOST COMMODITIES DROP -- GOLD AND TREASURIES RALLY ON SAFE HAVEN STATUS -- S&P 500 NEARS TEST OF 50-DAY LINE
by John Murphy,
Chief Technical Analyst, StockCharts.com
ITALY AND SPAIN PULL EUROPE LOWER... Heavy selling in Europe is pulling down global stock markets around the world. Two of the biggest losers in Europe are Italy and Spain. Both markets are down 6% and 4% respectively. And both are suffering chart damage. Chart 1 shows Italy iShares (EWI)...
READ MORE
MEMBERS ONLY
STOCKS SOAR AS DOLLAR WEAKENS -- COMMODITY ETF CLEARS 50-DAY LINE -- SO DOES ENERGY ETF AS ENERGY SHARES CLEAR RESISTANCE -- TRANSPORTS, RETAILERS, AND REITS HIT NEW HIGHS -- S&P 500 CLEARS RESISTANCE AND MAY TEST SPRING HIGH
by John Murphy,
Chief Technical Analyst, StockCharts.com
US DOLLAR CLOSES LOWER... After a higher open today, the U.S. Dollar Index (UUP) ended the day in the red as shown in Chart 1. The UUP continues to fluctuate in a bearish consolidation pattern. At the same time, the Euro did just the opposite. Chart 2 shows the...
READ MORE
MEMBERS ONLY
UPSIDE BREAKOUT IN JAPANESE STOCKS ADDS TO BULLISH ENTHUSIASM FOR STOCKS AND COMMODITIES -- A WEAKER YEN AND STRONGER AUSSIE DOLLAR IS ALSO A GOOD SIGN FOR RISKIER ASSETS
by John Murphy,
Chief Technical Analyst, StockCharts.com
JAPAN ISHARES HIT FOUR-MONTH HIGH ... Global stocks and commodities are continuing the strong rally that started last week. One of the reasons being given for today's U.S. stock rally is better employment news and strong retail sales. The fact that foreign stocks were already rallying before release...
READ MORE
MEMBERS ONLY
GOLD AND SILVER START TO BOUNCE ALONG WITH THEIR RELATED SHARES -- GLD CLEARS 50-DAY LINE -- THREE GOLD LEADERS ARE GOLDCORP, YAMANA, AND KINROSS GOLD -- GOLD MINERS BULLISH PERCENT INDEX IS OVERSOLD BUT HAS YET TO TURN UP
by John Murphy,
Chief Technical Analyst, StockCharts.com
GOLD ETF CLEARS 50-DAY LINE; SILVER TRYING TO BOTTOM... Precious metals have caught a bid over the last two days after lagging behind everything else over the last two months. The good news is that both gold and silver are finding chart support near previous lows, which is often the...
READ MORE