MEMBERS ONLY
FALLING DOLLAR BOOSTS COMMODITIES
by John Murphy,
Chief Technical Analyst, StockCharts.com
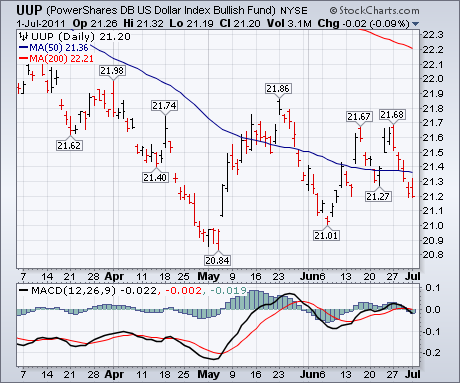
It was a good week for commodities and an even better week for stocks. But it all started with the dollar. We explained earlier in the week that the Dollar Index (UUP) appeared to be in a bearish consolidation pattern within a major downtrend. That view favored a lower greenback...
READ MORE
MEMBERS ONLY
STOCK INDEXES CLOSE WELL ABOVE 50-DAY LINES CONFIRMING START OF SUMMER RALLY -- RAILS AND DISCRETIONARY STOCKS HIT NEW 2011 HIGHS -- BOND PRICES DROP AS YIELDS CLIMB -- JUNK BONDS, HOWEVER, FOLLOW STOCKS HIGHER
by John Murphy,
Chief Technical Analyst, StockCharts.com
FALLING DOLLAR BOOSTS COMMODITIES... It was a good week for commodities and an even better week for stocks. But it all started with the dollar. We explained earlier in the week that the Dollar Index (UUP) appeared to be in a bearish consolidation pattern within a major downtrend. That view...
READ MORE
MEMBERS ONLY
GLOBAL STOCK INDEXES CLEAR 50-DAY MOVING AVERAGES -- COPPER TURNS UP AS FALLING DOLLAR BOOSTS BASIC MATERIAL STOCKS -- MOVING AVERAGE BREADTH INDICATORS TRIGGER BUY SIGNAL
by John Murphy,
Chief Technical Analyst, StockCharts.com
GLOBAL STOCKS TAKE OUT 50-DAY AVERAGES... My Tuesday message focused on the ability of global stock indexes to bounce off their 200-day averages (like the S&P 500) or to climb back above them (like foreign stocks). Today's focus is on the ability of global stocks to...
READ MORE
MEMBERS ONLY
FINANCE SECTOR CHALLENGES MID JUNE HIGHS -- US BANCORP AND HUNTINGTON BOUNCE OFF RETRACECMENT ZONES -- BASE METALS ETF BREAKS FLAG RESISTANCE -- SILVER BOUNCES OFF SUPPORT ZONE -- GOLD AND DOLLAR ETFS FORM TRIANGLE CONSOLIDATIONS -- TWO WEEK VACATION
by John Murphy,
Chief Technical Analyst, StockCharts.com
FINANCE SECTOR CHALLENGES MID JUNE HIGHS... Finance was one of the leading sectors on Wednesday as the Finance SPDR (XLF) surged towards short-term resistance. Chart 1 shows XLF hitting support near broken resistance and the 61.8% retracement line throughout June. This support combination makes the area a good place...
READ MORE
MEMBERS ONLY
BEARISH DOLLAR TREND IS HELPING GLOBAL STOCKS AND COMMODITIES BOUNCE OFF THEIR 200-DAY AVERAGES -- TREASURY PRICES ARE BACKING OFF SHARPLY FROM OVERHEAD RESISTANCE -- IT'S TIME FOR SUMMER RALLY WHICH ARGUES FOR A STRONGER JULY
by John Murphy,
Chief Technical Analyst, StockCharts.com
DOLLAR WEAKENS IN BEARISH CONSOLIDATION PATTERN... The U.S. Dollar Index continues to move sideways in what appears to be a bearish consolidation pattern. Chart 1 shows the June rally in the DB Bullish Dollar ETF (UUP) falling well short of its May peak. That increases the odds that the...
READ MORE
MEMBERS ONLY
BIG TECHS LEAD MARKET HIGHER -- SMALL-CAP ETF HOLDS SHORT-TERM BREAKOUT -- AMAZON, COMCAST AND MICROSOFT POWER QQQ -- SEMI HOLDRS FORMS INSIDE DAYS AT SUPPORT -- TEXAS INSTRUMENTS AND INTEL HOLD KEY TO SMH
by John Murphy,
Chief Technical Analyst, StockCharts.com
BIG TECHS LEAD MARKET HIGHER... Link for todays video. For the third time in five sessions, the Nasdaq 100 ETF (QQQ) formed an exceptionally large white candlestick. A candlestick is white (hollow) when the close is above the open or black (filled) when the close is below the open. The...
READ MORE
MEMBERS ONLY
FINANCE SECTOR LEADS THE MARKET LOWER -- MATERIALS SPDR FIRMS AT SUPPORT -- TECHNOLOGY SPDR TESTS DOUBLE TOP SUPPORT -- ENERGY SPDR FALLS WITHIN WEDGE -- MARKING KEY RESISTANCE FOR THE DOLLAR BULLISH ETF -- 13-WEEK TBILL YIELD FALLS TO 2008 LEVELS
by John Murphy,
Chief Technical Analyst, StockCharts.com
FINANCE SECTOR LEADS THE MARKET LOWER... Link for todays video. With a little pop-and-drop action this week, three key sector ETFs established clear resistance levels chartists can watch to define a follow through. One day wonder-rallies and oversold bounces can happen with short covering and bottom picking. Follow through to...
READ MORE
MEMBERS ONLY
GLOBAL STOCKS AND COMMODITIES FALL TOGETHER AS DOLLAR RISES -- OIL LEADS COMMODITY DECLINE
by John Murphy,
Chief Technical Analyst, StockCharts.com
RISING DOLLAR HURTS STOCKS AND COMMODITIES... A surge in the U.S. Dollar is contributing to heavy selling of global stocks and commodities. Chart 1 shows the DB Bullish Dollar ETF (UUP) gapping more than 1% higher today and nearing a test of its mid-June peak. Chart 2 shows the...
READ MORE
MEMBERS ONLY
SMALL-CAPS AND MID-CAPS LEAD STOCKS HIGHER -- GOLD MINERS ETF SPRINGS A BEAR TRAP -- BONDS MAINTAIN CONSOLIDATION AFTER THE FED -- NASDAQ NET ADVANCING VOLUME RATIO SURGES -- NYSE AD LINE CONTINUES TO SHOW STRENGTH
by John Murphy,
Chief Technical Analyst, StockCharts.com
SMALL-CAPS AND MID-CAPS LEAD STOCKS HIGHER... Link for todays video. Stocks stalled on Wednesday, but held most of their big gains from Tuesday as the Fed voted to maintain current policy. In particular, small-caps led the way higher the last two days with the Russell 2000 ETF (IWM) surging off...
READ MORE
MEMBERS ONLY
RETAILERS LEAD OVERSOLD BOUNCE -- RSI TURNS OVERSOLD FOR RETAIL HOLDRS -- AIRLINE INDEX BOUNCES OFF SUPPORT -- ALASKA, JETBLUE AND UNITED-CONTINENTAL LEAD AIRLINES -- NYSE NET NEW HIGHS FLIRT WITH NEGATIVE TERRITORY -- GERMAN DAX FIRMS AT KEY RETRACEMENT
by John Murphy,
Chief Technical Analyst, StockCharts.com
RETAILERS LEAD OVERSOLD BOUNCE... Link for todays video. Stocks edged higher in early trading on Monday with retailers showing relative strength. It is going to be a big, and possibly volatile, week for the markets. Several key ETFs are testing their March lows as the Papandreou government braces for a...
READ MORE
MEMBERS ONLY
%NYSE STOCKS ABOVE 200-DAY AVERAGE STILL DROPPING
by John Murphy,
Chief Technical Analyst, StockCharts.com
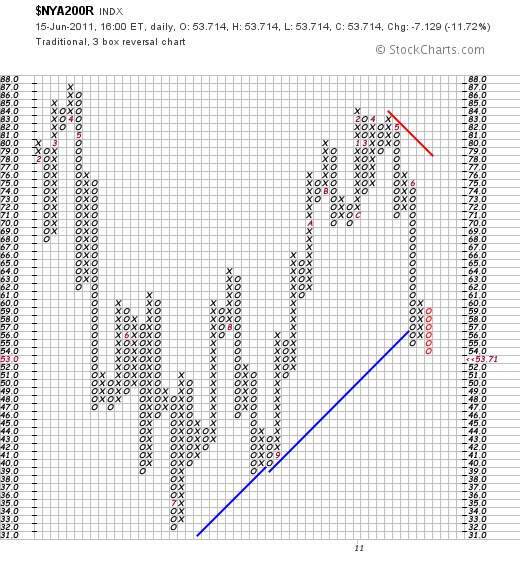
Last Thursday's message showed the point & figure version of the % NYSE stocks above their 200-day moving average in a downside correction. I suggested that the first sign of improvement would be a three-box reversal to a rising X column. We got that this week, but it proved...
READ MORE
MEMBERS ONLY
XLB, XLI AND XLK TEST 2011 SUPPORT LEVELS -- SMH DECLINES TO MARCH LOW -- FINANCE AND BANKING ETFS MAY HOLD THE KEY -- DEFENSIVE SECTORS ARE HOLDING UP THE BEST -- XLP, XLU AND XLV CORRECT AFTER STRONG ADVANCES
by John Murphy,
Chief Technical Analyst, StockCharts.com
XLB, XLI AND XLK TEST 2011 SUPPORT LEVELS... Link for todays video.
In addition to a number of key indices, several sector SPDRs are testing support from the March lows. These lows are important because stocks declined rather sharply from mid February to mid March. The subsequent surge off the...
READ MORE
MEMBERS ONLY
STOCK INDEXES ARE TESTING IMPORTANT CHART SUPPORT NEAR 200-DAY AVERAGES AND LOOK OVERSOLD -- THAT COULD GIVE WAY TO A SUMMER BOUNCE -- BOND PRICES ARE NEARING OVERHEAD RESISTANCE -- ANY BOUNCE IN STOCKS AND COMMODITIES MAY DEPEND ON A FIRMER EURO
by John Murphy,
Chief Technical Analyst, StockCharts.com
%NYSE STOCKS ABOVE 200-DAY AVERAGE STILL DROPPING... Last Thursday's message showed the point & figure version of the % NYSE stocks above their 200-day moving average in a downside correction. I suggested that the first sign of improvement would be a three-box reversal to a rising X column. We...
READ MORE
MEMBERS ONLY
SPY FILLS TUESDAYS GAP -- MARCH LOWS COMING INTO PLAY FOR QQQ -- BREADTH INDICATORS REFLECT BROAD SELLING PRESSURE -- OIL PLUNGES ON ECONOMIC REPORT AND STRONG DOLLAR -- DOLLAR ETF FORMS HIGHER LOW AS MOMENTUM IMPROVES
by John Murphy,
Chief Technical Analyst, StockCharts.com
SPY FILLS TUESDAYS GAP ... Link for todays video. Stocks were sharply lower on Wednesday as the risk-off trade returned after Tuesdays sharp advance. The Nasdaq 100 ETF (QQQ) and S&P 500 ETF (SPY) broke below Mondays lows with sharp declines on Wednesday. Chart 1 shows SPY failing to...
READ MORE
MEMBERS ONLY
OIL ETFS BREAK SUPPORT WITH SHARP DECLINES -- XLE BREAKS NECKLINE SUPPORT WITH LARGE DECLINE -- CVX, SLB AND XOM LEAD ENERGY SPDR LOWER -- WAVE COUNT INDICATES FIFTH OF THE FIFTH FOR S&P 500 -- HAS ABC CORRECTION STARTED OR JUST ENDED?
by John Murphy,
Chief Technical Analyst, StockCharts.com
OIL ETFS BREAK SUPPORT WITH SHARP DECLINES... The 12-Month US Oil Fund (USL) and the US Oil Fund (USO) broke short-term support levels with sharp declines on Monday. Friday I wrote about the triple whammy hitting oil as Saudi Arabia increased output, stocks were down and the Dollar was up....
READ MORE
MEMBERS ONLY
SETTING DOWNSIDE TARGETS FOR SPY AND QQQ -- AD VOLUME LINES FORM LARGE DOUBLE TOPS -- NASDAQ NET NEW HIGHS TURN NEGATIVE -- DOLLAR SURGES TO FORM HIGHER LOW -- STRENGTH IN THE DOLLAR WEIGHS ON GOLD -- OIL DROPS ON TRIPLE WHAMMY
by John Murphy,
Chief Technical Analyst, StockCharts.com
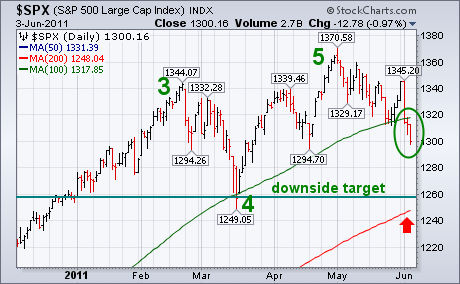
SETTING DOWNSIDE TARGETS FOR SPY AND QQQ... The S&P 500 ETF (SPY) is in the midst of a correction within a bigger uptrend. One look at a chart 2 year chart confirms this uptrend. In fact, the decline of the last six weeks looks rather mild when compared...
READ MORE
MEMBERS ONLY
% NYSE STOCKS ABOVE 50 AND 200-DAY MOVING AVERAGES CONTINUES TO DROP -- S&P 500 BOUNCES OFF LOWER 100-DAY BOLLINGER BAND -- BUT NEEDS TO CLEAR SOME OVERHEAD RESISTANCE BARRIERS TO SIGNAL END OF CORRECTION
by John Murphy,
Chief Technical Analyst, StockCharts.com
% NYSE STOCKS ABOVE 50-DAY MA STILL DROPPING... Nearly a month ago on May 16 I showed the % of NYSE stocks trading over their 50-day moving averages ($NYA50R) dropping below 50% which betrayed a weakening market beneath the surface. As of yesterday, that percentage had dropped to 23% which is the...
READ MORE
MEMBERS ONLY
DOW INDUSTRIALS SPDR TESTS APRIL LOWS -- SEMIS AND NETWORKING ETFS LEAD TECH SECTOR LOWER -- GOLD MINERS ETFS TEST MAJOR SUPPORT LEVELS -- METALS & MINING SPDR NEARS 2011 LOWS -- AGRICULTURE ETF CONSOLIDATES AT SUPPORT
by John Murphy,
Chief Technical Analyst, StockCharts.com
DOW INDUSTRIALS SPDR TESTS APRIL LOWS... Link for todays video. The Dow Industrials SPDR (DIA) is clearly in a downtrend since early May. How far will this decline extend? The April lows mark the first test and the March lows mark the second test. Chart 1 shows DIA trying to...
READ MORE
MEMBERS ONLY
FINANCE SECTOR LEADS MARKET LOWER -- WELLS FARGO AND JP MORGAN WEIGH ON XLF -- AIRLINE INDEX GIVES BACK MOST OF PRIOR ADVANCE -- AIRLINES PUSH DOW TRANSPORTS BELOW APRIL LOWS -- UPS AND FDX LEAD TRANSPORTS LOWER
by John Murphy,
Chief Technical Analyst, StockCharts.com
FINANCE SECTOR LEADS MARKET LOWER... Link for todays video. The finance sector led the market lower on Monday with another sharp decline. Chart 1 shows the Finance SPDR (XLF) moving below 15 to enter a potential support zone. Broken resistance and the 62% retracement mark potential support in the 14....
READ MORE
MEMBERS ONLY
S&P 500 VIOLATED MAJOR UP TRENDLINE
by John Murphy,
Chief Technical Analyst, StockCharts.com
Thurday's message showed the S&P 500 threatening two important support lines. Unfortunately, both have been broken. Chart 1 shows the SPX closing below its 100-day average (green line) for the first time since last August. The weekly bars in Chart 2 show the SPX ending well...
READ MORE
MEMBERS ONLY
S&P 500 VIOLATES IMPORTANT SUPPORT LINES TO ENTER DOWNSIDE CORRECTION -- THE MARCH LOW IS NEXT DOWNSIDE TARGET -- HIGH YIELD BONDS CORRECT ALONG WITH STOCKS -- FALLING DOLLAR BOOSTS COMMODITIES AND FOREIGN STOCKS
by John Murphy,
Chief Technical Analyst, StockCharts.com
S&P 500 VIOLATED MAJOR UP TRENDLINE... Thurday's message showed the S&P 500 threatening two important support lines. Unfortunately, both have been broken. Chart 1 shows the SPX closing below its 100-day average (green line) for the first time since last August. The weekly bars...
READ MORE
MEMBERS ONLY
SHORT-TERM DOWNTRENDS WITHIN LONG-TERM UPTRENDS -- BREADTH INDICATORS HAVE YET TO BREAK DOWN -- RETAILERS BEAR BRUNT OF SELLING PRESSURE -- HD AND WMT BREAK SUPPORT AS AMZN TESTS SUPPORT -- OIL ETFS FORM BEAR FLAGS
by John Murphy,
Chief Technical Analyst, StockCharts.com
SHORT-TERM DOWNTRENDS WITHIN LONG-TERM UPTRENDS ... Link for todays video. News this week was certainly not positive. The economic reports showed that the economy was slowing and the employment reports showed sluggish job growth. The week ended with non-farm payrolls increasing by 54,000 jobs in May, which was well below...
READ MORE
MEMBERS ONLY
S&P 500 IS THREATENING IMPORTANT SUPPORT LINES -- NEGATIVE WEEKLY SIGNALS OVERRIDE DAILY CHARTS -- BONDS AND STOCKS HAVE BEEN SENDING CONFLICTING SIGNALS -- IT LOOKS LIKE BONDS MAY HAVE BEEN RIGHT
by John Murphy,
Chief Technical Analyst, StockCharts.com
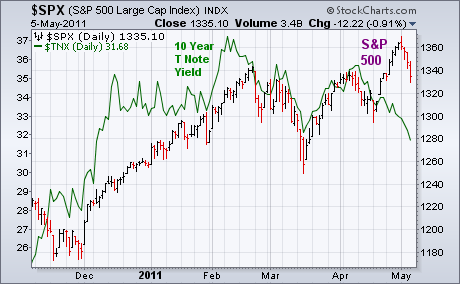
BONDS AND STOCKS SEND CONFLICTING MESSAGES... One of the problems market watchers have been grappling with over the past couple of months is the conflicting messages being sent by bonds and stocks. Here's why. Chart 1 compares the S&P 500 (price bars) to the 10-Year T-Note...
READ MORE
MEMBERS ONLY
TREASURIES SURGE ON WEAK ECONOMIC NUMBERS -- 10-YEAR TREASURY YIELD BREAKS 3% -- RESISTANCE LEVELS COME INTO PLAY FOR DIA, QQQ AND SPY -- FINANCE LEADS LOWER AS SUPPORT BREAK HOLDS -- OIL FOLLOWS STOCKS LOWER -- MONEY MOVES INTO GOLD
by John Murphy,
Chief Technical Analyst, StockCharts.com
TREASURIES SURGE ON WEAK ECONOMIC NUMBERS... Link for todays video. US Treasury Bonds continued their relentless rise after two economic releases came up short. First, ADP Employer Services reported that private sector job growth for May increased the smallest amount since September. Second, the Institute for Supply Management (ISM) reported...
READ MORE
MEMBERS ONLY
GLOBAL STOCKS SURGE -- EUROPE RALLIES ON GREEK AID -- CHINA LEADS EMERGING MARKETS HIGHER -- S&P 500 CLEARS MOVING AVERAGE LINES -- SMALL CAPS AND NASDAQ CLEAR INITIAL RESISTANCE -- A LOT OF TODAY'S BUYING WAS DUE TO THE FALLING DOLLAR
by John Murphy,
Chief Technical Analyst, StockCharts.com
STRONG EURO BOOSTS EUROPEAN STOCKS ... News of more aid for Greece pushed the Euro higher today and European stocks along with it. Chart 1 shows the Euro climbing to a three-week high today and finishing back above its 50-day average. European stocks surged along with it. Chart 2 shows Europe...
READ MORE
MEMBERS ONLY
BETTER NEWS ON GREECE BOOSTS EURO AND EUROPEAN SHARES -- THAT'S WEAKENING THE DOLLAR WHICH IS GOOD FOR GLOBAL STOCKS AND COMMODITIES
by John Murphy,
Chief Technical Analyst, StockCharts.com
RALLY IN EUROPE AND EURO BOOSTS GLOBAL STOCKS AND COMMODITIES... News of more aid to Greece is giving a big boost to European stocks and the Euro. The first three charts show German, French, and British stock indexes jumping sharply this morning. All three are climbing back above their 50-day...
READ MORE
MEMBERS ONLY
INDUSTRIALS SPDR AND S&P MIDCAP SPDR BOUNCE OFF APRIL LOWS -- REAL ESTATE ISHARES FORMS BULL FLAG -- DOW INDUSTRIALS FIRMS AT POTENTIAL INFLECTION POINT -- DOW TRANSPORTS SHOWS RELATIVE STRENGTH -- NATURAL GAS SURGES OFF MARCH-APRIL LOWS
by John Murphy,
Chief Technical Analyst, StockCharts.com
INDUSTRIALS SPDR AND S&P MIDCAP SPDR BOUNCE OFF APRIL LOWS... Link for todays video. Basic trend analysis stipulates that an uptrend consists of rising peaks and rising troughs. The trick, as always, is picking the right peaks and trough upon which to base the trend. The most recent...
READ MORE
MEMBERS ONLY
RECENT DROP IN COMMODITIES HAS COINCIDED WITH DOLLAR RALLY -- LONG TERM DOLLAR CHART, HOWEVER, REMAINS BEARISH WHICH SHOULD BE POSITIVE FOR COMMODITY ASSETS -- EMERGING MARKETS TEST 200-DAY AVERAGES
by John Murphy,
Chief Technical Analyst, StockCharts.com
COMMODITIES BOUNCE AS DOLLAR PULLS BACK ... I wrote on Tuesday that commodities (and stocks related to them) had fallen back to important support levels and were starting to stabilize. I also suggested that they appeared to present good value at current levels. As you know, the trend of commodity assets...
READ MORE
MEMBERS ONLY
SMALL-CAPS LEAD OVERSOLD BOUNCE -- HOME CONSTRUCTION ETF FORGES BULLISH ENGULFING TOL FAILS TO BREAK OUT AS PMH REMAINS WEAK -- OIL AND GASOLINE ETFS GET OVERSOLD BOUNCES -- ENERGY SPDR BOUNCES OFF MARCH LOWS -- OIL SERVICE HOLDRS SETS A BEAR TRAP
by John Murphy,
Chief Technical Analyst, StockCharts.com
SMALL-CAPS LEAD OVERSOLD BOUNCE FOR STOCKS... Link for todays video. Stocks moved higher on Wednesday, but the bounce was rather uneven and uninspiring. Small-caps led the way higher as the Russell 2000 ETF (IWM) gained over 1%. Large-caps lagged as the S&P 500 gained around a third of...
READ MORE
MEMBERS ONLY
OVERSOLD COMMODITIES BOUNCE OFF CHART SUPPORT -- SO DO STOCKS TIED TO THEM -- TECHNOLOGY STOCKS WEIGH ON MARKET -- S&P 500 IS TESTING 100-DAY AVERAGE WHICH IS AN IMPORTANT SUPPORT LINE
by John Murphy,
Chief Technical Analyst, StockCharts.com
OVERSOLD COMMODITIES START TO BOUNCE... After suffering a sharp downside correction during May, commodities are starting to stabilize. A combination of chart support and a short-term oversold condition also suggest that the worst may be over for commodity assets. Chart 1, for example, shows the DB Commodities Tracking Index (DBC)...
READ MORE
MEMBERS ONLY
US STOCKS FOLLOW EUROPEAN STOCKS LOWER -- BONDS AND DOLLAR ADVANCE AS STOCKS AND COMMODITIES DECLINE -- GERMAN, FRENCH AND DUTCH INDICES MOVE SHARPLY LOWER -- ITALIAN AND SPANISH STOCK INDICES BREAK SUPPORT - GREEK INDEX HITS NEW LOW
by John Murphy,
Chief Technical Analyst, StockCharts.com
US STOCKS FOLLOW EUROPEAN STOCKS LOWER... Link for todays video. Weakness in Europe spread to the US as stocks opened sharply lower on Monday and remained under selling pressure. Chart 1 shows the Dow Industrials down around 100 points. Despite the May decline, the overall trend remains up as the...
READ MORE
MEMBERS ONLY
THE MARKET'S HAD A FIVE WAVE ADVANCE
by John Murphy,
Chief Technical Analyst, StockCharts.com
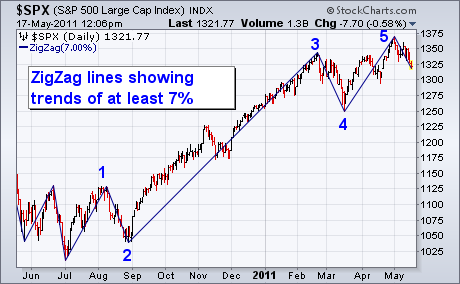
Determining Elliott Wave counts can be very subjective. One way to make it little easier is to employ a "ZigZag"overlay on the price chart. [The ZigZag is located in the same Overlays menu that includes moving averages]. The idea of the ZigZag overlay is to apply a...
READ MORE
MEMBERS ONLY
FALLING FLAGS REMAIN FOR DIA AND SPY -- STRENGTH IN THE DOLLAR WEIGHS ON OIL -- BOND ETFS HIT RETRACEMENTS -- GOLD MINERS ETF TESTS MAJOR SUPPORT LEVEL -- GOLD ETF FORMS TRIANGLE CONSOLIDATION
by John Murphy,
Chief Technical Analyst, StockCharts.com
FALLING FLAGS REMAIN FOR DIA AND SPY... Link for todays video. Stocks got off to a weak start on Friday with the Dow Industrials SPDR (DIA) and S&P 500 ETF (SPY) moving lower in early trading. With these declines, lower highs are taking shape again this week to...
READ MORE
MEMBERS ONLY
RUSSELL 2000 ETF BOUNCES OFF SUPPORT -- DOW INDUSTRIALS SPDR FORMS FALLING FLAG -- OIL GETS OVERSOLD BOUNCE -- ENERGY SPDR FINDS SUPPORT AT MARCH LOW -- FALLING BULLISH PERCENT INDEX IS SHORT-TERM BEARISH
by John Murphy,
Chief Technical Analyst, StockCharts.com
RUSSELL 2000 ETF BOUNCES OFF SUPPORT... Link for todays video. After a sharp decline the prior five days, stocks got an oversold bounce with small-caps leading the way. Chart 1 shows the Russell 2000 ETF (IWM) getting a bounce off support from the early April low. Support in this area...
READ MORE
MEMBERS ONLY
MARKET APPEARS TO HAVE COMPLETED FIVE WAVES OVER THE LAST YEAR WHICH INCREASES THE ODDS FOR A DOWNSIDE CORRECTION -- MOVING AVERAGE TRENDS WEAKEN -- MARKET MAY NOW REVISIT MARCH LOW AS PART OF DOWNSIDE CORRECTION
by John Murphy,
Chief Technical Analyst, StockCharts.com
THE MARKET'S HAD A FIVE WAVE ADVANCE... Determining Elliott Wave counts can be very subjective. One way to make it little easier is to employ a "ZigZag"overlay on the price chart. [The ZigZag is located in the same Overlays menu that includes moving averages]. The...
READ MORE
MEMBERS ONLY
FINANCE SECTOR ON VERGE OF P&F TRIPLE BOTTOM BREAKDOWN -- BAR CHART CONFIRMS NEXT SUPPORT FOR XLF -- BANK OF AMERICA, CITIGROUP AND JP MORGAN BREAK SUPPORT -- THE KEY P&F LEVEL FOR NET NEW HIGHS -- USING P&F CHARTS TO GAUGE RELATIVE STRENGTH OR WEAKNESS
by John Murphy,
Chief Technical Analyst, StockCharts.com
FINANCE SECTOR ON VERGE OF P&F TRIPLE BOTTOM BREAKDOWN... Link for todays video. I am on the road so Monday's Market Message is coming a bit early. John Murphy featured the Finance SPDR (XLF) as it tested its 2011 lows on Friday and showed relative weakness....
READ MORE
MEMBERS ONLY
EURO WEAKNESS/DOLLAR STRENGTH PRESSURES STOCKS AND COMMODITIES -- EMERGING MARKETS WEAKEN -- FINANCIALS WEAKEN AS TECHS MEET RESISTANCE NEAR OLD HIGH -- DROP IN BOND YIELDS MAY EXPLAIN RECENT MOVE INTO DIVIDEND PAYING STOCKS -- S&P RETESTS NECKLINE
by John Murphy,
Chief Technical Analyst, StockCharts.com
EURO BREAKS 50-DAY LINE... Last week's sharp drop in the Euro (and rebound in the dollar) contributed to heavy selling in commodity assets and increased the odds for a stock correction. Unfortunately, the short-term picture has weakened more with the Euro falling below its 50-day average for the...
READ MORE
MEMBERS ONLY
ENERGY AND MATERIALS WEAKEN AGAIN AS COMMODITIES SEE RENEWED SELLING -- FREEPORT MCMORGAN COPPER & GOLD FOLLOWS COPPER LOWER -- ADD DR. PEPPER AND CVS TO DEFENSIVE WINNERS
by John Murphy,
Chief Technical Analyst, StockCharts.com
COMMODITIES CONTINUE TO WEAKEN... Commodities are coming under renewed selling pressure after the oversold bounce of the last two days. The following charts also show that this week's rebound came on much lighter volume that last week's heavy selling. That's a strong indication that...
READ MORE
MEMBERS ONLY
QQQ AND IWM ESTABLISH IMPORTANT SHORT-TERM SUPPORT -- XLF BOUNCES WITHIN TRIANGLE CONSOLIDATION -- REGIONAL BANK SPDR FORMS MORNING DOJI STAR -- TRANSPORTS AND RETAILERS REMAIN STRONG OVERALL -- AIRLINE INDEX BREAKS RESISTANCE WITH BIG SURGE
by John Murphy,
Chief Technical Analyst, StockCharts.com
QQQ AND IWM ESTABLISH IMPORTANT SHORT-TERM SUPPORT... Link for todays video. With a bounce over the last few days, the Nasdaq 100 ETF (QQQ) and Russell 2000 ETF (IWM) established important short-term levels to watching going forward. It is important to realize that major trend reversals occur in stages. A...
READ MORE
MEMBERS ONLY
DROP IN BOND YIELDS MAY BE WARNING FOR STOCKS
by John Murphy,
Chief Technical Analyst, StockCharts.com
Bonds have benefited from the plunge in commodities. Several bond ETFs have rallied to the highest levels in months. Rising bond prices are pushing bond yields lower. And that may be a warning for stocks. That's because bond yields (which are a barometer of economic strength) have been...
READ MORE