MEMBERS ONLY
GLOBAL STOCKS AND COMMODITIES JUMP ON FALLING DOLLAR -- MATERIALS AND ENERGY ARE DAY'S STRONGEST STOCKS -- GDX TRADES AT RECORD HIGH -- XLE BUILDS ON BULLISH BREAKOUT
by John Murphy,
Chief Technical Analyst, StockCharts.com
STOCK INDEXES BOUNCE OFF CHART SUPPORT... Global stocks and commodities are off to a strong start today. U.S. stocks are following the lead of rising foreign shares. Today could be an important day for U.S. stocks if the market can hold and build onto this morning's...
READ MORE
MEMBERS ONLY
STOCHRSI TURNS BEARISH FOR THE NASDAQ -- RUSSELL 2000 BATTLES RESISTANCE BREAK -- FINANCE SPDR FORMS PENNANT AFTER SHARP DECLINE -- REGIONAL BANK SPDR STALLS NEAR CONSOLIDATION RESISTANCE -- ABC CORRECTIONS FOR THE XLI, XLY AND $TRAN
by John Murphy,
Chief Technical Analyst, StockCharts.com
STOCHRSI TURNS SHORT-TERM BEARISH FOR THE NASDAQ ... A correction or consolidation period could be in store as the Nasdaq comes off overbought conditions in September. Chart 1 shows the Nasdaq surging around 13% in September and breaking above its summer high. With a 1.11% decline today, the index is...
READ MORE
MEMBERS ONLY
QQQQ, SPY AND XLY FORM SMALL CONSOLIDATION PATTERNS -- SHANGHAI SURGES OFF SUPPORT AS NIKKEI CORRECTS -- DOLLAR BREAKS LONG-TERM SUPPORT ON QE2 -- GOLD, SILVER AND PLATINUM AS DOLLAR ALTERNATIVES -- OIL AND GASOLINE BREAK RESISTANCE
by John Murphy,
Chief Technical Analyst, StockCharts.com
QQQQ, SPY AND XLY FORM SMALL CONSOLIDATION PATTERNS ... Link for todays video. With stocks trading flat the entire week, consolidation patterns formed in a number of key ETFs. Chart 1 shows the Nasdaq 100 ETF (QQQQ) surging above its summer highs and then consolidating around 49 this week. QQQQ gapped...
READ MORE
MEMBERS ONLY
STOCKS STALL AFTER BREAKOUTS -- NASDAQ HOLDS ABOVE RESISTANCE BREAK OUT -- BANKING AND HOUSING ETFS COULD HOLD THE KEY -- OIL SURGES OVER 2% TO CHALLENGE RESISTANCE -- ENERGY SPDR CHALLENGES SUMMER HIGHS -- OIL AND GAS E&P ETF BREAKS FLAG RESISTANCE
by John Murphy,
Chief Technical Analyst, StockCharts.com
STOCKS STALL, BUT NO SIGNS OF WEAKNESS YET... Link for todays video. Stocks finished mixed on Wednesday with large-caps edging lower, small-caps edging higher and the Nasdaqs finishing fractionally lower. Chart 1 shows the NY Composite ($NYA) stalling around 7300 on Wednesday. The overall trend is clearly up with a...
READ MORE
MEMBERS ONLY
STRONG CLOSE ON RISING VOLUME IS SIGN OF STOCK STRENGTH -- SMALL CAPS BREAK OUT -- AIRLINES AND RAILS LEAD TRANSPORTS HIGHER -- MARKET VECTORS GOLD MINING ETF NEARS NEW RECORD -- STAPLES AND HEALTHCARE LEAD DIVIDEND ISHARES HIGHER
by John Murphy,
Chief Technical Analyst, StockCharts.com
NYSE COMPOSITE INDEX RESUMES UPTREND ON RISING VOLUME -- SMALL CAPS BREAK OUT... After opening lower this morning, stocks turned in a positive chart day. All of the major stock indexes closed at or near new recovery highs. And they did so on rising volume, which is a healthy combination....
READ MORE
MEMBERS ONLY
LOW BOND YIELDS CONTINUE TO BENEFIT DIVIDEND-PAYING STOCKS -- TELECOM AND UTILITIES HAVE BEEN MARKET LEADERS -- DJ DIVIDEND ISHARES CONTINUE TO OUTPERFORM -- COCA COLA HITS 52-WEEK HIGH -- PHARMA HOLDERS LEAD HEALTHCARE SECTOR HIGHER
by John Murphy,
Chief Technical Analyst, StockCharts.com
HIGH YIELDING GROUPS ARE MARKET LEADERS... With US rates at or near record lows, investors have been favoring stock groups that pay dividends in excess of bond yields. I addressed this issue on August 12 with a message headlined: "Dividend Paying Stocks Like Utilities and Telecom Do Better in...
READ MORE
MEMBERS ONLY
FINANCIALS LEAD LATE SELLOFF IN STOCKS -- LONG BOND ETF HOLDS BREAKOUT WITH BIG GAIN -- USING DOW JONES INDICES TO FOLLOW THE WORLD -- GERMANY AND FRANCE INDICES BATTLE RESISTANCE -- GREECE AND IRELAND LAG THE REST OF EUROPE
by John Murphy,
Chief Technical Analyst, StockCharts.com
FINANCIALS LEAD LATE SELL-OFF IN STOCKS... Link for todays video. After bouncing around most of the day Monday, stocks were hit with selling pressure in the final hour and the S&P 500 closed near its lows for the day. Chart 1 shows the S&P 500 edging...
READ MORE
MEMBERS ONLY
DOLLAR WEAKNESS CONTRIBUTES TO CRB BREAKOUT -- SMALL CAPS AND TRANSPORTS APPEAR SET TO BREAK OUT NEXT WEEK -- S&P 500 BOUNCES IMPRESSIVELY OFF H&S NECKLINE -- MORE BULLISH WEEKLY SIGNS
by John Murphy,
Chief Technical Analyst, StockCharts.com
CRB INDEX HITS EIGHT-MONTH HIGH... I wrote on Thursday that a falling US Dollar Index was bullish for commodities (and stocks tied to commodities). Chart 1 shows the USD hitting another eight-month low on Friday. Right on cue, the CRB Commodity Index broke out to a new eight-month high on...
READ MORE
MEMBERS ONLY
NASDAQ HOLDS BREAKOUT AS RESISTANCE TURNS SUPPORT -- NECKLINE RESISTANCE TURNS SUPPORT FOR S&P 500 -- RETAILERS SHOW RELATIVE STRENGTH THROUGHOUT SEPTEMBER -- SEMIS SPRING TO LIFE AND LEAD MARKET HIGHER -- NET NEW HIGHS REACH HIGHEST LEVEL SINCE APRIL
by John Murphy,
Chief Technical Analyst, StockCharts.com
NASDAQ HOLDS BREAKOUT AS RESISTANCE TURNS SUPPORT... Link for todays video. The Nasdaq broke above its July-August highs with the September surge and broken resistance turned into support this week. After breaking resistance around 2300, chart 1 shows the index pulling back mid week and then surging on Friday. Broken...
READ MORE
MEMBERS ONLY
NO DOW THEORY BUY SIGNAL YET -- TRANSPORTS HAVEN'T CLEARED AUGUST HIGH -- SMALL CAPS HAVEN'T BROKEN OUT EITHER -- S&P 500 RETESTS NECKLINE SUPPORT -- FALLING US RATES HURT DOLLAR
by John Murphy,
Chief Technical Analyst, StockCharts.com
DOW TRANSPORTS HAVEN'T BROKEN... A lot has been written about the recent upside breakout in several market indexes. Unfortunately, the upside breakout took place on relatively light volume and hasn't shown much follow-through. I suspect that part of the reason for the lack of bullish follow-through...
READ MORE
MEMBERS ONLY
SEMIS CONTINUE TO LAG BROADER MARKET -- DOLLAR AND GOLD DECOUPLE AS DOLLAR PLUNGES -- DOLLAR MOVES TO OVERSOLD LEVELS WITH SHARP DECLINE -- OIL WEAKENS EVEN AS DOLLAR FALLS -- LONG BOND ETF BREAKS SHORT-TERM RESISTANCE
by John Murphy,
Chief Technical Analyst, StockCharts.com
SEMIS CONTINUE TO LAG BROADER MARKET... Link for todays video. The Semiconductor HOLDRS (SMH) stands out as a clear laggard over the last few months. Most broad market indices moved above their summer highs, but SMH did not even come close. In addition, note that the Networking iShares (IGN), the...
READ MORE
MEMBERS ONLY
SPY BREAKS ABOVE NECKLINE RESISTANCE -- BEARS MAY SEE AN ABC CORRECTION UNFOLDING -- IWM CHALLENGES DOUBLE BOTTOM RESISTANCE -- FINANCE AND SMALL-CAPS LEAD THE CHARGE -- SHANGHAI COMPOSITE LAGS IN SEPTEMBER -- HOMEBUILDERS SPDR FORMS BULL FLAG
by John Murphy,
Chief Technical Analyst, StockCharts.com
SPY BREAKS ABOVE NECKLINE RESISTANCE... Link for todays video. There are some classic chart patterns at work in the major index ETFs. First, the S&P 500 ETF (SPY) has an inverse head-and-shoulders pattern that is being confirmed with todays advance. This pattern is also present in the Nasdaq...
READ MORE
MEMBERS ONLY
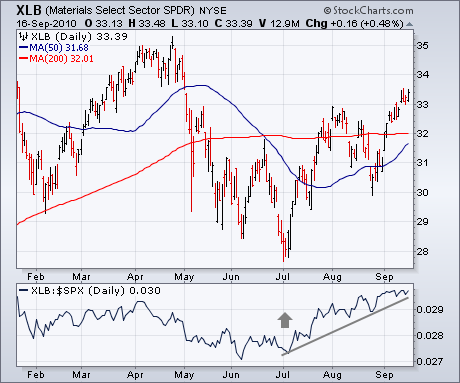
BASIC MATERIALS LEAD MARKET RALLY
by John Murphy,
Chief Technical Analyst, StockCharts.com
I wrote on Tuesday that strength in foreign currencies (especially commodity currencies like the Aussie and Canadian Dollars) was negative for the U.S. Dollar but positive for most commodities. One reason for that view is that stronger foreign currencies suggest growing confidence in the global economy. Another sign of...
READ MORE
MEMBERS ONLY
OFFENSIVE SECTORS LEAD SEPTEMBER SURGE -- XLY STILL OUTPERFORMING THE MARKET -- XLF FALLS SHORT OF RESISTANCE -- XLI FORMS LARGE RISING WEDGE -- XLK SHOWS SERIOUS RELATIVE STRENGTH THIS WEEK -- NYSE PERCENT ABOVE 200-DAY HITS RESISTANCE
by John Murphy,
Chief Technical Analyst, StockCharts.com
OFFENSIVE SECTORS LEAD SEPTEMBER SURGE... Link for todays video. Leadership from the four key offensive sectors makes the September surge all the more impressive. Consumer discretionary, finance, technology and industrials are considered the offensive sectors. Leadership from at least 2 of the 4 is needed for a rally to have...
READ MORE
MEMBERS ONLY
BASIC MATERIALS LEAD MARKET RALLY ON WEAKER DOLLAR AND STRONGER COMMODITIES -- FREEPORT MCMORAN COPPER & GOLD TRACKS RISING COPPER PRICE -- MARKET INDEXES TEST AUGUST HIGH AS WEEKLY MACD LINES TURN POSITIVE
by John Murphy,
Chief Technical Analyst, StockCharts.com
BASIC MATERIALS LEAD MARKET RALLY... I wrote on Tuesday that strength in foreign currencies (especially commodity currencies like the Aussie and Canadian Dollars) was negative for the U.S. Dollar but positive for most commodities. One reason for that view is that stronger foreign currencies suggest growing confidence in the...
READ MORE
MEMBERS ONLY
SMALL-CAPS AND TECHS LEAD MARKET HIGHER -- HEALTHCARE SPDR EXCEEDS SUMMER HIGHS -- AMGEN, J&J AND PFIZER PROPEL HEALTHCARE HIGHER -- RISK-ON TRADE RULES WITH RISING EURO -- BONDS TEST SUPPORT WITH SEPTEMBER DOWNSWING
by John Murphy,
Chief Technical Analyst, StockCharts.com
SMALL-CAPS AND TECHS LEAD MARKET HIGHER... Link for todays video. Buying pressure continued on Wednesday with the Russell 2000 ETF (IWM) and the Nasdaq 100 ETF (QQQQ) leading the major indices higher. John Murphy wrote about the S&P 500 testing neckline resistance yesterday. Today, the Nasdaq 100 ETF...
READ MORE
MEMBERS ONLY
FOREIGN SHARES HAVE ALREADY EXCEEDED SUMMER HIGHS AND ARE PULLING US STOCKS HIGHER -- EMERGING MARKETS ARE EVEN STRONGER LED BY INDIA, BRAZIL, AND CHINA -- AUSSIE DOLLAR HITS 52-WEEK HIGH -- NASDAQ 100 CLEARS AUGUST HIGH
by John Murphy,
Chief Technical Analyst, StockCharts.com
FOREIGN STOCKS LEAD US HIGHER... One of the reasons I've turned more bullish on the U.S. stock market is the relatively strong performance in foreign shares. Look at Chart 1 which compares EAFE Index iShares (red line) to the S&P 500 (green line) over the...
READ MORE
MEMBERS ONLY
GOLD HITS RECORD HIGH -- SILVER IS VERY CLOSE TO DOING THE SAME -- GOLD MINERS ETF BREAKS OUT -- SILVER STOCKS PLAY CATCHUP -- SEVERAL GOLD STOCKS STILL PRESENT VALUE -- RISING SILVER/GOLD RATIO IS GOOD FOR STOCK MARKET
by John Murphy,
Chief Technical Analyst, StockCharts.com
PRECIOUS METAL BREAKOUTS ... I've devoted the last two Tuesday's to bullish articles on precious metals. This Tuesday is no exception. That's because precious metal assets are surging through important resistance barriers today to achieve bullish breakouts. Chart 1 shows the Gold Trust Shares (GLD)...
READ MORE
MEMBERS ONLY
QQQQ AND SPY SURGE INTO RESISTANCE -- SMALL-CAPS AND NASDAQ START SHOWING LEADERSHIP -- FINANCE SECTOR LEADS THE CHARGE -- JPM, GS AND MS SURGE TOWARDS RESISTANCE -- SEMIS BATTLE BROKEN SUPPORT ZONE -- AMKR AND XLNX SURGE OFF SUPPORT
by John Murphy,
Chief Technical Analyst, StockCharts.com
QQQQ AND SPY SURGE INTO RESISTANCE... Link for todays video. Chart 1 shows the Nasdaq 100 ETF (QQQQ) gapping higher on Monday and moving into a resistance zone from the June-August highs. With todays advance, the ETF is up around 3.5% from its August closing lows. Also notice that...
READ MORE
MEMBERS ONLY
S&P 500 GRAVITATES TOWARDS RANGE RESISTANCE -- STOCKS AND METALS SHINE WITH RISK-ON TRADE -- INDUSTRIAL METALS INDEX EXCEEDS AUGUST HIGH -- SHANGHAI INDEX TRACES OUT ASCENDING TRIANGLE -- OIL BOUNCES OFF CONSOLIDATION SUPPORT
by John Murphy,
Chief Technical Analyst, StockCharts.com
S&P 500 GRAVITATES TOWARDS RANGE RESISTANCE... Link for todays video. The markets continue to move from risk-on to risk-off market modes over the last few months. Swings in the stock market appear to be a major factor in these mood swings. Chart 1 shows the S&P...
READ MORE
MEMBERS ONLY
S&P 500 NEEDS MORE VOLUME TO CLEAR OVERHEAD RESISTANCE -- BOND YIELDS ARE STILL IN DOWNTREND BUT LOOK OVERSOLD -- THAT COULD LEAD TO HIGHER YIELDS -- BOND FUND TESTS SUPPORT LINE
by John Murphy,
Chief Technical Analyst, StockCharts.com
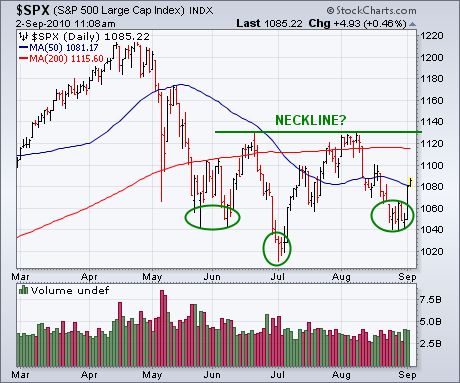
S&P 500 MOVES UP TO CHALLENGE 200-DAY LINE... My message from last Thursday described a potential "head and shoulders" bottom forming in the S&P 500 with the August low looking like a "right shoulder". That potentially bullish pattern suggests that the market...
READ MORE
MEMBERS ONLY
IWM HITS RESISTANCE AND STALLS -- SETTING FIRST SUPPORT LEVELS FOR DIA AND QQQQ -- SEMIS BATTLE NEW RESISTANCE ZONE -- INTC AND AMAT SHOW RELATIVE WEAKNESS -- AMTL AND CY SHOWS RELATIVE STRENGTH -- EURO UNDER PRESSURE AS SOVEREIGN DEBT ISSUES RETURN
by John Murphy,
Chief Technical Analyst, StockCharts.com
IWM HITS RESISTANCE AND STALLS ... Link for todays video. Despite leading the market lower the last few months, small-caps led the market higher over the last two weeks. However, chart 1 shows the Russell 2000 ETF (IWM) running into resistance around 64 over the last few days. Resistance in this...
READ MORE
MEMBERS ONLY
SILVER LEADS TEST OF 2010 HIGHS AND IS STARTING TO OUTPERFORM GOLD -- THAT MAY GIVE A BOOST TO SILVER STOCKS LIKE CDE, HL, AND PAAS -- NEWMONT MINING NEARS RECORD HIGH IN GOLD GROUP -- MARKET VECTORS GOLD INDEX NEARS UPSIDE BREAKOUT
by John Murphy,
Chief Technical Analyst, StockCharts.com
SILVER LEADS TEST OF 2010 HIGHS... I wrote a bullish message on precious metal assets last Tuesday which showed gold and silver prices nearing test of their 2010 high. That test has come a bit sooner for silver. Chart 1 shows Gold Trust Shares moving closer to its June high...
READ MORE
MEMBERS ONLY
IS A HEAD AND SHOULDERS BOTTOM FORMING IN STOCK?
by John Murphy,
Chief Technical Analyst, StockCharts.com
Today's message is going to represent a shift in emphasis in favor of stocks. As you know, I've been writing since the spring about the huge move into bonds and out of stocks owing to fears of economic slowdown and deflation. I've also written...
READ MORE
MEMBERS ONLY
YIELDS RISE AND BONDS FALL ON JOBS REPORT -- SMALL-CAPS START SHOWING RELATIVE STRENGTH -- UTILITIES UNDER PRESSURE AS RATES SURGE -- XLB AND XLY ARE ALREADY CHALLENGING SUMMER HIGHS -- SPY AND DIA HOLD WEDGE BREAKOUTS
by John Murphy,
Chief Technical Analyst, StockCharts.com
YIELDS RISE AND BONDS FALL ON JOBS REPORT... Link for todays video. A better-than-expected employment report combined with positive revisions to July weighed on bonds. Bonds surged in August as the double-dippers took center stage. Sign of weakness in the economy favor lower interest rates and lose monetary policy. Todays...
READ MORE
MEMBERS ONLY
WITH FOUR-YEAR CYCLE BOTTOM DUE IN SECOND HALF OF YEAR, IT MIGHT NOT BE TOO SOON TO START REALLOCATING SOME FUNDS OUT OF BONDS AND INTO STOCKS -- SO IS THE FACT THAT A HEAD AND SHOULDERS BOTTOM MAY BE FORMING IN THE S&P 500
by John Murphy,
Chief Technical Analyst, StockCharts.com
IS A HEAD AND SHOULDERS BOTTOM FORMING IN STOCK?... Today's message is going to represent a shift in emphasis in favor of stocks. As you know, I've been writing since the spring about the huge move into bonds and out of stocks owing to fears of...
READ MORE
MEMBERS ONLY
DIA AND QQQQ FILL THEIR GAPS WITH BREAKOUTS -- OFFENSIVE SECTORS GAP AND SURGE HIGHER -- EURO SURGES AS RISK-ON TRADE RESURFACES -- BONDS DECLINE AS MONEY FLEES SAFETY -- SHANGHAI COMPOSITE SHOWS RELATIVE STRENGTH -- EUROPEAN INDICES SURGE OVER 2%
by John Murphy,
Chief Technical Analyst, StockCharts.com
DIA AND QQQQ FILL THEIR GAPS WITH BREAKOUTS... Link for todays video. Stocks moved sharply higher on Wednesday with a broad advance that lifted most boats. All major indices were up sharply. All sectors were higher with the biggest gains coming from industrials, energy, finance and consumer discretionary. Chart 1...
READ MORE
MEMBERS ONLY
GOLD AND SILVER PRICES CONTINUE TO RALLY -- MARKET VECTORS GOLD MINERS INDEX MAY BE NEARING MAJOR BULLISH BREAKOUT -- BARRICK GOLD NEARS 52-WEEK HIGH-- GOLD SHARES ARE STARTING TO OUTPACE BULLION
by John Murphy,
Chief Technical Analyst, StockCharts.com
GOLD AND SILVER ETFS CONTINUE TO RISE... With stocks and most commodities on the defensive, money continues to move into precious metal assets. As a result, gold and silver prices are higher again today. Chart 1 shows the Gold Trust Shares (GLD) approaching a test of their summer highs. Chart...
READ MORE
MEMBERS ONLY
SMALL-CAPS LEAD MARKET LOWER -- GAPS MARK RESISTANCE FOR QQQQ, SPY AND DIA -- FINANCIALS CONTINUE TO WEIGH OVERALL -- SEMIS BUILD ON SUPPORT BREAK -- RETAILERS DRAG DOWN CONSUMER DISCRETIONARY SECTOR
by John Murphy,
Chief Technical Analyst, StockCharts.com
SMALL-CAPS LEAD MARKET LOWER... Link for todays video. Stocks moved broadly lower on Monday with small-caps leading the way. The Dow fell around 141 points to test the 10,000 mark at the close (-1.4%). The S&P 500 and Nasdaq were both down around 1.5%. The...
READ MORE
MEMBERS ONLY
RUSSELL 2000 ETF TESTS JULY LOW -- A LARGE HEAD-AND-SHOULDERS FOR XLF -- FALLING CHANNEL TARGET FOR XLY -- INTERNET ETFS HOVERING JUST ABOVE IMPORTANT SUPPORT -- NASDAQ AD LINE BREAKS JULY LOW -- NYSE NET NEW HIGHS DIP INTO NEGATIVE TERRITORY
by John Murphy,
Chief Technical Analyst, StockCharts.com
RUSSELL 2000 ETF TESTS JULY LOW ... Link for todays video. The Russell 2000 ETF (IWM) is the first of the major index ETFs to test its July low. We have been talking about relative weakness in small-caps and this is just further evidence. The Dow SPDR (DIA) and S&...
READ MORE
MEMBERS ONLY
RISING YEN HURTS JAPANESE MARKET -- RISING YEN MAY ALSO BE ADDING TO GLOBAL DEFLATION PRESSURE
by John Murphy,
Chief Technical Analyst, StockCharts.com
RISING YEN PUSHES NIKKEI TO NEW LOW... A rising Japanese yen is normally bad for Japanese stocks. Chart 1 demonstrate their inverse relationship. It shows the the Nikkei 225 (orange line) falling below 9000 for the first time in more than year which makes it the weakest of the world&...
READ MORE
MEMBERS ONLY
EXPANDING ON THE RISK-ON RISK-OFF TRADE -- WHAT ARE BONDS TELLING THE MARKET? -- OIL AND GASOLINE POINT TO WEAK DEMAND -- BASE METALS ETF BACKS OFF RETRACEMENT RESISTANCE -- SILVER BREAKS TRIANGLE RESISTANCE
by John Murphy,
Chief Technical Analyst, StockCharts.com
EXPANDING ON THE RISK-ON RISK-OFF TRADE... Link for todays video. John Murphy and I have been writing a lot on the movement away from risk in favor of relative safety. I showed a PerfChart on August 6th showing the beginnings of a shift from the risk-on trade to risk-off trade....
READ MORE
MEMBERS ONLY
NEGATIVE DOW THEORY TRENDS -- TRANSPORTS LEAD INDUSTRIALS LOWER AS BOTH NEAR DOW THEORY SELL SIGNAL -- UTILITIES OUTPERFORM INDUSTRIALS AND TRANSPORTS WHICH IS ANOTHER SIGN OF WEAKNESS
by John Murphy,
Chief Technical Analyst, StockCharts.com
TRANSPORTS LEAD INDUSTRALS LOWER ... We've been writing about a lot of negative stock market signals of late which include bearish chart action, as well as recent rotations out of small caps and technology and into traditionally defensive groups (that pay dividends). This morning's message will focus...
READ MORE
MEMBERS ONLY
A BEARISH ABC COUNT FOR THE S&P 500 -- DEFINING THE CURRENT DOWNSWING -- DEFENSIVE SECTORS SHOW RELATIVE STRENGTH -- HEALTHCARE, UTILITIES AND CONSUMER STAPLES EDGE HIGHER -- FINANCE SECTOR CONTINUES TO LEAD LOWER
by John Murphy,
Chief Technical Analyst, StockCharts.com
A BEARISH ABC COUNT FOR THE S&P 500 ... Link for todays video. It is time to open Pandoras box with some Elliott Wave analysis of the S&P 500. To smooth the data and filter out the noise, I am using a 5-day exponential moving average for...
READ MORE
MEMBERS ONLY
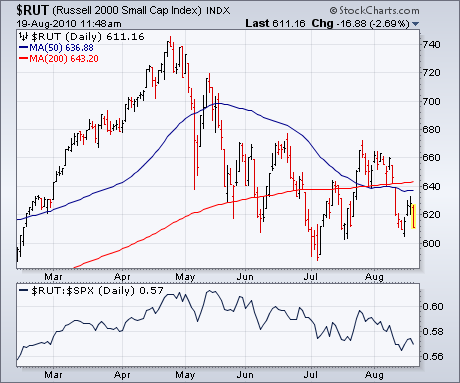
SMALL CAPS AND NASDAQ SHOW RELATIVE WEAKNESS
by John Murphy,
Chief Technical Analyst, StockCharts.com
It's usually a bad omen for the market when small caps and technology stocks are underperforming -- as they're doing at present. Chart 1 shows the Russell 2000 Small Cap Index trading closer to its July low than its July high. Its falling relative strength line...
READ MORE
MEMBERS ONLY
QQQQ REMAINS ON P&F SELL SIGNAL -- SPY FAILS AT P&F RESISTANCE -- IWM TESTS P&F SUPPORT -- PERIPHERAL EUROPEAN INDICES LEADING THE WAY LOWER -- CORE EUROPEAN INDICES FAIL AT RESISTANCE -- EURO WEIGHS ON MARKETS WITH SHARP DECLINE
by John Murphy,
Chief Technical Analyst, StockCharts.com
QQQQ REMAINS ON P&F SELL SIGNAL... Link for todays video. The Nasdaq 100 ETF (QQQQ), S&P 500 ETF (SPY) and Russell 2000 ETF (IWM) capture three important market segments. QQQQ captures technology, IWM reflects the performance of small-caps. SPY covers large-caps and the broader market). As...
READ MORE
MEMBERS ONLY
S&P 500 STILL ON SHORT-TERM SELL SIGNAL -- SMALL CAPS AND NASDAQ ARE LEADING MARKET LOWER -- SO IS THE SEMICONDUCTOR INDEX -- FALLING BOND YIELDS CONTINUE TO PULL STOCKS AND MOST COMMODITIES (EXCEPT FOR GOLD) LOWER
by John Murphy,
Chief Technical Analyst, StockCharts.com
S&P 500 STILL ON SHORT-TERM SELL SIGNAL ... The last chart I showed on Tuesday was an hourly bar chart of the S&P 500 with Fibonacci lines drawn over the price. The point of the chart was to show where overhead resistance was likely to appear. [That&...
READ MORE
MEMBERS ONLY
ISLAND REVERSALS VIE FOR SHORT-TERM TREND -- HEAD-AND-SHOULDERS PATTERN REMAINS FOR LONG-TERM -- GOLD EXTENDS AUGUST SURGE AS SILVER HITS RESISTANCE -- GOLD:SILVER RATIO MOVING INVERSE TO STOCKS -- A TWIST ON FOSBACKS HIGH LOW LOGIC INDEX
by John Murphy,
Chief Technical Analyst, StockCharts.com
ISLAND REVERSALS VIE FOR SHORT-TERM TREND IN SPY... Link for todays video. Even though the month is barely half over, August is full of gaps. Chart 1 shows August starting with a big gap up as the S&P 500 ETF (SPY) surged above 112 to start the month....
READ MORE
MEMBERS ONLY
DIVIDEND ISHARES OFFER DEFENSIVE PROTECTION -- DVY LEADERS INCLUDE ENTERGY, CENTURYLINK, MCDONALDS, KIMBERLY CLARK, AND CLOROX -- GOLD LEADERS ARE ELDORADO AND IAMGOLD
by John Murphy,
Chief Technical Analyst, StockCharts.com
SELECT DIVIDEND ISHARES SHOW RELATIVE STRENGTH... My last message suggested that dividend paying stocks (especially telecom and utilities) offered defensive protection in a slowing economy with falling interest rates. The DJ Select Dividend Index Fund (DVY) offers a simple way to take advantage of that dividend benefit. Chart 1 shows...
READ MORE
MEMBERS ONLY
SEMICONDUCTORS HOLDRS TESTS RANGE SUPPORT -- ADI, INTC AND TXN TESTS AS WELL -- BOND ADVANCE LOOKS PARABOLIC -- OIL AND GASOLINE ETFS FORM BEARISH WEDGE -- STRONG YEN HURTS JAPANESE EQUITIES -- LOST DECADE FOR US AND JAPAN -- TSAR OF THE EMERGING MARKETS
by John Murphy,
Chief Technical Analyst, StockCharts.com
SEMICONDUCTORS HOLDRS TESTS RANGE SUPPORT... Link for todays video. The Semiconductors HOLDRS (SMH) defines the current state of unusual uncertainty in the stock market. Chart 1 shows SMH locked in a volatile trading range since early May. From low to high or high to low, the ETF has moved 10%...
READ MORE