MEMBERS ONLY
GOLD AND EURO RESUME NEGATIVE CORRELATION -- GOLD BREAKS WEDGE RESISTANCE -- TECHS AND SMALL-CAPS UNDERPERFORMING BROADER MARKET -- NDX PERCENT ABOVE 200-DAY SMA BREAKS 50% -- S&P 500 PERCENT ABOVE 50-DAY SMA BREAKS 50%
by John Murphy,
Chief Technical Analyst, StockCharts.com
GOLD AND EURO RESUME NEGATIVE CORRELATION... Link for todays video. For the most part, Gold and the Euro have been negatively correlated throughout 2010. Negative correlation means one rises when the other one falls and visa versa. Positive correlation means both rise or fall together. Chart 1 shows the Gold...
READ MORE
MEMBERS ONLY
DIVIDEND PAYING STOCKS LIKE UTILITIES AND TELECOM DO BETTER IN A DEFLATIONARY CLIMATE -- AT&T AND VERIZON LEAD TELECOM HOLDERS HIGHER -- GOLD NEARS UPSIDE BREAKOUT -- STOCKS ON SHORT-TERM SELL AS VIX TESTS OVERHEAD RESISTANCE
by John Murphy,
Chief Technical Analyst, StockCharts.com
STOCK DIVIDENDS ARE MORE ATTRACTIVE WHEN RATES TUMBLE ... I've read a lot of articles recently about which asset classes (or stock groups) do best in a deflationary environment. In past market messages (which warned of the deflationary threat), I've explained that two asset classes that usually...
READ MORE
MEMBERS ONLY
STOCKS RETHINK FED POLICY STATEMENT -- XLF AND XLY GAP DOWN FROM RESISTANCE -- HEAD-AND-SHOULDERS REAPPEARS IN QQQQ -- SHORT-TERM RATES HIT RECORD LOW -- HOW LOW FOR THE 10-YEAR TREASURY YIELD? -- MOVING FROM RISK-ON TO RISK-OFF
by John Murphy,
Chief Technical Analyst, StockCharts.com
STOCKS RETHINK FED POLICY STATEMENT... Link for todays video. After bouncing yesterday afternoon, stocks opened sharply lower on Wednesday morning in what looks like a rethink of the Fed policy statement. The prospects of further quantitative easing and even lower interest rates may seem promising on the surface, but one...
READ MORE
MEMBERS ONLY
FED'S DECISION TO BUY GOVERNMENT DEBT BOOSTS BONDS AND HELPS KEEP STOCK UPTREND INTACT -- GOLD AND GOLD STOCKS RALLY -- VIX STILL IN DOWNTREND -- ELI LILLY ACHIEVES BULLISH BREAKOUT
by John Murphy,
Chief Technical Analyst, StockCharts.com
FED TO REINVEST MORTGAGE PROCEEDS IN LONG TERM TREASURIES... Although bond yields have been falling (and bond prices rising) for more than four months, bond traders still liked today's Fed announcement that it planned to reinvest mortgage proceeds into long-term Treasuries to increase the money supply and give...
READ MORE
MEMBERS ONLY
MAJOR INDEX ETFS HIT RESISTANCE -- CONSUMER DISCRETIONARY ADVANCES INTO RESISTANCE ZONE -- HOMEBUILDERS AFFIRM SUPPORT WITH SURGE -- RETAILER SPDR LIMPS HIGHER -- FINANCE SECTOR CHALLENGES RESISTANCE -- REGIONAL BANK SPDR BOUNCES OFF FLAG SUPPORT
by John Murphy,
Chief Technical Analyst, StockCharts.com
MAJOR INDEX ETFS RUN INTO RESISTANCE... Link for todays video. With the advance over the last five weeks, most major index ETFs are challenging resistance from their June highs and a key retracement zone. Chart 1 shows the Nasdaq 100 ETF (QQQQ) for starters. Resistance around 46-47.5 stems from...
READ MORE
MEMBERS ONLY
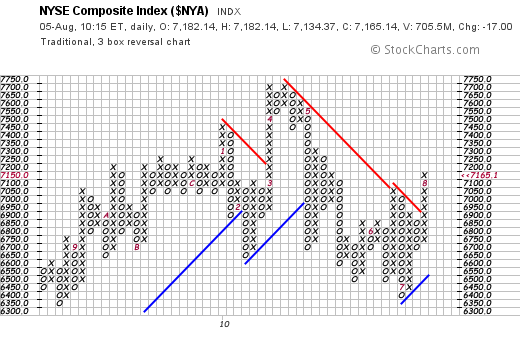
STOCK INDEXES IN P&F UPTRENDS
by John Murphy,
Chief Technical Analyst, StockCharts.com
One of the things I like best about poing & figure charts is their simplicity. Their strongest feature is that buy and sell signals are easier to spot than on bar or candlestick charts. A p&f chart shows alternating columns of X's and O's....
READ MORE
MEMBERS ONLY
10-YEAR TREASURY YIELD BREAKS JULY LOWS -- EURO AND YEN SURGE AFTER JOBS REPORT -- GOLD ETF SURGES AS DOLLAR FALLS -- SMH FORMS BEARISH ENGULFING AT RESISTANCE -- NYSE SUMMATION INDEX BOUNCES OFF LONG-TERM SUPPORT
by John Murphy,
Chief Technical Analyst, StockCharts.com
10-YEAR TREASURY YIELD BREAKS JULY LOWS... Link for todays video. Even though some of the economic reports were positive this week, the employment related reports on Thursday and Friday were decidedly negative. Initial jobless claims, a weekly statistic, rose on Thursday and Fridays non-farm payrolls showed 131,000 fewer jobs...
READ MORE
MEMBERS ONLY
POINT & FIGURE CHARTS ADD PRECISION AND SIMPLICITY TO TREND SIGNALS -- A P&F LOOK AT STOCKS, BONDS, COMMODITIES, AND CURRENCIES
by John Murphy,
Chief Technical Analyst, StockCharts.com
STOCK INDEXES IN P&F UPTRENDS... One of the things I like best about poing & figure charts is their simplicity. Their strongest feature is that buy and sell signals are easier to spot than on bar or candlestick charts. A p&f chart shows alternating columns of...
READ MORE
MEMBERS ONLY
ECONOMIC DATA LIFTS STOCKS AND SINKS BONDS -- MATERIALS, ENERGY AND INDUSTRIALS LEAD THE CHARGE -- HEALTHCARE SPDR SURGES ABOVE RESISTANCE -- BMY, PFE AND STJ LEAD HEALTHCARE SECTOR -- GOOGLE AND AMAZON POWER INTERNET ETF HIGHER
by John Murphy,
Chief Technical Analyst, StockCharts.com
ECONOMIC DATA LIFTS STOCKS AND SINKS BONDS... Link for todays video. Stocks started the day on a strong note after ADP Employer Services reported that companies added 42,000 jobs in July. The bulls were further bolstered with the ISM Services Index coming in well above 50 to show continued...
READ MORE
MEMBERS ONLY
EUROPEAN INDICES LEAD GLOBAL RALLY -- XLF BOUNCES OFF LONG-TERM SUPPORT AND CHALLENGES RESISTANCE -- REGIONAL BANKS CONTINUE TO LAG -- OIL AND OIL SERVICE STOCKS BREAK RESISTANCE -- STOCKS AND BONDS MOVE IN OPPOSITE DIRECTIONS
by John Murphy,
Chief Technical Analyst, StockCharts.com
EUROPEAN INDICES LEAD GLOBAL RALLY... Link for todays video. Banks led European stocks higher on Monday with most country indices gaining over 2%. Leadership from banks, such as Frances biggest (BNP Paribas), shows increased confidence in the European banking system. This confidence also facilitated a sharp rally in the Euro....
READ MORE
MEMBERS ONLY
BOND YIELDS CONTINUE TO DROP AS AGRICULTURALS LEAD COMMODITY RALLY -- STOCKS CONTINUE TO TEST RESISTANCE AT JUNE HIGH AND 200-DAY AVERAGES -- BULLISH PERCENT INDEXES TURN POSITIVE
by John Murphy,
Chief Technical Analyst, StockCharts.com
BOND RALLY CONTINUES... Bond prices of all categories rallied again this week. One bond ETF I've been tracking closely is the 20+Year T-bond iShares (TLT) which is shown in Chart 1. I recently wrote that the TLT needed a close below its early July low and its...
READ MORE
MEMBERS ONLY
NASDAQ BREADTH INDICATORS CHALLENGE RESISTANCE -- NYSE AD LINE AND NET NEW HIGHS BREAK RESISTANCE -- S&P 500 STALLS ABOVE TRENDLINE BREAK -- NATURAL GAS ETF COMES TO LIFE -- NATURAL GAS INDEX FOLLOWS THE S&P 500 -- CHESAPEAKE ENERGY CONSOLIDATES IN JULY
by John Murphy,
Chief Technical Analyst, StockCharts.com
NASDAQ BREADTH INDICATORS CHALLENGE RESISTANCE... Link for todays video. With the July surge, key breadth indicators for the Nasdaq are challenging resistance from their June highs - as is the Nasdaq itself. Chart 1 shows the Nasdaq as a 5-day EMA and 63-day EMA. Why these exponential moving averages? I...
READ MORE
MEMBERS ONLY
NASDAQ AND NY COMPOSITE HIT RESISTANCE -- A VOLATILE 16 WEEK PERIOD -- FINANCE AND SEMIS HIT RESISTANCE -- OIL AND GASOLINE ETFS FORM TRIANGLES -- EURO ETF HITS KEY RETRACEMENT -- EURO AND STOCKS ARE POSITIVELY CORRELATED
by John Murphy,
Chief Technical Analyst, StockCharts.com
NASDAQ AND NY COMPOSITE HIT RESISTANCE LEVELS... Link for todays video. Resistance from prior highs and key retracements is coming into play for the Nasdaq and NY Composite. Chart 1 shows the Nasdaq hitting resistance around 2300 with a stall over the last two days. Resistance in this zone stems...
READ MORE
MEMBERS ONLY
GOLD BREAKS CHART SUPPORT AS COMMODITIES WEAKEN -- STOCKS TEST JUNE HIGHS -- WATCHING THE LONG BOND FOR SIGNALS
by John Murphy,
Chief Technical Analyst, StockCharts.com
LONG BOND TESTS SUPPORT... I wrote last week that the long Treasury bond probably needed to break initial chart support to signal a stock market bottom (since they trend in opposite directions). Although Treasuries have pulled back this week (as stocks have risen), no short-term sell signal has been given...
READ MORE
MEMBERS ONLY
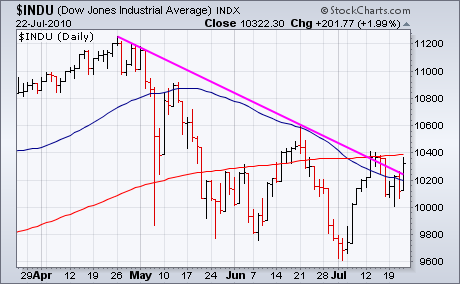
DOW INDUSTRIALS AND TRANSPORTS CHALLENGE JUNE HIGHS -- SMALL-CAPS TAKE THE LEAD ON THE UPSIDE -- HOMEBUILDERS EXTEND SURGE AS NEW HOME SALES EXPAND -- NYSE AD LINE BREAKS ABOVE JUNE HIGH -- NYSE NET NEW HIGHS SURGE TO 12 WEEK HIGH
by John Murphy,
Chief Technical Analyst, StockCharts.com
DOW INDUSTRIALS AND TRANSPORTS CHALLENGE JUNE HIGHS... Link for todays video. The Dow Industrials and Transports are leading the July charge as both challenge their June highs. Chart 1 shows the close-only line chart for the Dow Industrials. The senior Average broke its wedge trendline in mid July and traded...
READ MORE
MEMBERS ONLY
DOW AND NASDAQ CROSS BACK OVER 200-DAY LINES -- THAT INCREASES ODDS FOR SUMMER RALLY -- EMERGING MARKETS ARE LEADING RALLY -- % NYSE STOCKS TRADING OVER 200-DAY AVERAGE TURNS UP
by John Murphy,
Chief Technical Analyst, StockCharts.com
EMERGING MARKETS LEAD STOCK RALLY... A couple of months ago we were concerned that foreign stocks (and emerging markets in particular) were leading the U.S. stock market lower. That trend has reversed. Emerging markets are now leading us higher. Chart 1 shows Emerging Market iShares having already exceeded its...
READ MORE
MEMBERS ONLY
STOCK INDEXES BREAK DAILY DOWNTREND
by John Murphy,
Chief Technical Analyst, StockCharts.com
Stocks turned in a strong performance Thursday. The three major stock indexes shown below closed back over their 50-day moving averages. The S&P 500 (Chart 2) and the Nasdaq Composite (Chart 3) did so for the first time since early May. Another positive sign is the ability of...
READ MORE
MEMBERS ONLY
STOCK INDEXES BREAK THREE-MONTH DOWN TRENDLINE INCREASING ODDS FOR SUMMER BOUNCE -- THREE-MONTH HIGH IN COPPER IS ANOTHER SHORT-TERM POSITIVE FACTOR FOR STOCKS --
by John Murphy,
Chief Technical Analyst, StockCharts.com
STOCK INDEXES BREAK DOWN TRENDLINE... Stocks turned in a strong performance today. The three major stock indexes shown below closed back over their 50-day moving averages. The S&P 500 (Chart 2) and the Nasdaq Composite (Chart 3) did so for the first time since early May. Another positive...
READ MORE
MEMBERS ONLY
POSITIVE EARNINGS FORECASTS FROM AT&T, QUALCOMM, AND UPS BOOST STOCKS -- DOW TRANSPORTS AND NASDAQ 100 LEAD STOCK RALLY -- UPSIDE BREAKOUT IN COPPER BOOSTS FREEPORT MCMORAN COPPER & GOLD
by John Murphy,
Chief Technical Analyst, StockCharts.com
THREE EARNINGS LEADERS... The three stocks shown below are rallying sharply on increased profit forecasts and are giving a big boost to stocks. Chart 1 shows AT&T jumping 3% to the highest level in three months. Chart 2 shows Qualcomm gapping up 8% to a three month high...
READ MORE
MEMBERS ONLY
BERNANKE'S COMMENT SINKS STOCKS -- BONDS CONTINUE RALLY -- VIX HOLDS SUPPORT
by John Murphy,
Chief Technical Analyst, StockCharts.com
MOVING AVERAGES PROVIDE RESISTANCE... [Arthur Hill is off today]. Mr. Bernanke's comment that the U.S. economic outlook is "unusually uncertain" contributed to afternoon selling of stocks and buying of bonds. The first three charts show that moving average lines are acting as resistance barriers over...
READ MORE
MEMBERS ONLY
STOCKS RECOVER FROM EARLY DROP -- COMMODITIES REBOUND WITH STOCKS -- GOLD AND GOLD STOCKS BOUNCE OFF CHART SUPPORT
by John Murphy,
Chief Technical Analyst, StockCharts.com
MARKET INDEXES ACHIEVE UPSIDE REVERSAL... Stocks turned in a reasonably impressive performance today. After trading lower this morning, the major stock indexes closed higher. Although volume wasn't that heavy, it did pick up a bit from yesterday. That turned what started out as a potentially ugly day into...
READ MORE
MEMBERS ONLY
IBM AND CHIP STOCKS LEAD MARKET LOWER -- SEMICONDUCTOR INDEX THREATENS 200-DAY AVERAGE -- NASDAQ 100 IS IN DANGER OF DEATH CROSS -- CORPORATE BONDS PAY HIGHER YIELDS BUT TREASURIES ARE SAFER
by John Murphy,
Chief Technical Analyst, StockCharts.com
FORMER TECH LEADERS GAP DOWN TODAY... The technology sector is leading the market lower today. Two of the big reasons for that is sharply lower openings in two large tech stocks that had been former leaders. Chart 1 shows IBM gapping down 5% this morning and trading below its 50-day...
READ MORE
MEMBERS ONLY
FINANCIALS FAIL AT RESISTANCE AND SHOW RELATIVE WEAKNESS -- UTILITIES SPDR CONTINUES TO SHOW RELATIVE STRENGTH -- TIP AND GLD WEAKEN TOGETHER -- JAPAN FOLLOWS US, BUT CHINA GETS A BIG BOUNCE -- NATURAL GAS ETFS FORM FALLING CHANNELS
by John Murphy,
Chief Technical Analyst, StockCharts.com
FINANCIALS FAIL AT RESISTANCE AND SHOW RELATIVE WEAKNESS ... Link for todays video. Relative weakness in the finance sector weighed heavily on the market last week. All nine sectors and the S&P 500 were down for the week, but the finance sector was the only sector to loose over...
READ MORE
MEMBERS ONLY
STOCKS MOVE SHARPLY LOWER TO AFFIRM RESISTANCE ZONES -- BREADTH INDICATORS REMAIN BEARISH OVERALL -- RISING EURO WEIGHS ON GOLD -- GOLD BREAKS WEDGE SUPPORT -- VOLATILITY INDICES TEST IMPORTANT SUPPORT ZONES
by John Murphy,
Chief Technical Analyst, StockCharts.com
STOCKS MOVE SHARPLY LOWER TO AFFIRM RESISTANCE ZONES... Link for todays video. After an eight week advance that pushed the S&P 500 up over 7%, stocks moved sharply lower in early trading on Friday. The day is still young, but the S&P 500 is down almost...
READ MORE
MEMBERS ONLY
SOME FED GOVERNORS ARE WORRIED ABOUT DEFLATION -- NEGATIVE PPI DOESN'T HELP -- FALLING BOND YIELDS CAST DOUBT ON RECENT STOCK BOUNCE
by John Murphy,
Chief Technical Analyst, StockCharts.com
JUNE MINUTES SHOW DEFLATION FEAR ... Wednesday's market bounce stalled on release of the Fed's June minutes that lowered the estimate for the U.S. economy for the balance of the year. Also reported was a number of Fed governors that expressed concern about the growing threat...
READ MORE
MEMBERS ONLY
SPY AND DIA STALL NEAR RESISTANCE ZONES -- SEMICONDUCTORS HOLDRS SURGES TO RESISTANCE -- INTEL LEADS AS APPLE LAGS -- FINANCE SPDR AND REGIONAL BANK SPDR HIT RESISTANCE -- BASE METALS ETF BACKS OFF RESISTANCE
by John Murphy,
Chief Technical Analyst, StockCharts.com
SPY AND DIA STALL NEAR RESISTANCE ZONES... Link for todays video. After a big surge the last six days, stocks took a breather with mixed action on Wednesday. The Nasdaq edged higher, but the S&P 500 and Russell 2000 were lower on the day. Chart 1 shows the...
READ MORE
MEMBERS ONLY
KEY RETRACEMENTS COME INTO PLAY FOR DIA AND SPY -- IWM STALLS WITH SHORTER RETRACEMENT -- SMALL-CAPS AND MID-CAPS SHOW RELATIVE WEAKNESS -- OIL HITS RESISTANCE IN 50-62% RETRACEMENT ZONE -- OIL AND STOCKS CONTINUE MOVING TOGETHER
by John Murphy,
Chief Technical Analyst, StockCharts.com
KEY RETRACEMENTS COMING INTO PLAY FOR DIA AND SPY... Link for todays video. There are at least two trends present in the current market: a medium-term downtrend since late April and a short-term uptrend since last week. With the bigger trend down, this short-term uptrend is considered a corrective move...
READ MORE
MEMBERS ONLY
DOW DOWNTREND IS CLEAR WITH SHORT EMA -- DOW THEORY MOVES INTO BEAR MODE -- KEY SECTORS REMAIN IN DOWNTRENDS -- BREADTH INDICATORS HAVE YET TO REVERSE COURSE -- DOLLAR FINDS SUPPORT NEAR RETRACEMENTS -- GOLD AND SILVER TEST IMPORTANT SUPPORT ZONES
by John Murphy,
Chief Technical Analyst, StockCharts.com
DOW DOWNTREND IS CLEAR WITH SHORT EMA... A short exponential moving average offers the best of both worlds: price smoothing and sensitivity. May and June were volatile months for the stock market. The Dow moved within a 1400 point range in May and an 800 point range in June. Over...
READ MORE
MEMBERS ONLY
MORE HISTORY ON MOVING AVERAGE CROSSOVERS -- WHY EMA LINES ARE MORE RELIABLE -- THE DIRECTION OF THE 200-DAY MA IS ALSO IMPORTANT -- WEEKLY 13-34 EMA COMBO IS ALSO AT CRITICAL POINT -- PREDEFINED STOCK SCANS REFLECT NEGATIVE TREND
by John Murphy,
Chief Technical Analyst, StockCharts.com
THE 50-200 EMA COMBINATION WORKS BETTER... My Tuesday article on the significance of the "death cross" for the S&P 500 (when the 50-day average crosses below the 200-day) evoked a lot of messages and questions about the reliability of its signals. A number of readers correctly...
READ MORE
MEMBERS ONLY
FINANCE SECTOR LEADS MARKET REBOUND -- AXP, FITB AND PNC LEAD BANKS -- SEMICONDUCTOR HOLDRS BOUNCES OFF RANGE SUPPORT -- ALTR, BRCM AND XLNX LEAD SEMIS -- XLU CONTINUES TO SHOW RELATIVE STRENGTH -- AEP, CMS AND DUK LEAD UTILITIES
by John Murphy,
Chief Technical Analyst, StockCharts.com
FINANCE SECTOR LEADS MARKET REBOUND... Link for todays video. Stocks rebounded with a broad advance that lifted most boats. Advances led declines 6 to 1 on the NYSE and 3.5 to 1 on the Nasdaq. All major indices were up sharply. All sectors were higher with finance leading the...
READ MORE
MEMBERS ONLY
STOCKS BOUNCE WHILE GOLD AND THE DOLLAR SELLOFF -- DOLLAR SELLING BOOSTS FOREIGN ETFS -- AN IMPORTANT MOVING AVERAGE TEST IS TAKING PLACE
by John Murphy,
Chief Technical Analyst, StockCharts.com
GOLD AND DOLLAR DROP TOGETHER... I pointed out last Thursday the simultaneous drop in gold and the dollar, and the fact that both markets had fallen below their 50-day moving averages. I suggested that since both had risen together, it made sense that they should correct together. And they continue...
READ MORE
MEMBERS ONLY
VOLATILITY INDICES HOLD THEIR BREAKOUTS -- MATERIAL SPDRS AND BASE METALS ETF CONFIRM DOUBLE TOPS -- HOMEBUILDER ETFS TEST NOVEMBER LOWS -- XLK BREAKS NECKLINE SUPPORT -- SEMICONDUCTOR HOLDRS SHOWS RELATIVE STRENGTH
by John Murphy,
Chief Technical Analyst, StockCharts.com
VOLATILITY INDICES FORM HIGHER LOWS AFTER BREAKOUTS... Link for todays video. The volatility indices held their breakouts and resumed their uptrends with the stock market slide over the last two weeks. Because the S&P 500 Volatility Index ($VIX) and Nasdaq 100 Volatility Index ($VXN) can be rather, well,...
READ MORE
MEMBERS ONLY
GOLD TAKES A HIT AS DOLLAR DROPS -- GOLD STOCKS BACK OFF FROM OLD HIGHS -- SHORT-TERM TREND HAS WEAKENED FOR PRECIOUS METAL ASSETS
by John Murphy,
Chief Technical Analyst, StockCharts.com
GOLD AND SILVER BREAK 50-DAY LINES... Gold and silver prices took a hit today for the first time in awhile. So did precious metal stocks. Chart 1 and 2 show the Gold ETF (GLD) and Silver (SLV) falling an average of 4% today on very heavy volume. Both commodity ETFs...
READ MORE
MEMBERS ONLY
I'VE BEEN USING THE 1930S AS MY DEFLATION MODEL FOR THE LAST DECADE -- KONDRATIEFF WINTER HAS BEEN ON TARGET -- GOLD STOCKS AND DEFLATION
by John Murphy,
Chief Technical Analyst, StockCharts.com
GOLD AND DEFLATION... I'm going to be writing about deflation in this message, since that's the only model that seems to have worked over the last decade. But first, I'd like to respond to one of our reader's question about the performance...
READ MORE
MEMBERS ONLY
S&P 500 DECLINES FURTHER WITH A DANGEROUS DIVERGENCE -- BREAKING DOWN THE HEAD-AND-SHOULDERS IN THE S&P 500 -- AN ALTERNATIVE FALLING WEDGE FOR THE S&P 500 -- YEN AND SWISSY RISE IN THE FACE OF UNCERTAINTY
by John Murphy,
Chief Technical Analyst, StockCharts.com
S&P 500 DECLINES FURTHER WITH A DANGEROUS DIVERGENCE ... Link for todays video. After a hair-raising decline on Tuesday, the S&P 500 continued lower on Wednesday. Buyers are simply nowhere to be found ahead of Fridays employment report and the three day weekend. Chart 1 shows the...
READ MORE
MEMBERS ONLY
STOCKS AND COMMODITIES CONTINUE TO FALL AS BONDS RALLY -- ONCE AGAIN, FOREIGN STOCKS LEAD GLOBAL DECLINE -- MORE 200-DAY AVERAGES ARE BEING BROKEN -- REVIEW OF POTENTIAL DOWNSIDE TARGETS
by John Murphy,
Chief Technical Analyst, StockCharts.com
DOWNGRADE OF CHINA GROWTH CONTRIBUTES TO SELLING ... As has been the case since the market top in May, foreign stocks are leading the global retreat in stocks. Today's main headline was a downgrade in Chinese economic growth. That's not too much of a surprise to those...
READ MORE
MEMBERS ONLY
MOMENTUM TURNS BEARISH FOR MATERIALS SPDR -- A KEY TEST FOR THE STEEL ETF -- CONSUMER STAPLES LEAD MIXED MARKET -- TOBACCO STOCKS LEAD CONSUMER STAPLES HIGHER -- EURO ETF CONSOLIDATES AT RESISTANCE -- INTEREST RATES CONTINUE TO FALL
by John Murphy,
Chief Technical Analyst, StockCharts.com
MOMENTUM TURNS BEARISH FOR THE MATERIALS SECTOR... Link for todays video. The Materials SPDR (XLB) showed some relative weakness on Monday as the sector with the second largest loss (behind energy). Chart 1 shows XLB with a rather volatile range since late May. XLB tested the February low with two...
READ MORE
MEMBERS ONLY
SPY FORMS LOWER HIGH WITH WEEKLY REVERSAL -- NASDAQ AD VOLUME LINE FAILS TO BREAK RESISTANCE -- NYSE AD LINE FORMS LOWER HIGH AS SMALL-CAPS WEAKEN -- NET NEW HIGHS TURN NEGATIVE -- CONSUMER DISCRETIONARY AND FINANCE WEIGH ON MARKET
by John Murphy,
Chief Technical Analyst, StockCharts.com
SPY FORMS LOWER HIGH WITH WEEKLY OUTSIDE REVERSAL... Link for todays video. The long-term uptrend is in jeopardy after the major index ETFs reversed near key retracements and formed lower highs. Stocks peaked in April with the major index ETFs declining sharply in April-May. After battling support from the February...
READ MORE
MEMBERS ONLY
LINK BETWEEN BONDS AND STOCKS CHANGED IN 1998 -- FALLING BOND YIELDS ARE NOW BAD FOR STOCKS -- FALLING RETAIL STOCKS ARE ANOTHER SIGN OF WEAKNESS -- SO ARE DROPS IN HOME DEPOT AND LOWES -- 13 AND 34 DAY EMA LINES ARE STILL NEGATIVE
by John Murphy,
Chief Technical Analyst, StockCharts.com
WHY I WROTE SECOND INTERMARKET BOOK ... In my 1991 intermarket book, I wrote that bond and stock prices generally trended in the same direction. That meant that bond yields and stocks trended in opposite directions. In the three decades between the 1970s and 1990s, falling bond yields were good for...
READ MORE
MEMBERS ONLY
DIA TESTS BROKEN RESISTANCE -- SPY FAILS TO HOLD BREAKOUT -- BOND ETF BREAKS RESISTANCE -- DOLLAR DIPS AS EURO BOUNCES -- GERMANY AND THE NETHERLANDS LEAD EUROPEAN STOCKS -- FRANCE HITS RESISTANCE AS ENGLAND LAGS
by John Murphy,
Chief Technical Analyst, StockCharts.com
DIA TESTS BROKEN RESISTANCE... Link for todays video. The Fed left rates unchanged and indicated that it would continue to do so for an extended period of time. Nothing new here. The Fed also noted that the European debt crisis could have an adverse affect on US growth. Stocks finished...
READ MORE