MEMBERS ONLY
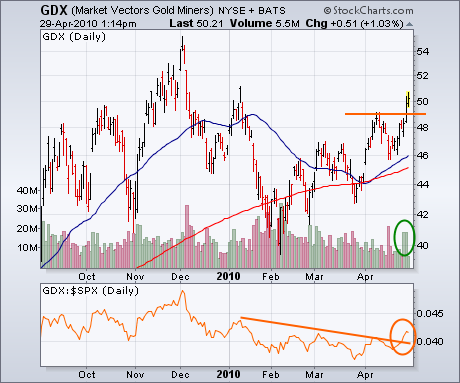
GOLD MINERS INDEX HITS THREE-MONTH HIGH
by John Murphy,
Chief Technical Analyst, StockCharts.com
Three Thursdays ago (April 8), I wrote about the upturn in the price of gold and gold stocks. At the time, gold was breaking through a bullish "neckline" in a head and shoulders bottom while the Gold Miners Index was breaking through its March high. On Tuesday, I...
READ MORE
MEMBERS ONLY
FINANCE SECTOR FEELS THE HEAT - TECH ETF BOUNCES OFF SUPPORT - SEMIS TEST SUPPORT- NEW HIGH IN AD LINE AFFIRMS BULL-RUN - AD LINE BEARISH DIVERGENCE PRECEDED 2007 PEAK - CORPORATE BONDS OUTPERFORMING TREASURIES - JUNK BOND ETF HITS NEW HIGH
by John Murphy,
Chief Technical Analyst, StockCharts.com
FINANCE SECTOR FEELS THE HEAT... Link for todays video. With Goldman Sachs under the congressional microscope, the finance sector has been under pressure the last two weeks. The S&P 500 ETF (SPY) hit a new 52-week high (closing) last Friday, but the Financials SPDR (XLF) peaked over a...
READ MORE
MEMBERS ONLY
GOLD MINERS INDEX SHOWS NEW LEADERSHIP -- NEWMONT AND SILVER WHEATON NEAR MAJOR UPSIDE BREAKOUTS -- MINERS BULLISH PERCENT INDEX ON BUY SIGNAL -- ENERGY BPI IS CLOSE TO ONE -- MOVING AVERAGE SUPPORT HAS HELD SO FAR FOR THE EFA AND NYSE INDEXES
by John Murphy,
Chief Technical Analyst, StockCharts.com
GOLD MINERS INDEX HITS THREE-MONTH HIGH ... Three Thursdays ago (April 8), I wrote about the upturn in the price of gold and gold stocks. At the time, gold was breaking through a bullish "neckine" in a head and shoulders bottom while the Gold Miners Index was breaking through...
READ MORE
MEMBERS ONLY
STOCKS FIRM AS FED STANDS PAT - S&P 500 AND NASDAQ FIND SUPPORT NEAR LAST WEEKS LOW - GOLD MINERS ETF SURGES TO THREE MONTH HIGH - PERFCHART REFLECTS WEAKNESS IN EUROPEAN PERIPHERY - SPAIN, ITALY AND PORTUGUESE INDICES BREAK DOWN
by John Murphy,
Chief Technical Analyst, StockCharts.com
STOCKS FIRM AS FED STANDS PAT... Link for todays video. There were no surprises from the Fed today. After a two day meeting, the FOMC issued its policy statement at 2:15 today. Fed officials voted to keep the Fed Funds target rate in its current range (0 to 0....
READ MORE
MEMBERS ONLY
S&P DOWNGRADES GREEK DEBT TO JUNK AND CAUSES PROFIT-TAKING IN STOCKS AND BUYING OF US BONDS -- GOLD BOUNCES AGAINST DOLLAR AND REACHES RECORD AGAINST THE EURO -- 20% JUMP IN THE VIX SHOWS THAT OPTION TRADERS ARE TURNING MORE CAUTIOUS ON STOCKS
by John Murphy,
Chief Technical Analyst, StockCharts.com
TREASURIES RALLY ... I wrote a message on April 17 to the effect that Treasury bond prices were starting to bounce from chart support (as yields were backing off from resistance at 4%), and suggested that a bounce in bond prices might cause a pullback in stocks. That's because...
READ MORE
MEMBERS ONLY
INDUSTRIALS AND CONSUMER DISCRETIONARY SECTORS POWER LATEST LEG - HIGH VOLUME MOVES FOR WHIRLPOOL AND CATERPILLAR - DOW ENTERS POSSIBLE FIFTH WAVE - PUT/CALL RATIO REACHES AN EXTREME
by John Murphy,
Chief Technical Analyst, StockCharts.com
INDUSTRIALS AND CONSUMER DISCRETIONARY SECTORS POWER LATEST LEG ... Link for todays video. Perfchart 1 shows the performance of the nine sector SPDRs since the last upswing began in early February. All nine sectors are up with five up double digits. The S&P 500 is up double digits with...
READ MORE
MEMBERS ONLY
EURO BOUNCES OFF PRIOR LOWS AS GREECE ACCEPTS AID - FALLING DOLLAR SPURS BUYING IN SILVER AND GOLD - OIL AND OIL-RELATED SHARES SURGE - BONDS TEST RESISTANCE AS FED CONSIDERS ASSET SALES - PERCENT OF STOCKS ABOVE 50-DAY LINES SURGES TO PRIOR HIGHS
by John Murphy,
Chief Technical Analyst, StockCharts.com
EURO BOUNCES OFF PRIOR LOWS AS GREECE ACCEPTS AID... Link for todays video. Debt-laden Greece formally requested assistance from the EU and IMF. News of possible bailout to help Greece get through the year lifted the Euro. Chart 1 shows the Euro ETF (FXE) finding support near the prior low...
READ MORE
MEMBERS ONLY
QQQQ AND SPY EXCEED CHANNEL TRENDLINES - SMH GIVES UP EARLY GAINS - GOLD HOLDS BREAKOUT ON WEEKLY CHART AND HITS RESISTANCE ON DAILY CHART - GOLD-DOLLAR RELATIONSHIP TURNS POSITIVE - SHANGHAI COMPOSITE LAGS OTHER BRIC COUNTRIES AND THE US
by John Murphy,
Chief Technical Analyst, StockCharts.com
QQQQ AND SPY EXCEED CHANNEL TRENDLINES... Link for todays video. The Nasdaq 100 ETF (QQQQ) and S&P 500 ETF (SPY) were featured with rising price channels in the March 29th Market Message. These channels are still there, but charts 1 and 2 shows these ETFs exceeding their upper...
READ MORE
MEMBERS ONLY
OIL SERVICE HOLDERS LEAD ENERGY SECTOR INTO ANOTHER TEST OF OLD HIGHS -- CONOCOPHILLIPS AND HALLIBURTON ARE ENERGY LEADERS -- STRONG CANADIAN DOLLAR IS GOOD FOR OIL PRICES -- SURGING LUMBER MARKET MAY HOLD GOOD NEWS FOR HOUSING SECTOR
by John Murphy,
Chief Technical Analyst, StockCharts.com
ENERGY SPDR TESTS JANUARY HIGH... One of the themes I've repeated over the past few weeks is that commodity-related stocks should start playing catchup to the rest of the market. I mentioned energy stocks in particular. After a modest dip last week, the energy sector is today'...
READ MORE
MEMBERS ONLY
MATERIALS SPDR BACKS OFF RESISTANCE - RISK-AVERSION TRADE RETURNS AS DOLLAR BOUNCES - EURO ETF RETURNS TO BROKEN TRENDLINE - ENERGY SPDR ALSO HITS RESISTANCE - OIL SERVICE HOLDRS FORMS LARGE DIAMOND
by John Murphy,
Chief Technical Analyst, StockCharts.com
MATERIALS SPDR BACKS OFF RESISTANCE ZONE... The Materials SPDR (XLB) is running into resistance on both the daily and weekly charts. First, chart 1 shows a long-term resistance zone from broken supports and the 62% retracement mark. Also note that XLB is up around 100% from its March 2009 low....
READ MORE
MEMBERS ONLY
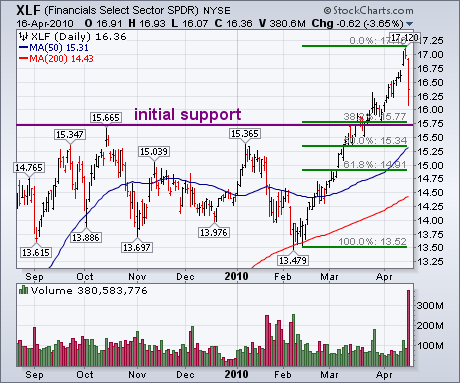
FINANCIALS FALL HEAVILY
by John Murphy,
Chief Technical Analyst, StockCharts.com
Financial stocks are considered to be leading indicators for the rest of the market. Over the last year, the group has led the market higher. Yesterday, they led it lower. The chart below shows the Financial SPDR (XLF) falling 3.6% on huge volume. The big volume is more serious...
READ MORE
MEMBERS ONLY
FINANCIAL DROP PULLS MARKET LOWER -- THE FACT THAT OVERSOLD TREASURY BOND PRICES ARE STARTING TO BOUNCE OFF CHART SUPPORT MAY ALSO SUGGEST THAT STOCKS ARE DUE FOR A PULLBACK
by John Murphy,
Chief Technical Analyst, StockCharts.com
GOLDMAN SACHS PLUNGES NEARLY 13%... The SEC sued Goldman Sachs on Friday for fraud in the mortage market. That shocking news caused the stock to plunge nearly 13% on huge trading volume. Chart 1 shows the chart damage. GS hasn't exactly been a market leader over the has...
READ MORE
MEMBERS ONLY
SECTOR RANKINGS SHOW BULLISH CONFIDENCE -- TOP 2010 PERFORMERS ARE FINANCIALS, DISCRETIONARY, SMALL CAPS, TRANSPORTS, AND THE NASDAQ -- DEFENSIVE GROUPS LAG BEHIND -- MARKET BREADTH REMAINS POSITIVE AS NYSE ADVANCE-DECLINE HITS RECORD HIGH
by John Murphy,
Chief Technical Analyst, StockCharts.com
GROUP LEADERSHIP SHOWS CONFIDENCE... The fact that major market indexes are hitting new recovery highs is a vote of confidence for the market and the economy. That's because the stock market is a leading indicator of the economy. What's also impressive is where market leadership is...
READ MORE
MEMBERS ONLY
SEMICONDUCTOR SURGE GIVES MARKET A BIG BOOST -- THAT'S MAY ALSO BE HELPING BULLISH BREAKOUT IN ASIA -- A WEAKER DOLLAR SHOULD ALLOW COMMODITIES (AND STOCKS TIED TO THEM) TO PLAY CATCHUP TO THE STOCK MARKET -- NATIONAL SEMICONDUCTOR BREAKS OUT
by John Murphy,
Chief Technical Analyst, StockCharts.com
SOX INDEX SOARS... Nearly two weeks ago (April 1) I showed the Semiconductor (SOX) Index breaking through its January high at 370 and noted that was giving a nice boost to technology shares and the market as whole. That positive effect is even more obvious today. Chart 1 shows the...
READ MORE
MEMBERS ONLY
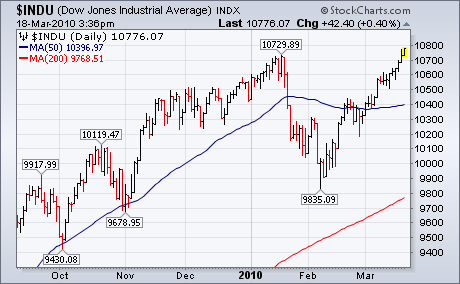
DOW 11000 DOESN'T HAVE MUCH TECHNICAL SIGNIFICANCE AND PROBABLY WON'T STOP THE DOW'S ADVANCE -- BUT CHART RESISTANCE IS VISIBLE BETWEEN 11200 AND 11600 -- KEEP AN EYE ON UPPER MONTHLY BOLLINGER BAND AS A POTENTIAL UPSIDE TARGET
by John Murphy,
Chief Technical Analyst, StockCharts.com
DOW REACHES 11000... A lot is being made in the media about the ability of the Dow Industrials to reach the 11,000 level which has led to a discussion as to whether or not that number means anything. That's what we'll try to determine here....
READ MORE
MEMBERS ONLY
EMERGING CURRENCIES HAVE BEEN RISING AGAINST THE DOLLAR -- EVEN THE CHINESE YUAN IS CLIMBING -- WHY RISING BOND YIELDS ARE GOOD FOR STOCKS AND BAD FOR TREASURIES -- OTHER BOND CATEGORIES ARE LESS RATE SENSITIVE
by John Murphy,
Chief Technical Analyst, StockCharts.com
EMERGING MARKET CURRENCIES ARE RISING... My Tuesday message repeated the view that the 2010 increase in the U.S. Dollar Index has masked gains in a lot of foreign currencies (mainly because of its heavy weighting in Europe and Japan). I showed February upturns in commodity-based currencies like the Aussie...
READ MORE
MEMBERS ONLY
GOLD AND GOLD MINERS INDEX TURN UP -- NEWMONT AND SILVER WHEATEN ARE GDX LEADERS -- BARRICK GOLD IS BREAKING OUT -- GOLD MINERS BULLISH PERCENT INDEX SHOWS MOST GDX STOCKS HAVE TURNED UP
by John Murphy,
Chief Technical Analyst, StockCharts.com
GLD COMPLETES H&S BOTTOM ... In last Thursday's message, I wrote a positive piece on commodity prices in general, and precious metals in particular (PRECIOUS METALS ARE TURNING UP). Part of my renewed optimism on the group was caused by the fact that silver had already turned...
READ MORE
MEMBERS ONLY
WHY COMMODITIES ARE STRONGER THAN THEY APPEAR WHILE THE DOLLAR IS WEAKER -- TOO MUCH FOCUS IS BEING PLACED ON THE WEAK EURO AND NOT ENOUGH ON RISING COMMODITY CURRENCIES
by John Murphy,
Chief Technical Analyst, StockCharts.com
DOLLAR STRENGTH COMES FROM EUROPE AND JAPAN ... In a message dated March 2, I expressed the view that the dollar wasn't as strong as it appeared to be. I also wrote that an upturn in commodity-based currencies would lend support to commodity prices. I'd like to...
READ MORE
MEMBERS ONLY
STRONG JOBS REPORT BOOSTS STOCKS AND COMMODITIES -- BUT TREASURY BONDS TUMBLE AS YIELDS SURGE --COMMODITY ETF TURNS UP -- GOLD AND ENERGY SHARES ARE BREAKING OUT -- PLATINUM LEADS PRECIOUS METALS HIGHER -- EMERGING MARKET ETF HITS NEW 2010 HIGH
by John Murphy,
Chief Technical Analyst, StockCharts.com
BOND YIELDS SURGE ON STRONG JOBS REPORT... There's good and bad news in Friday's strong jobs report. The bad news is that bond yields are surging. Chart 1 shows the 10-Year Treasury Note Yield (TNX surging to the highest level since last June and heading for...
READ MORE
MEMBERS ONLY
JUMP IN CHINESE SHARES BOOSTS COMMODITIES
by John Murphy,
Chief Technical Analyst, StockCharts.com
Stocks and commodity markets rallied on Thursday on news of an expansion in manufacturing in China, which is the world's biggest user of commodities. A few weeks back I wrote that weakness in Chinese shares was one of the factors weighing on commodity markets (along with a stronger...
READ MORE
MEMBERS ONLY
GROWTH IN CHINA -- AND HIGHER CHINESE STOCKS -- BOOSTS STOCKS AND COMMODITIES -- ENERGY AND PRECIOUS METALS ARE TURNING UP ALONG WITH THEIR SHARES -- SILVER IS LEADING GOLD HIGHER -- NYSE COMPOSITE AND SOX HIT NEW 2010 HIGHS
by John Murphy,
Chief Technical Analyst, StockCharts.com
JUMP IN CHINESE SHARES BOOSTS COMMODITIES ... Stocks and commodity markets are rallying today on news of an expansion in manufacturing in China, which is the world's biggest user of commodities. A few weeks back I wrote that weakness in Chinese shares was one of the factors weighing on...
READ MORE
MEMBERS ONLY
DOLLAR PULLS BACK WITHIN RISING CHANNEL - OIL AND GASOLINE CHALLENGE RESISTANCE - GOLD CHALLENGES FLAG/CHANNEL RESISTANCE - GOLD HOLDING UP BETTER THAN THE EURO - PLATINUM, SILVER AND COPPER MAINTAIN UPTRENDS
by John Murphy,
Chief Technical Analyst, StockCharts.com
DOLLAR PULLS BACK WITHIN RISING CHANNEL... Link for todays video. Wednesday is turning into a redux of Monday. The Euro advanced, the Dollar fell, oil bounced and commodities moved higher. Lets start with the Euro and the Dollar. Chart 1 shows the Euro ETF (FXE) within a clear downtrend defined...
READ MORE
MEMBERS ONLY
APPLYING PERCENTAGE BOX SIZES TO POINT & FIGURE CHARTS ON THE DOLLAR, COMMMODITIES, AND BOND ETFS
by John Murphy,
Chief Technical Analyst, StockCharts.com
USING PERCENT P&F BOX SIZE ... My recent point & figure articles have been limited to stock indexes and traditional box sizes. Some readers have asked about the use of "percentage" box sizes. I find percentage box sizes very helpful, especially when looking at financial markets other...
READ MORE
MEMBERS ONLY
SPY STALLS AT CHANNEL TRENDLINE - EURO GETS OVERSOLD BOUNCE - STRENGTH IN CHINA LIFTS CRUDE - ENERGY SECTOR RECOVERS AFTER SUPPORT BREAK - GOLD STALLS AFTER BIG SURGE
by John Murphy,
Chief Technical Analyst, StockCharts.com
SPY STALLS AT CHANNEL TRENDLINE ... Link for todays video. The S&P 500 ETF (SPY) and Nasdaq 100 ETF (QQQQ) are trading near the upper trendline of a rising price channel that extends back to August. I drew the lower trendline first, created a second parallel trendline and then...
READ MORE
MEMBERS ONLY
MARKET ADVANCE EXCEEDS 52 WEEKS - NET NEW HIGHS EXPAND IN MARCH - EARLY SIGNS OF RELATIVE WEAKNESS IN SMALLCAPS - IWM STALLS AS MACD ROLLS OVER - NASDAQ NET ADVANCES HIT HARD THIS WEEK - NYSE AD VOLUME LINE FORMS SMALL NEGATIVE DIVERGENCE
by John Murphy,
Chief Technical Analyst, StockCharts.com
MARKET ADVANCE EXCEEDS 52 WEEKS ... Link for todays video. Net New Highs on the NYSE and Nasdaq were exceptionally strong this month. This is hardly surprising considering that the current advance turned 1 year old in March. Perfchart 1 shows performance for the major indices since early March 2009. These...
READ MORE
MEMBERS ONLY
USE 45 DEGREE TRENDLINES TO FILTER P&F SIGNALS -- USING FIVE-BOX REVERSALS AS ADDITIONAL FILTER -- THE S&P 500 CONTINUES FIFTH WAVE ADVANCE WITH NO SIGN OF TOP -- NEXT POTENTIAL TARGET IS 1250 TO 1300 ZONE
by John Murphy,
Chief Technical Analyst, StockCharts.com
USING TRENDLINES AS FILTERS... I received so much feedback on my Tuesday point & figure message that I'd like to use this article to answer some of the questions and elaborate on the technique even further. My Tuesday message showed two versions of the Consumer Discretionary SPDR (using...
READ MORE
MEMBERS ONLY
DIA FORMS INSIDE DAY AT CHANNEL RESISTANCE - BONDS FALL SHARPLY ON RECORD TREASURY AUCTION - EURO EXTENDS DOWNTREND WITH SHARP DECLINE - DOLLAR ETF SURGES TO EIGHT MONTH HIGH - SURGING DOLLAR PUSHES GOLD BELOW 1100
by John Murphy,
Chief Technical Analyst, StockCharts.com
A STRANGE DAY INDEED... Link for todays video. Before getting to todays gap, I would like to start with an overview and observation. Stocks started the day weak and remained weak throughout the day. Eight of the nine sectors were down with healthcare and utilities leading the way lower. These...
READ MORE
MEMBERS ONLY
HOW TO SENSITIVE P&F CHARTS TO SUIT DIFFERENT TIME DIMENSIONS -- USER BIGGER BOX SIZES FOR MAJOR TRENDS AND SMALLER BOXES FOR SHORT-TERM TRADING SIGNALS
by John Murphy,
Chief Technical Analyst, StockCharts.com
CHANGE BOX SIZE TO VARY SENSITIVITY ... One of the things I like most about point & figure charts is the clarity and simplicity of their buy and sell signals. And you can adjust the charts to suit the time frame you're trading. Less sensitive charts lend themselves to...
READ MORE
MEMBERS ONLY
QQQQ SHRUGS OFF BEARISH ENGULFING - SEMIS LEAD TECHS - AMAT BREAKS TRIANGLE RESISTANCE - LRCX SURGES ON GOOD VOLUME - XLY HITS CHANNEL RESISTANCE - RETAIL ETF CONTINUES TO LEAD - VIX HITS COMPLACENCY LOW FROM MAY 2008
by John Murphy,
Chief Technical Analyst, StockCharts.com
QQQQ SHRUGS OFF BEARISH ENGULFING PATTERN ... Link for todays video. Many of the major index ETFs formed bearish engulfing patterns on Friday, but these were not confirmed with further weakness on Monday. A bearish engulfing pattern forms when the open is above the prior close and the close is below...
READ MORE
MEMBERS ONLY
DOW THEORY UPTREND IS CONFIRMED
by John Murphy,
Chief Technical Analyst, StockCharts.com
Dow Theory holds that the Dow Transports and Industrials must both hit new highs to confirm an ongoing bull market. The ability of the Dow Industrials to exceed their January high has done just that. That doesn't tell us how far the bull market will run, or for...
READ MORE
MEMBERS ONLY
EURO FAILS AT RESISTANCE - STRONG DOLLAR WEIGHS ON OIL - WEAKNESS IN OIL HITS ENERGY ETFS - GOLD FALLS ALONG WITH OIL - BOND ETFS CHALLENGE RESISTANCE - 10 CURRENCY PERFCHART - PESO HITS NEW HIGH
by John Murphy,
Chief Technical Analyst, StockCharts.com
EURO FAILS AT RESISTANCE... Link for todays video. Continued concerns with Greece weighed on the Euro as it failed at first resistance. Fundamentally, France and Germany do not agree (surprise, surprise) on the details of a rescue package. France favors a European solution, while Germany favors IMF involvement. Whatever the...
READ MORE
MEMBERS ONLY
NEW 2010 HIGH BY DOW INDUSTRIALS KEEPS DOW THEORY UPTREND INTACT -- UPS AND FDX LEAD TRANPORTS HIGHER -- RECENT DOW LEADERS INCLUDE CISCO, DUPONT, GE, INTEL, AND WALMART
by John Murphy,
Chief Technical Analyst, StockCharts.com
TRANSPORTS BROKE OUT LAST WEEK ... I pointed out over a week ago (on Tuesday March 9) that the Dow Transports had broken through their 2010 which was a good sign for the stock market and the economy. That's because transportation stocks are cyclical in nature and do better...
READ MORE
MEMBERS ONLY
MCCLELLAN SUMMATION INDICES EXCEED JANUARY HIGHS - NET ADVANCES VERSUS NET ADVANCING VOLUME - NYSE AD LINE CONTINUES ITS RUN - NYSE AD VOLUME LINE HITS NEW HIGH - NASDAQ AD VOLUME LINE EXCEEDS 2007 HIGH - SHORT-TERM BREADTH WEAKENS
by John Murphy,
Chief Technical Analyst, StockCharts.com
MCCLELLAN SUMMATION INDICES EXCEED JANUARY HIGHS... Link for todays video. There are many ways to measure breadth. AD Lines and AD Volume Lines are two of the purest breadth indicators. The raw data goes through relatively little manipulation and the formula is simple. While the McClellan Oscillator and Summation Index...
READ MORE
MEMBERS ONLY
WEAKER DOLLAR BOOSTS GOLD -- NEWMONT LEADS MINERS HIGHER -- CANADIAN DOLLAR HITS 52-WEEK HIGH AND IS STRONGEST CURRENCY
by John Murphy,
Chief Technical Analyst, StockCharts.com
BOUNCE IN EURO WEAKENS DOLLAR ... Chart 1 shows the U.S. Dollar Index continuing the pullback that started nearly a month ago. A lot of the recent selling is the result of a bounce in Euro as shown in Chart 2. Although no major trend reversals have taken place, the...
READ MORE
MEMBERS ONLY
SPY MAKES IT 12 STRAIGHT - PARTY LIKE IT'S 1995 - OIL HITS RESISTANCE - WEAKNESS IN OIL WEIGHS ON XLE - OIH REMAINS IN UP SWING
by John Murphy,
Chief Technical Analyst, StockCharts.com
SPY MAKES IS 12 STRAIGHT... Link for todays video. The S&P 500 ETF (SPY) eked out another gain on Monday to make it twelve straight days with a closing gain. Chart 1 shows SPY trading above its January high the last three days. The blue dotted lines define...
READ MORE
MEMBERS ONLY
S&P 500 IS TESTING JANUARY HIGH -- INVESTMENT GRADE CORPORATE BOND ETF HITS NEW HIGHS -- PULLBACK IN US DOLLAR MAY GIVE TIPS A LIFT -- WEAKNESS IN CHINESE STOCKS MAY BE WEIGHING ON COMMODITIES --REITS HIT NEW HIGHS
by John Murphy,
Chief Technical Analyst, StockCharts.com
S&P 500 TESTS JANUARY HIGH ... I wrote on Tuesday that the number of stock indexes and groups hitting new 2010 highs called for a test of the January high by the S&P 500. Chart 1 shows the S&P in the process of doing that....
READ MORE
MEMBERS ONLY
HEALTHCARE STOCKS LAG - DEFENSIVE SECTORS SHOW RELATIVE WEAKNESS - DOLLAR STALLS NEAR RESISTANCE - EURO BOUNCES NEAR 62% RETRACEMENT - INTEREST RATES AND THE DOLLAR - GOLD FALLS TO SUPPORT
by John Murphy,
Chief Technical Analyst, StockCharts.com
HEALTHCARE STOCKS LAGGING... Link for todays video. While most of the major indices broke their January high, the Healthcare SPDR (XLV) fell well short of this high and shows relative weakness. Chart 1 shows XLV bouncing with the rest of the market over the last five weeks and hitting resistance...
READ MORE
MEMBERS ONLY
QQQQ EXCEEDS JANUARY HIGH - SEMIS LEAD TECHS - INTC HITS RESISTANCE - AMAT TESTS SUPPORT - FINANCE SECTOR CHALLENGES RESISTANCE - C AND WFC SURGE - DOW INDUSTRIALS STALLS BELOW JANUARY HIGH - SHANGHAI COMPOSITE STALLS AT BROKEN SUPPORT
by John Murphy,
Chief Technical Analyst, StockCharts.com
QQQQ EXCEEDS JANUARY HIGH... Link for todays video. Stocks moved higher again on Wednesday with the Nasdaq 100 ETF (QQQQ) joining the list of ETFs breaking their January high. The move above the January high forges a new 52-week high for this big tech ETF. The last 52-week high occurred...
READ MORE
MEMBERS ONLY
ODDS SHIFT TOWARD A FIFTH WAVE RALLY -- NEW HIGHS BY THE NYSE ADVANCE-DECLINE LINE AND A GROWING NUMBER OF MARKET GROUPS ARGUE FOR A CONTINUATION OF THE BULL MARKET -- TRUCKERS LEAD TRANSPORTS TO NEW HIGHS AS WELL -- WHERE TO READ UP ON ELLIOTT WAVES
by John Murphy,
Chief Technical Analyst, StockCharts.com
ODDS SHIFT TO FIFTH WAVE RALLY... Arthur Hill's Monday message addressed a couple of different ways to interpret the current Elliott Wave structure. The market is at an inflection point in Elliott Wave terms. Let's briefly review what's at stake and why. From the...
READ MORE
MEMBERS ONLY
REACTION LOWS FOR IWM AND RSI - S&P 500 ELLIOTT WAVE REVIEW - FINANCE SECTOR CHALLENGES RESISTANCE - SMH REMAINS BELOW JANUARY HIGH
by John Murphy,
Chief Technical Analyst, StockCharts.com
REACTION LOWS FOR IWM AND RSI... Link for todays video. An uptrend is defined by higher highs and higher lows. With the Russell 2000 ETF (IWM) hitting a new 52-week high last week, we can assume that the overall trend remains up. Chart 1 shows weekly candlesticks for IWM over...
READ MORE