MEMBERS ONLY
TECHS AND SMALL-CAPS LEAD MARKET (AAPL, QCOM) - HEALTHCARE SPDR SURGES TO NEW HIGH (AMGN, LLY) - IGN EXCEEDS 2009 HIGHS (CIEN, CSCO) - DOLLAR ETF BOUNCES OFF KEY RETRACEMENT - EURO BREAKS FLAG SUPPORT
by John Murphy,
Chief Technical Analyst, StockCharts.com
TECHS AND SMALL-CAPS LEAD MARKET HIGHER... Link for todays video.After a broad-based decline on Friday, buyers returned and pushed stocks higher on Tuesday. All of the major indices were up strong with large-cap techs and small-caps leading the way higher. Chart 1 shows the Nasdaq 100 ETF (QQQQ) in...
READ MORE
MEMBERS ONLY
NASDAQ AND NY COMP FALL SHARPLY - BREADTH REMAINS BULLISH OVERALL - INTEL LEADS SEMIS LOWER - SMH PULLS BACK TO BROKEN RESIST - BONDS BOUNCE ON LOW CPI NUMBERS - INFLATION-INDEXED BONDS FOLLOW GOLD
by John Murphy,
Chief Technical Analyst, StockCharts.com
STOCKS FALL SHARPLY ... Link for todays video. Stocks came under pressure for the second time this week. All of the major indices were down on Friday with the small-caps leading the way lower. All nine sectors were down with the finance sector leading lower. Healthcare, consumer staples and utilities, the...
READ MORE
MEMBERS ONLY
IWM HOLDS DECEMBER BREAKOUT - QQQQ FORGES PRICE RELATIVE BREAKOUT - FINANCIALS START THE YEAR STRONG - REGIONAL ENTERS RETRACEMENT SUPPORT ZONE - EURO FORMS RISING FLAG - GOLD ETF ENTERS RETRACEMENT RESISTANCE ZONE
by John Murphy,
Chief Technical Analyst, StockCharts.com
STOCKS EDGE HIGHER IN MIXED TRADING... Link for todays video. All major indices finished slightly higher on Thursday, but trading was mixed within the sectors. Four sectors were up, three were down and two were unchanged. Healthcare led the way higher with the Healthcare SPDR (XLV) recording a new 52-week...
READ MORE
MEMBERS ONLY
REIT ISHARES BOUNCE OFF CHART SUPPORT -- KIMCO ACHIEVES BULLISH BREAKOUT -- OTHER REIT LEADERS
by John Murphy,
Chief Technical Analyst, StockCharts.com
REIT ISHARES ARE BOUNCING OFF CHART SUPPORT... Last Thursday, I wrote about the improving chart picture in financials and homebuilders, and showed some individual stock leaders in each group. At the end of that message, I showed REIT iShares bouncing off chart support and showing good relative strength. I'...
READ MORE
MEMBERS ONLY
CHINESE BANK TIGHTENING WORRIES GLOBAL STOCKS AND COMMODITIES -- ANOTHER WORRY IS THAT CHINESE STOCKS ARE NO LONGER LEADING THE REST OF THE WORLD HIGHER
by John Murphy,
Chief Technical Analyst, StockCharts.com
KEEPING AN EYE ON CHINA ... The announcement that China is tightening monetary policy by raising bank reserve requirements has caused nervous profit-taking in global stock and commodity markets. Since China has been the engine driving the global economic recovery (not to mention rising stock and commodity prices), any hint that...
READ MORE
MEMBERS ONLY
DOW THEORY UPTREND CONTINUES -- CATERPILLAR AND CHEVRON ARE DOW LEADERS -- OVERSEAS SHIPBUILDING AND UPS CATAPULT TRANSPORTS TO NEW HIGH -- UTILITIES ARE LAGGING BEHIND BUT REMAIN IN UPTREND
by John Murphy,
Chief Technical Analyst, StockCharts.com
DOW THEORY UPDATE CONFIRMED ... Dow Theorists will be happy to see today's first two charts which show the Dow Industrials and Dow Transports hitting new recovery highs. Dow Theory holds that a healthy uptrend should see new highs in one index confirmed by the other, which is what...
READ MORE
MEMBERS ONLY
FINANCIALS CONTINUE TO SURGE
by John Murphy,
Chief Technical Analyst, StockCharts.com
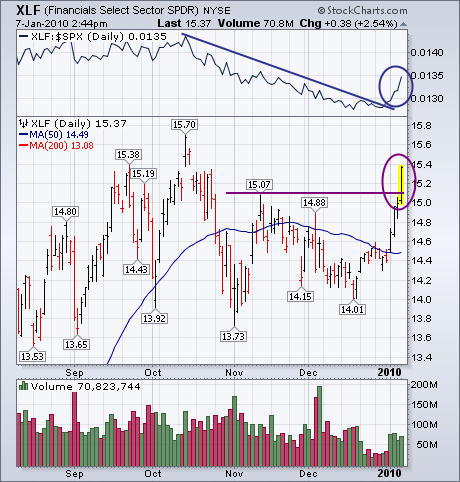
On Tuesday, I showed the financial sector in the process of turning from a market laggard into a market leader. Chart 1 shows that new financial leadership continuing. The Financials SPDR (XLF) has now exceeded its mid-November peak at 15.07 to turn its short-term trend back up again. That...
READ MORE
MEMBERS ONLY
FIBONACCI RETRACEMENTS REVISITED - SPY ADVANCES WITHIN CHANNEL - VOLUME FAILS TO IMPRESS, BUT PRICE DOES - AD VOLUME LINES HIT NEW HIGHS - NEW HIGHS EXPAND IN DECEMBER-JANUARY
by John Murphy,
Chief Technical Analyst, StockCharts.com
FIBONACCI RETRACEMENTS REVISITED... Link for todays video. Wednesdays Market Message triggered a number question regarding my decision to base retracements on the decline from May 2008 to March 2009. Chart 1 shows the S&P 500 ETF (SPY) with the Fibonacci Retracements Tool based on this decline. Representing the...
READ MORE
MEMBERS ONLY
FINANCIALS CONTINUE TO SURGE -- REGIONAL BANK HOLDERS TURN UP AS WELL -- BANK RALLY IS HELPED BY JUMP IN HOMEBUILDERS -- REITS BOUNCE OFF SEPTEMBER PEAK AND CONTINUE TO SHOW RELATIVE STRENGTH
by John Murphy,
Chief Technical Analyst, StockCharts.com
FINANCIAL RALLY CONTINUES... On Tuesday, I showed the financial sector in the process of turning from a market laggard into a market leader. Chart 1 shows that new financial leadership continuing today. The Financials SPDR (XLF) has now exceeded its mid-November peak at 15.07 to turn its short-term trend...
READ MORE
MEMBERS ONLY
COMMODITY ETF SCORES BIG - WHEAT LIFTS AGRICULTURE ETF - METALS ETF HITS NEW HIGH - MATERIALS LEAD THE MARKET - INVESTOR SENTIMENT SURVEYS HIT EXTREMES - SPY AND DIA EDGE ABOVE KEY RETRACEMENTS - QQQQ AND IWM EXCEED KEY RETRACEMENTS
by John Murphy,
Chief Technical Analyst, StockCharts.com
COMMODITY ETF SCORES BIG GAINS... Link for todays video. An array of positive factors boosted commodity related ETFs on Wednesday. Commodities benefited from weakness in the Dollar over the last two weeks and energy-related commodities benefited from the cold weather. In particular, oil surged over 10% in the last two...
READ MORE
MEMBERS ONLY
FINANCIAL ETF EXCEEDS 50-DAY AVERAGE -- SO DO SEVERAL BIG BANKS AND BROKERS -- HARTFOLD FINANCIAL IS DAY'S FINANCIAL LEADER
by John Murphy,
Chief Technical Analyst, StockCharts.com
FINANCIAL LAGGARDS TURN UP ... We normally focus on market groups that have been market leaders. Today, however, I'm going to focus on the sector that has been the market's weakest throughout the fourth quarter. That would be the financials. The reason I'm turning to...
READ MORE
MEMBERS ONLY
BULLS RING IN THE NEW YEAR - DOLLAR HITS RESISTANCE - RISING RATES BOOST THE DOLLAR - GOLD HITS SUPPORT ZONE - OIL SURGES - XLE AND OIH BREAK WEDGE TRENDLINES
by John Murphy,
Chief Technical Analyst, StockCharts.com
BULLS RING IN THE NEW YEAR... Link for todays video. The New Year started the same way the old year ended: bullish. The bulls were out in force early on the first trading day of the year. In early afternoon trading, the broad market indices were all up over 1%...
READ MORE
MEMBERS ONLY
3 ITEMS TO WATCH IN 2010 - EMERGING MARKETS AND REITS LEAD 2009 - COMMODITIES DEPENDENT ON THE DOLLAR AND EMERGING MARKETS - RATES SET TO RISE IN 2010 - SHANGHAI COMPOSITE COULD BE LEADING THE S&P 500 - HAPPY NEW YEAR
by John Murphy,
Chief Technical Analyst, StockCharts.com
ITEMS TO WATCH IN 2010... Link for todays video. Todays commentary will feature a few items to watch in 2010. First, I am showing a PerfChart with seven different ETFs representing five different asset classes. This is a good way to watch the intermarket picture unfold as well as the...
READ MORE
MEMBERS ONLY
DEFINING SANTA CLAUS RALLY -- BEST THREE MONTH SPAN ENDS IN JANUARY -- SECTOR SEASONALITY FAVORS ENERGY -- SEVERAL SECTORS END SEASONAL RUNS DURING JANUARY
by John Murphy,
Chief Technical Analyst, StockCharts.com
WE'RE IN SANTA TIME ... We're right in the middle of the Santa Claus rally and two-thirds of the way through the strongest period of the year for stocks. According to the Stock Traders Almanac, the Santa Claus rally encompasses the last five trading days of the...
READ MORE
MEMBERS ONLY
BREADTH LINES HIT NEW HIGHS - BULLISH% STILL FAVORS THE BULLS - NASDAQ OUTPERFORMS NY COMPOSITE - QQQQ FORGES P&F BREAKOUT - SPY ESTABLISHES SUPPORT ON P&F CHART - HAPPY HOLIDAYS!
by John Murphy,
Chief Technical Analyst, StockCharts.com
BREADTH LINES HIT NEW HIGHS... Link for todays video.The Nasdaq AD Volume Line and the NYSE AD Line hit new 52-week highs on Tuesday. New 52-week highs in these breadth stats are bullish for the market overall. Chart 1 shows the Nasdaq AD Volume Line exceeding its Sep-Oct highs...
READ MORE
MEMBERS ONLY
HOUSING STOCKS JUMP ON STRONG HOME SALES -- HOME DEPOT TESTS 2008 HIGH -- EARLY JANUARY EFFECT PUSHES SMALL CAPS TO NEW HIGHS -- ENERGY, BIOTECH, AND REIT ETFS TURN UP -- SEASONAL FACTORS FAVOR STOCKS THROUGH JANUARY -- VIX HITS NEW 2009 LOW
by John Murphy,
Chief Technical Analyst, StockCharts.com
HOMEBUILDER ETF TURNS BACK UP ... Today's report that November existing home sales exceeded expectations is having a bullish on housing stocks. Chart 1 shows the Homebuilders SPDR (XHB) breaking through a three-month down trendline. The ability of the XHB to stay above its 2009 up trendline is another...
READ MORE
MEMBERS ONLY
BOND YIELDS SURGE ON GROWTH AND INFLATION FEARS AS INVESTORS FLEE TREASURIES -- BOUNCING DOLLAR KEEPS GOLD AND OIL ON THE DEFENSIVE -- INDUSTRIAL METAL SHARES, HOWEVER, HAVE A STRONG DAY -- SEMICONDUCTORS LEAD NASDAQ MARKET TO NEW HIGH
by John Murphy,
Chief Technical Analyst, StockCharts.com
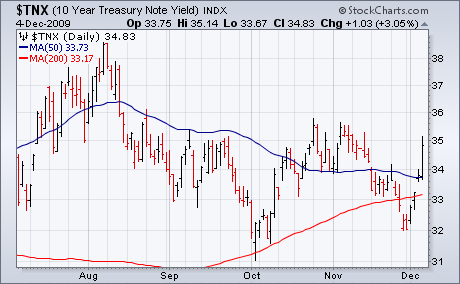
RECORD YIELD CURVE ... Today's stock buying is coming at the expense of Treasury bonds. Chart 1 shows the T-Bond ETF (TLT) tumbling to the lowest level since August. Chart 2 shows the 10-Year T-Note Yield closing at the highest level since August. [The two charts are a mirror...
READ MORE
MEMBERS ONLY
UPTREND IS STILL INTACT
by John Murphy,
Chief Technical Analyst, StockCharts.com
A Friday stock bounce kept major stock indexes stuck in a two-month trading range. Prices also remain above their 50-day averages which keeps the intermediate uptrend intact. Prices, however, remain below long-term resistance barriers near 10,500 in the Dow, 1120 in the S&P 500, and 2200 in...
READ MORE
MEMBERS ONLY
STOCKS REMAIN IN SHORT-TERM TRADING RANGE -- EURO BOUNCE HELPS STABILIZE GOLD AND OIL -- SEASONAL TRENDS MAY SUPPORT STOCKS THROUGH YEAREND -- TREASURIES LOSE GROUND ON FEARS OF HIGHER RATES IN NEW YEAR
by John Murphy,
Chief Technical Analyst, StockCharts.com
UPTREND IS STILL INTACT ... A Friday stock bounce kept major stock indexes stuck in a two-month trading range. Prices also remain above their 50-day averages which keeps the intermediate uptrend intact. Prices, however, remain below long-term resistance barriers near 10,500 in the Dow, 1120 in the S&P...
READ MORE
MEMBERS ONLY
FINANCE SECTOR TESTS SUPPORT - REGIONAL BANK SPDR HITS RESISTANCE - BROKER - DEALER ISHARES CONSOLIDATES - DOWNGRADES WEIGH ON BIG BANKS - EURO PLUNGES AFTER GREECE DOWNGRADE - DOLLAR SURGES IN FLIGHT TO SAFETY - GREECE AND IRELAND UNDERPERFORM
by John Murphy,
Chief Technical Analyst, StockCharts.com
FINANCE SECTOR TESTS SUPPORT... Link for todays video. The Financials SPDR (XLF) remains relatively weak over the last few months and the ETF is testing range support with a move lower today. Chart 1 shows XLF breaking below the triangle trendline and then stalling around 14.25 the previous seven...
READ MORE
MEMBERS ONLY
BOLLINGER BANDS CONTRACT ON THE DOW - CUP-WITH-HANDLE FOR NY COMPOSITE - SMH CONSOLIDATES AFTER SURGE - INTEL DRAGS SMH DOWN - NVIDIA AND AMD COUNTER INTEL - BROADCOM AND XILINX HIT NEW HIGHS - AGRICULTURE ETF BOUNCES TO RESISTANCE
by John Murphy,
Chief Technical Analyst, StockCharts.com
BOLLINGER BANDS CONTRACT ON THE DOW... Link for todays video. The Fed met expectations by leaving rates and policy unchanged on Wednesday. In its policy statement, the FOMC made note of the usual suspects. While the Fed was positive on parts of the economy, continued weakness in the labor market...
READ MORE
MEMBERS ONLY
DOLLAR REBOUND CONTINUES AS EURO BREAKS CHART SUPPORT -- US BOND YIELDS JUMP -- RISING DOLLAR THREATENS EMERGING MARKET LEADERSHIP -- S&P 500 MEETS LONG-TERM RESISTANCE NEAR 1120
by John Murphy,
Chief Technical Analyst, StockCharts.com
DOLLAR INDEX BOUNCES OFF 2008 LOW ... The rebound in the dollar that started a couple of weeks ago is continuing. And the rally is coming off a prominent support level. Chart 1 shows the PowerShares Dollar Bullish ETF (UUP) bouncing off its early 2008 low near 22. Bounces off support...
READ MORE
MEMBERS ONLY
UTILITIES AND HEALTHCARE ARE MONTH'S TOP GROUPS -- WEEKLY HEALTHCARE LEADERS ARE AETNA, UNITEDHEALTH, AND WELLPOINT
by John Murphy,
Chief Technical Analyst, StockCharts.com
DEFENSIVE ROTATION ... Although the stock market remains stuck in a short-term trading range, a more cautious tone has been revealed by sector rotations beneath the surface. Over the last month, for example, the two top market sectors have been utitilities and healthcare which are traditionally defensive groups. The two weakest...
READ MORE
MEMBERS ONLY
DECEMBER STARTS DIFFERENT - IWM STALLS NEAR RESISTANCE - FINANCE SECTOR CONTINUES TO LAG - XLF STALLS AT NOVEMBER LOW - CITIGROUP AND BOFA FAIL TO INSPIRE - 30 YEAR BOND YIELD SURGES - 10 YEAR BOND YIELD HITS RESISTANCE
by John Murphy,
Chief Technical Analyst, StockCharts.com
DECEMBER STARTS A LITTLE DIFFERENT... Link for todays video. December is shaping up a little different than the rest of the year. Chart 1 shows an Intermarket Perfchart from early March to the end of November. The S&P 500 ETF (SPY) is by far the best performer over...
READ MORE
MEMBERS ONLY
DOW FIRMS AT SUPPORT - QQQQ SHOWS SOME LIFT - SMALL-CAPS AND THE JANUARY EFFECT - OIL PLUNGES BELOW SUPPORT - XLE FIRMS NEAR PRIOR LOW - OIH ACTUALLY BOUNCES - TIPS RETREAT WITH GLD
by John Murphy,
Chief Technical Analyst, StockCharts.com
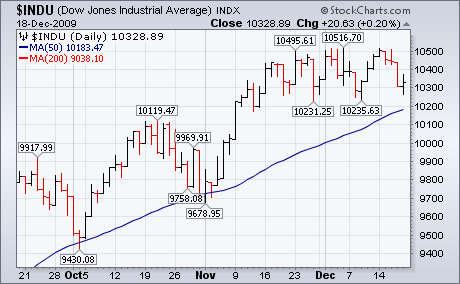
DOW FIRMS AT CONSOLIDATION SUPPORT... Since first moving above 10400 on November 16th, the Dow has been in consolidation mode. Chart 1 shows the senior Average crisscrossing the 10400 level at least six times in the last 17 trading days. Basically, we have a consolidation within an uptrend. With higher...
READ MORE
MEMBERS ONLY
RISING DOLLAR PUSHES FOREIGN CURRENCIES AND COMMODITIES LOWER -- THAT ALSO CAUSES PROFIT-TAKING IN STOCKS AS THEY TEST MAJOR RESISTANCE LINES -- EMERGING MARKETS LOOK RIPE FOR PROFIT-TAKING
by John Murphy,
Chief Technical Analyst, StockCharts.com
DOLLAR RALLY PUSHES FOREIGN CURRENCIES BELOW 50-DAY LINES... Last Friday's jump in the U.S. Dollar (following a strong jobs report) pushed the Euro below its 50-day moving average. When a support line that has contained pullbacks for eight months is broken, that signals a change in a...
READ MORE
MEMBERS ONLY
TELECOM AND UTILITIES SHOW STRONG CHART ACTION AND CONTINUE TO BENEFIT FROM MOVE INTO DIVIDEND-PAYING STOCKS
by John Murphy,
Chief Technical Analyst, StockCharts.com
BARRON'S ARTICLE GIVES BOTH GROUPS A BOOST... I've written a couple of articles over the last two weeks about the recent move into dividend paying stocks like telecom and utilities. A weekend Barron's article (Even Better Than Bonds) wrote about how relatively low bond...
READ MORE
MEMBERS ONLY
BOND YIELDS AND DOLLAR BOUNCE
by John Murphy,
Chief Technical Analyst, StockCharts.com
Sometimes good news produces a bad effect. That's especially true when dealing with financial markets. Today's unemployment report dropped to 10% and payrolls fell by an unusually small amount. That good news was given a positive reception by most markets. By day's end, however,...
READ MORE
MEMBERS ONLY
STRONG JOBS REPORT BOOSTS BOND YIELDS AND THE DOLLAR -- GOLD PLUNGES -- CHIPS, TRANSPORTS, REITS, AND SMALL STOCKS STRENGTHEN -- MAJOR STOCK INDEXES TEST LONG-TERM RESISTANCE LINES
by John Murphy,
Chief Technical Analyst, StockCharts.com
BOND YIELDS AND DOLLAR BOUNCE... Sometimes good news produces a bad effect. That's especially true when dealing with financial markets. Today's unemployment report dropped to 10% and payrolls fell by an unusually small amount. That good news was given a positive reception by most markets. By...
READ MORE
MEMBERS ONLY
RELATIVE WEAKNESS IN FINANCE WEIGHS - HOMEBUILDERS CONTINUE TO UNDERPERFORM - RETAILS UNDER PRESSURE - WALMART HANGING TOUGH
by John Murphy,
Chief Technical Analyst, StockCharts.com
RELATIVE WEAKNESS FINANCE WEIGHS... Link for todays video. Even though the major indices and sectors remain in uptrends overall, there are a few key areas of weakness that merit attention. First and foremost, the Financials SPDR (XLF) remains a drag on the overall market. Even with strength in Bank of...
READ MORE
MEMBERS ONLY
ENERGY CONTINUES TO LAG S&P 500 - BOLLINGER BANDS CONTRACT IN XLE - OIH SHOWS RELATIVE WEAKNESS - OIL TESTS SUPPORT FROM BROKEN RESISTANCE - A DISCONNECT WITH THE NATURAL GAS ETFS
by John Murphy,
Chief Technical Analyst, StockCharts.com
ENERGY CONTINUES TO LAG THE S&P 500... Note: There will be another posting with a video later today. November was not a good month for the Energy SPDR (XLE). Chart 1 shows the Sector SPDR Perfchart with the absolute performance for the nine sectors and the S&...
READ MORE
MEMBERS ONLY
DOW STALLS NEAR TOP OF CHANNEL - BOLLINGER BAND WIDTH NARROWS FOR SPY - SMH SURGES BACK TO RESISTANCE - LRCX-SNDK-TSM LEAD SEMIS HIGHER - DOW TRANSPORTS CHALLENGES RESISTANCE - DJ TRUCKING INDEX SURGE - DJ AIRLINE INDEX LEADS TRANSPORTS HIGHER
by John Murphy,
Chief Technical Analyst, StockCharts.com
DOW STALLS NEAR TOP OF CHANNEL... Link for todays video. The Dow Industrials stalled as the market traded with indecision on Wednesday. Chart 1 shows a clear uptrend over the last several months. A series of higher highs and higher lows formed since August. With this zigzag higher we can...
READ MORE
MEMBERS ONLY
GLOBAL STOCKS AND COMMODITIES JUMP AS DOLLAR DROPS -- 50-DAY MOVING AVERAGES CONTAIN PULLBACK -- GOLD STOCKS HIT NEW HIGHS -- SEMICONDUCTORS TRY TO RETAKE 50-DAY LINE -- UTILITIES ARE BREAKING OUT
by John Murphy,
Chief Technical Analyst, StockCharts.com
GLOBAL PULLBACK FINDS SUPPORT AT 50-DAY LINES... As fears about Dubai reside, global stocks have regained their upside momentum. All three U.S. stock indexes found support at or above their rising 50-day moving averages as shown in the first three charts. That has removed any immediate threat to the...
READ MORE
MEMBERS ONLY
GLOBAL MARKETS DROP ON DUBAI CONCERNS -- STOCKS AND COMMODITIES DROP WHILE THE DOLLAR AND BONDS RALLY -- SO FAR, NO SERIOUS CHART DAMAGE HAS BEEN DONE -- BUT A MORE CAUTIOUS TONE IS WARRANTED
by John Murphy,
Chief Technical Analyst, StockCharts.com
ATTEMPT TO DELAY DEBT PAYMENTS RATTLES MARKETS... An attempt by Dubai to delay debt payments for six months has rattled world markets. Most global stock markets fell on Thursday while the U.S. market was closed for the Thanksgiving holiday. That's why U.S. stock markets are dropping...
READ MORE
MEMBERS ONLY
FINANCE SECTOR REMAINS A DRAG - BIG BANKS UNDER PRESSURE (JPM, GS, WFC, C, BAC) - EURO HITS A NEW HIGH FOR THE YEAR - GOLD ACCELERATES HIGHER - TIPS MOVING STEP-FOR-STEP WITH GOLD
by John Murphy,
Chief Technical Analyst, StockCharts.com
FINANCE SECTOR REMAINS A DRAG... Link for todays video.While the S&P 500 moved higher the last two weeks, the Financials SPDR (XLF) has remained range bound and continues to underperform the broFinance sector remains a dragader market. Chart 1 shows XLF bouncing off support in early November,...
READ MORE
MEMBERS ONLY
TELECOM HOLDERS BREAKOUT IN MOVE TO DIVIDEND PAYING STOCKS -- AT&T AND VERIZON NEAR BULLISH BREAKOUTS -- ADD TELECOM TO DEFENSIVE FAVORITES ALONG WITH CONSUMER STAPLES AND HEALTHCARE
by John Murphy,
Chief Technical Analyst, StockCharts.com
ANOTHER DEFENSIVE PLAY... One of the main themes I've been showing over the last few weeks has been the rotation toward large-cap stocks in traditionally defensive areas, mainly consumer staples and healthcare. Yesterday, I wrote about a list of top dividend payers (from a weekend Barron's...
READ MORE
MEMBERS ONLY
ANOTHER MONDAY JUMP IN STOCKS AND COMMODITIES -- CHEVRON AND EXXON MOBIL SHOW NEW ENERGY LEADERSHIP -- MONEY IS FLOWING INTO LARGE DIVIDEND STOCKS -- VERIZON IS ONE OF THE CHEAPER DIVIDEND PAYERS -- GOLD STOCKS NEAR 2008 HIGH AND MAY BE DUE FOR A BREATHER
by John Murphy,
Chief Technical Analyst, StockCharts.com
EURO UPTREND SUPPORTS STOCKS AND COMMODITIES... As you know, stocks and commodities have been rising most of the year as the U.S. dollar has been dropping. Foreign currencies have also been rising. As a result, a strong positive correlation has existed between the Euro (which has the biggest impact...
READ MORE
MEMBERS ONLY
TRENDLINES AND 50% RETRACEMENTS REACHED
by John Murphy,
Chief Technical Analyst, StockCharts.com
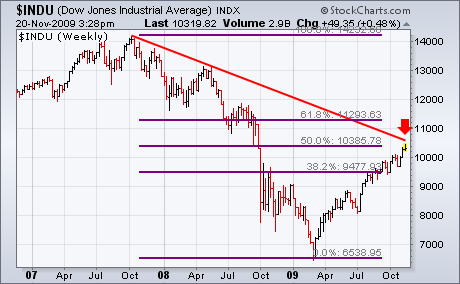
The following three charts show the three major U.S. stock indexes having reached formidable overhead resistance barriers. Charts 1 and 2 show the Dow Industrials and the S&P 500 having retraced 50% of their bear market declines. More importantly, both indexes are testing major down trendlines drawn...
READ MORE
MEMBERS ONLY
STOCK INDEXES REACH MAJOR RESISTANCE BARRIERS -- SMALL CAPS, FINANCIALS, CHIPS, AND HOMEBUILDERS SHOW RELATIVE WEAKNESS -- LEADERSHIP HAS SWITCHED TO DEFENSIVE CONSUMER STAPLES AND HEALTHCARE
by John Murphy,
Chief Technical Analyst, StockCharts.com
TRENDLINES AND 50% RETRACEMENTS REACHED... The next three charts show the three major U.S. stock indexes having reached formidable overhead resistance barriers. Charts 1 and 2 show the Dow Industrials and the S&P 500 having retraced 50% of their bear market declines. More importantly, both indexes are...
READ MORE
MEMBERS ONLY
RUSSELL 2000 TESTS IMPORTANT SUPPORT LEVEL - SEMIS GET HIT WITH DOWNGRADE - INTC AND TXN LEAD SEMIS LOWER -ENERGY PACES SECTORS LOWER - WALMART POWERS RETAIL HOLDRS - RETAIL SPDR FAILS TO EXCEED OCTOBER HIGH
by John Murphy,
Chief Technical Analyst, StockCharts.com
RUSSELL 2000 DECLINES TO IMPORTANT SUPPORT LEVEL... Link for todays video. Small-caps are still lagging the broader market. The Russell 2000 first showed relative weakness as the first of the major index ETFs to break below its early October low. RUT again showed relative weakness in the November rally because...
READ MORE