MEMBERS ONLY
PHARM HOLDERS REACH 52-WEEK HIGH -- ABBOTT LABS GAPS HIGHER ON ACQUISITION NEWS -- WYETH HITS THREE-YEAR HIGH -- BRISTOL MYERS SQUIBB NEARS BULLISH BREAKOUT -- WATSON PHARMACEUTICALS HITS FIVE-YEAR HIGH
by John Murphy,
Chief Technical Analyst, StockCharts.com
DRUG STOCKS SHOWING SOME LEADERSHIP... At the start of last week, I wrote an article about some money starting to flow into the healthcare sector. My main focus in that earlier article was on biotech stocks that were starting to attract some money. Today's healthcare focus is on...
READ MORE
MEMBERS ONLY
HOW TO BLEND DAILY AND WEEKLY SIGNALS -- STOCK WINNERS AND LOSERS -- WATCHING % OF STOCKS ABOVE 50-WEEK MA FOR CLUES -- PRECIOUS METAL SUPPORT LEVELS -- TREASURIES RALLY -- S&P 500 SUPPORT LEVELS
by John Murphy,
Chief Technical Analyst, StockCharts.com
WHICH IS BETTER?... One of our readers asked whether it's better to use daily or weekly signals on price charts. The answer depends on the time horizon for your trading decisions. If you're a relatively inactive investor, who only makes decisions at important turning points, weekly...
READ MORE
MEMBERS ONLY
STOCKS FALLS AS DOLLAR BOUNCES - HOMEBUILDERS WEIGH ON STOCK MARKET - FINANCE SECTOR IS STILL THE OVERALL LEADER - RELATIVE PERFORMANCE IN XLY STALLS - QQQQ AND IWM NEAR RETRACEMENTS - MEASURING RETRACEMENTS - USING RETRACEMENT CLUSTERS
by John Murphy,
Chief Technical Analyst, StockCharts.com
DOLLAR BOUNCES AS STOCKS FALL... Video Link (click here)
After an intraday reversal and higher close on Wednesday, the Dollar followed through on Thursday with another gain. Conversely, the S&P 500 ETF followed up on Wednesdays key reversal with further losses. However, it is still too early to...
READ MORE
MEMBERS ONLY
STOCKS FALL SHARPLY AFTER FED ANNOUNCEMENT - RSI BECOMES OVERBOUGHT FOR DIA - EURO MOVES WITH STOCK MARKET - OIL GETS HIT BY RISING SUPPLIES - BONDS BOUNCE AFTER FED ANNOUNCEMENT - TELECOM ETF BREAKS RESISTANCE - AT&T AND CENTURYTEL LEAD
by John Murphy,
Chief Technical Analyst, StockCharts.com
STOCKS DECLINE AFTER FED STATEMENT... Video Link (click here)
As was widely expected, the Fed left the Fed Funds rate unchanged. With a target range of 0-.25%, Fed Funds are trading at record lows. Whats more, the Fed said it would keep the target rate near these record lows...
READ MORE
MEMBERS ONLY
MARKET VECTORS COAL ETF NEARS 52 WEEK HIGH -- COAL LEADERS ARE PEABODY AND CONSOLIDATED ENERGY -- ARCH COAL BREAKS OUT OF BASING PATTERN -- DOLLAR DROP TO NEW LOW BOOSTS STOCKS AND COMMODITIES
by John Murphy,
Chief Technical Analyst, StockCharts.com
MARKET VECTORS COAL ETF NEARS 52-WEEK HIGH... Here's an energy ETF that I haven't written about before. It's the Market Vectors Coal ETF (KOL) and it's based on a group of stocks tied to the price of coal. The ETF has been...
READ MORE
MEMBERS ONLY
METAL STOCKS ARE RISING ALONG WITH COMMODITIES -- STILLWATER MINING NEARS 52-WEEK HIGH ON RISING PLATINUM AND PALLADIUM PRICES -- STEEL STOCKS ALSO ON THE RISE -- AKS IS US LEADER -- CLF COMPLETES MAJOR BOTTOM
by John Murphy,
Chief Technical Analyst, StockCharts.com
PRECIOUS METALS GAP HIGHER ... With the U.S. Dollar falling to the lowest level in a year today, stocks and commodities are bouncing again. Precious metals are having an especially strong day. Gold, silver, and platinum have gapped higher and are challenging last week's highs as shown in...
READ MORE
MEMBERS ONLY
CELGENE UPGRADE SPARKS BIOTECH BUYING -- AMGEN AND GILEAD HAVE PROMISING CHART PATTERNS -- ALEXION, ILLUMINA, AND VERTEX ARE IN CHART UPTRENDS -- SOME DEFENSIVE MONEY MAY BE MOVING TO HEALTCHARE
by John Murphy,
Chief Technical Analyst, StockCharts.com
BIOTECHS ETFS HAVE STRONG DAY... On a day when most stocks and commodities pulled back a bit and the dollar bounced, healthchare was the day's top performing group. Biotechs were the main reason why. Charts 1 and 2 show Biotech iShares (IBB) and Biotech Holders (BBH) nearing the...
READ MORE
MEMBERS ONLY
FALLING DOLLAR FAVORS FOREIGN STOCKS
by John Murphy,
Chief Technical Analyst, StockCharts.com
Arthur Hill reviewed some standard intermarket relationships on Thursday. One of the best known is the inverse relationship between the U.S. Dollar and commodity prices. That's why a falling dollar has had a bullish impact on commodity prices since the spring. The falling dollar has also boosted...
READ MORE
MEMBERS ONLY
FALLING DOLLAR FAVORS FOREIGN SHARES -- IT ALSO FAVORS FOREIGN ETFS OVER UNDERLYING STOCKS -- NEXT UPSIDE TARGET FOR S&P 500 IS 1120 -- NATURAL GAS IS FIDELITY'S TOP SECTOR FUND FOR THE WEEK -- GOLD NEARS TESTS OF MARCH 2008 INTRA-DAY AT $1033
by John Murphy,
Chief Technical Analyst, StockCharts.com
FALLING DOLLAR FAVORS FOREIGN STOCKS... Arthur Hill reviewed some standard intermarket relationships on Thursday. One of the best known is the inverse relationship between the U.S. Dollar and commodity prices. That's why a falling dollar has had a bullish impact on commodity prices since the spring. The...
READ MORE
MEMBERS ONLY
DOW THEORY SIGNAL AFFIRMED - AIRLINES POWER DOW TRANSPORTS - INTERMARKET CORRELATIONS BLUR - COMMODITIES ARE NEGATIVELY CORRELATED WITH BONDS - DBC BREAKS CHANNEL RESISTANCE - TLT HOLDS BREAKOUT
by John Murphy,
Chief Technical Analyst, StockCharts.com
TRANSPORTS AND INDUSTRIALS FORGE HIGHER HIGHS... Video Link (click here). Last week I noted that the Dow Industrials had yet to break its late August highs and that a non-confirmation could be brewing. With the advance over the last five days, chart 1 shows the Dow Industrials easily clearing its...
READ MORE
MEMBERS ONLY
SMALL-CAPS LEAD BROAD ADVANCE - FINANCE SECTOR SHOWS RELATIVE STRENGTH - REGIONAL BANKS AND REITS POWER FINANCE - OIL FORMS BULLISH CUP-WITH-HANDLE PATTERN - XLE AND OIH BREAK RESISTANCE - GLD CHALLENGES 2008 HIGH.
by John Murphy,
Chief Technical Analyst, StockCharts.com
SMALL-CAPS LEAD BROAD ADVANCE... Video Link (click here) Stocks moved sharply higher on Wednesday with a broad advance. All major index ETFs were up over 1%. All nine sectors were higher with energy and finance leading the way. The technology sector lagged with a relatively small gain on the day....
READ MORE
MEMBERS ONLY
POINT & FIGURE TRENDS FOR MAJOR STOCK INDEXES ARE STILL UP -- NEW BULLISH PERCENT BUY SIGNALS HAVE BEEN GIVEN IN GOLD AND ENERGY -- NEW ENERGY BUYING APPEARS TO BE COMING FROM A REBOUND IN NATURAL GAS -- NATURAL GAS STOCK LEADERS INCLUDE CHK, DVN, AND EP
by John Murphy,
Chief Technical Analyst, StockCharts.com
POINT & FIGURE TRENDS ARE STILL UP... It's true that the market has recovered more than 50% since March. It's also true that many indicators show overbought readings. The most important indicator of all, however, is the actual trend of prices which is still up. At...
READ MORE
MEMBERS ONLY
SILVER STOCK BREAKOUTS -- PLATINUM BREAKS OUT AND IS BENEFITING FROM STRONGER ECONOMY -- 13 AND 34 EMA LINES ARE STILL POSITIVE FOR THE S&P 500 -- BREAKDOWN IN DOLLAR GIVES BOOST TO GLOBAL STOCKS
by John Murphy,
Chief Technical Analyst, StockCharts.com
SILVER STOCKS... Last Friday I showed several gold stocks that had achieved bullish breakouts. One of our readers asked me to show some silver stockss that had achieved bullish breakouts as well. Shown below are the top three in terms of relative strength and strong chart action. Chart 1 shows...
READ MORE
MEMBERS ONLY
STOCKS RALLY AS DOLLAR FALLS - NEXT SUPPORT FOR THE DOLLAR INDEX - SPY EXCEEDS AUGUST HIGHS - BONDS SURGE AND RATES FALL - XLU SHOWS RELATIVE WEAKNESS IN SEPTEMBER
by John Murphy,
Chief Technical Analyst, StockCharts.com
NEGATIVE CORRELLATION FOR STOCKS AND DOLLAR... Link for todays video.
The S&P 500 and the US Dollar Index continue to move in opposite directions. Chart 1 shows the S&P 500 in red and the US Dollar Index in green. This inverse relationship started to assert itself...
READ MORE
MEMBERS ONLY
DOW FINISHES STRONG - IWM AND QQQQ LEAD - DOW TRANSPORTS BREAKS AUGUST HIGH - RAILS AND AIRLINES LEAD - TRUCKERS LAG - SHORT-TERM DOW THEORY NON-CONFIRMATIONS LURK
by John Murphy,
Chief Technical Analyst, StockCharts.com
DELAYED POSTING... Wednesday's Market Message was delayed due to a website disruption on Wednesday afternoon. As noted on the status page (click here), we moved back to our old T3 circuits to get back online around 1:30AM. Further developments will be posted on the status page.
BEIGE...
READ MORE
MEMBERS ONLY
WEAK DOLLAR GIVES BOOST TO GLOBAL STOCKS AND COMMODITIES -- RISING CHINESE SHARES HELP STABILIZE GLOBAL MARKETS -- SUMMER RALLY IS STILL INTACT
by John Murphy,
Chief Technical Analyst, StockCharts.com
DOLLAR DROPS TO YEARLY LOW... The U.S. Dollar has come under heavy selling today. Chart 1 shows the PowerShares DB US Dollar Index (UUP) falling to the lowest level of the year. Although most foreign currencies are rallying, the biggest gain is being seen in the Euro. Chart 2...
READ MORE
MEMBERS ONLY
GOLD AND SILVER HAVE BIG WEEK
by John Murphy,
Chief Technical Analyst, StockCharts.com
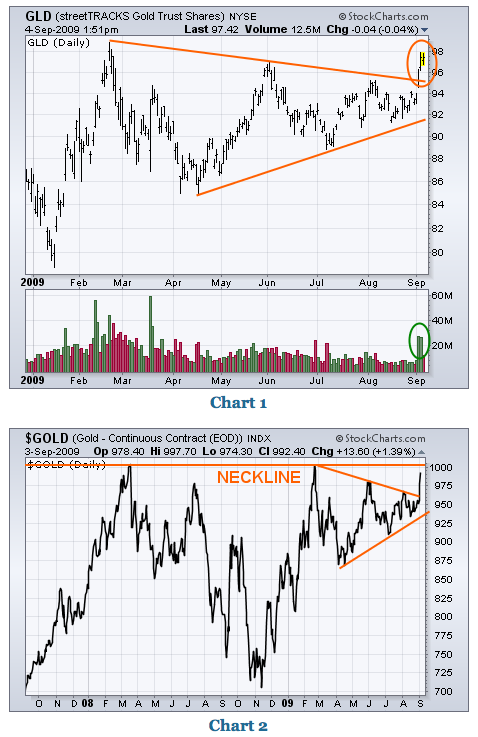
GOLD TESTING ALL-TIME HIGH... Last Friday I wrote about the bullish potential in gold and gold shares. That optimism was based on two bullish chart patterns which are shown below. The first is the bullish symmetrical triangle shown in Chart 1 for the Gold Trust ETF (GLD). This week'...
READ MORE
MEMBERS ONLY
GOLD AND SILVER HAVE BIG WEEK -- SO DO GOLD STOCKS -- GOLD LEADERS INCLUDE ABX, GG, KGC, AEM, AND IAG -- PRECIOUS METAL ASSETS ARE BACK IN FAVOR
by John Murphy,
Chief Technical Analyst, StockCharts.com
GOLD TESTING ALL-TIME HIGH... Last Friday I wrote about the bullish potential in gold and gold shares. That optimism was based on two bullish chart patterns which are shown below. The first is the bullish symmetrical triangle shown in Chart 1 for the Gold Trust ETF (GLD). This week'...
READ MORE
MEMBERS ONLY
DOW STALLS AFTER SHARP DECLINE - BONDS LEAD INTERMARKET PLAYERS - WEAK DOLLAR NOT MUCH HELP FOR OIL - ENERGY SECTOR SHOWS RELATIVE WEAKNESS - MACD TURNS NEGATIVE FOR USO
by John Murphy,
Chief Technical Analyst, StockCharts.com
STOCKS EDGE HIGHER... Link for todays video. Stocks edged higher ahead of Fridays employment report and three day weekend. Chart 1 shows the Dow Industrials gaining around 64 points, which is a relatively small move (+.69%). After a long red candlestick and sharp decline on Tuesday, the Dow stalled with...
READ MORE
MEMBERS ONLY
UPSIDE MOMENTUM WANES FOR SPY - SIGNS OF SELLING PRESSURE ON INTRADAY CHARTS - MCCLELLAN OSCILLATORS SHOW BREADTH DETERIORATION - GOLD SURGES ABOVE TRIANGLE RESISTANCE - GOLD STOCKS OUTPACE GOLD - DOLLAR REMAINS IN DOWNTREND
by John Murphy,
Chief Technical Analyst, StockCharts.com
STOCKS STALL AFTER SHARP DECLINES... Link for todays video. After sharp declines on Monday and Tuesday, the S&P 500 ETF (SPY)* stalled just below 100 on Wednesday. Chart 1 shows the ETF closing in the red for its fourth consecutive losing day. SPY has not seen four down...
READ MORE
MEMBERS ONLY
US DOLLAR HAS COMPLETED FIVE-WAVE DECLINE AND IS DUE FOR A BOUNCE WHILE THE EURO LOOKS TOPPY -- THAT FITS INTO A DOWNSIDE CORRECTION IN STOCKS AND COMMODITIES -- SO DOES THE RALLY IN THE YEN
by John Murphy,
Chief Technical Analyst, StockCharts.com
DOLLAR DUE FOR A RALLY ... On August 17, I wrote a message showing that the CRB Index had completed a five-wave advance and was due a correction (which appears to have started). The following day I did a similar analysis showing that the U.S. Dollar had completed a five-wave...
READ MORE
MEMBERS ONLY
OVERBOUGHT FINANCIALS LEAD MARKET LOWER --AIG, CITIGROUP, AND BANK OF AMERICA ARE BIG LOSERS -- VIX BREAKS OUT TO UPSIDE AS STOCKS FALL -- TREASURIES, THE YEN, AND THE DOLLAR ARE ATTRACTING SAFE HAVEN MONEY
by John Murphy,
Chief Technical Analyst, StockCharts.com
FINANCIALS DROP 4%... I recently wrote about the negative warning from the market's loss of leadership in the technology sector. Today, the negative warning is coming from financials. And it's coming at a bad time for the financials the rest of the market. The Financials Sector...
READ MORE
MEMBERS ONLY
BIG DROP IN CHINESE SHARES CAUSES SELLING IN GLOBAL STOCKS AND COMMODITIES -- COPPER AND OIL (AND THEIR RELATED STOCKS) ARE HIT THE HARDEST -- SAFE HAVEN MONEY IS MOVING INTO THE YEN AND TREASURIES -- OVERBOUGHT STOCKS ARE STARTING TO SLIP
by John Murphy,
Chief Technical Analyst, StockCharts.com
SHANGHAI INDEX HAS LOST 23% DURING AUGUST ... I had been surprised at how little attention was being paid to the big drop in Chinese shares since the start of August. That's why I warned on Friday that the big drop in Shanghai could cause profit-taking in global stock...
READ MORE
MEMBERS ONLY
TREASURY RALLY HINTS AT STOCK PULLBACK -- SO DOES 20% AUGUST DROP IN SHANGHAI INDEX -- GOLD IS CONSOLIDATING IN BULLISH SYMMETRICAL PATTERN -- GOLD SHARES ALSO LOOK PROMISING
by John Murphy,
Chief Technical Analyst, StockCharts.com
STOCKS AND BOND YIELDS MOVE TOGETHER... Last week (August 18) I wrote about one of the side-effects of a deflationary environment being the positive correlation between stock prices and Treasury bond yields. In other words, Treasury yields and stock prices trend in the same direction. Chart 1, for example, shows...
READ MORE
MEMBERS ONLY
POINT & FIGURE CHARTS ARE HELPFUL IN GIVING PRECISE BUY AND SELL SIGNALS -- USING BAR CHARTS TO SPOT SHORT-TERM SUPPORT AND RESISTANCE LEVELS
by John Murphy,
Chief Technical Analyst, StockCharts.com
P&F SIGNALS ARE MORE PRECISE ... Once in a while, I like to review the merits of point & figure charting which can be used as an adjunct to other charting methods. As I've pointed out before, one of the most compelling virtues of p&f...
READ MORE
MEMBERS ONLY
HOUSING BREAKOUT CONTINUES TO BUILD ON IMPROVING FUNDAMENTALS -- LENNAR AND NVR ARE GROUP LEADERS -- OTHER PROMISING HOMEBUILDING CHARTS BELONG TO DHI, MDC, PHM AND TOLL BROTHERS -- MARKET EXTENDS SUMMER RALLY BUT IS ON SHAKY TECHNICAL GROUND
by John Murphy,
Chief Technical Analyst, StockCharts.com
MORE GOOD HOUSING NEWS BOOSTS HOMEBUILDERS... Each passing week brings more encouraging news on housing. Today's second quarter news shows home prices in the U.S. jumping for the first time in three years. As is usually the case, that good news has been anticipated by stocks tied...
READ MORE
MEMBERS ONLY
STRONG HOUSING NUMBERS BOOST HOMEBUILDERS AND REITS WHICH ARE IN NEW UPTRENDS -- THAT HELPS EXTEND MARKET RALLY -- SUPPORT LEVELS TO WATCH
by John Murphy,
Chief Technical Analyst, StockCharts.com
HOMEBUILDERS AND REITS ARE IN NEW UPTRENDS ... During the last week of July, I wrote a couple of bullish stories on housing related stocks. I also pointed out that their strong price action was a leading indication of better fundamentals to come in housing. Today's report that July...
READ MORE
MEMBERS ONLY
BULLISH PERCENT NUMBERS ARE OVERBOUGHT BUT STILL IN P&F UPTRENDS -- ONLY THE NASDAQ 100 AND MATERIAL SECTOR ARE SHOWING SIGNS OF WEAKNESS -- BULLISH PERCENT FOR GOLD GROUP IS NEUTRAL
by John Murphy,
Chief Technical Analyst, StockCharts.com
NYSE BULLISH PERCENT INDEX STILL IN UPTREND... Earlier in the week, I wrote about overbought readings in the Bullish Percent Indexes for the S&P 500 and the Nasdaq market. Today I'm showing the point & figure version of those two indexes. That's fitting since...
READ MORE
MEMBERS ONLY
COMMODITIES APPEAR TO HAVE COMPLETED A FIFTH WAVE ADVANCE WHICH MAKES A CORRECTION LIKELY -- CHINA AND COPPER HAVE RALLIED TOO FAR -- OIL LOSES UPSIDE MOMENTUM -- GOLD MAY BENEFIT FROM A CORRECTION IN STOCKS AND COMMODITIES
by John Murphy,
Chief Technical Analyst, StockCharts.com
CRB TRACKS THE EURO... Yesterday's message expressed the view that stocks and commodities appeared ripe for a downside correction. Both of those markets have been rising together since March. At the same time, the dollar has been dropping. I also showed that the Dollar Index appeared to have...
READ MORE
MEMBERS ONLY
S&P 500 AND NASDAQ 100 STALL AT MAJOR RESISTANCE LEVELS -- SEVERAL MARKET MEASURES SHOW VERY OVERBOUGHT MARKET -- DEFENSIVE MONEY MOVES INTO HEALTHCARE -- USING AN ETN TO BUY VOLATILITY
by John Murphy,
Chief Technical Analyst, StockCharts.com
OVERBOUGHT S&P 500 BACKS DOWN FROM 1000 BARRIER ... The week before leaving on vacation (July 28 to be exact) I wrote a market message warning that both the S&P 500 and the Nasdaq 100 had reached important overhead resistance barriers and were in overbought territory. I...
READ MORE
MEMBERS ONLY
GLOBAL STOCK AND COMMODITY CORRECTION MAY BE STARTING AS DEFENSIVE MONEY FLOWS BACK INTO THE DOLLAR AND TREASURY BONDS
by John Murphy,
Chief Technical Analyst, StockCharts.com
STOCK DROP STARTS IN ASIA... A 5% drop in China's Shanghai Stock Index started a global selling spree that has spread to the U.S. Chart 1 shows China iShares (FXI) gapping down 4.4% and undercutting its 50-day average. Chart 2 shows EAFE iShares (EFA) falling more...
READ MORE
MEMBERS ONLY
ON HIATUS THIS WEEK
by John Murphy,
Chief Technical Analyst, StockCharts.com
John will return for our next issue.......
READ MORE
MEMBERS ONLY
FINANCE SECTOR BACK TO PROMINENCE - XLF HOLDS ITS BREAKOUTS - BULLISH% FOR XLK STAYS STRONG - MARKING SUPPORTS FOR XLY - XLK STALLS FOR 3 WEEKS - BULLISH% FOR XLK IS OVERBOUGHT - RANKING BULLISH% INDICES - REVISITING ELLIOTT WAVE
by John Murphy,
Chief Technical Analyst, StockCharts.com
FINANCIALS GAIN SOME WEIGHT... Link for todays video. After more than doubling since March, the Financials SPDR (XLF) is now the second biggest sector in the S&P 500. This was surely not the case in March when XLF was trading around 6. The finance was already an important...
READ MORE
MEMBERS ONLY
FED TO END BOND PURCHASE PROGRAM - BONDS REMAIN RANGE BOUND - TECHS AND SMALL-CAPS LEAD STOCKS HIGHER - SETTING SHORT-TERM SUPPORT - ALL SECTORS PARTAKING IN BULL RUN - PROGRAMMING NOTE
by John Murphy,
Chief Technical Analyst, StockCharts.com
FED LEAVES RATES UNCHANGED... Link for todays video.
With signs the economy is stabilizing, the FOMC voted to keep interest rates unchanged. This means the Fed Funds target rate remains 0-.25%. Moreover, the Fed suggested that rates could stay low for an extended period of time. The Fed also...
READ MORE
MEMBERS ONLY
S&P 500 STALLS AT 1000 - ELLIOTT WAVE COUNTS - S&P 500 RETURNS TO FALLING CHANNEL - US DOLLAR INDEX RECOVERS AFTER SUPPORT BREAK - GOLD REACTS TO SURGING DOLLAR
by John Murphy,
Chief Technical Analyst, StockCharts.com
STOCKS CONTINUE AUGUST STALL... Link for todays video.
Stocks moved lower as the Fed began its two day meeting on Tuesday. The FOMC is expected to make its policy statement on Wednesday at 2:15PM, which means we may see some fireworks the next two days. The S&P...
READ MORE
MEMBERS ONLY
S&P 500 13-WEEK EMA CROSSES ABOVE 34-WEEK EMA - REVIEWING 13-34 CROSSOVER - ADDING MOMENTUM WITH THE PERCENTAGE PRICE OSCILLATOR - INCREASING SIGNALS WITH DAILY CHARTS - GOLD FORMS LARGE TRIANGLE - DOLLAR REMAINS OVERSOLD
by John Murphy,
Chief Technical Analyst, StockCharts.com
13-34 CROSSOVER FOR SPX... Link for todays video. A few readers inquired about the recent crossover in 13-week and 34-week exponential moving averages. John Murphy is the 13-34 specialist, but I can provide some insights until he returns. As the S&P 500 now stands (Thursday), the 13-week EMA...
READ MORE
MEMBERS ONLY
VOLATILITY CONTRACTS FOR QQQQ - RIG AND BHI LEAD OIL SERVICE HOLDRS LOWER - OIL FIRMS AS DOLLAR SOFTENS - POUND ETF BREAKS RESISTANCE - YEN ETF FIRMS AT SUPPORT - BONDS WILT AS SUPPLY ISSUES HIT HOME
by John Murphy,
Chief Technical Analyst, StockCharts.com
VOLATILITY CONTRACTS FOR QQQQ... Link for todays video. After a surge in mid July, the advance has slowed over the last two weeks and volatility has contracted. Chart 1 shows the Nasdaq 100 ETF (QQQQ) surging above 39 on July 23th and working its way towards 40 the last two...
READ MORE
MEMBERS ONLY
STOCKS TURN MIXED - SMALL-CAPS AND MID-CAPS LEAD MARKET - TECHS START TO LAG - FINANCIALS SPDR BREAKS MAY HIGH - REGIONAL BANK SPDR MAKES IT 10 STRAIGHT - REIT ETF POWER PAST JUNE HIGH
by John Murphy,
Chief Technical Analyst, StockCharts.com
MARKET TURNS MIXED... Link for todays video. Stocks turned mixed on Tuesday. The Russell 2000 ETF (IWM) and S&P 400 MidCap Index (MDY) spent most of the day in positive territory, but the Nasdaq 100 ETF (QQQQ) spent most of the day in negative territory. In the middle,...
READ MORE
MEMBERS ONLY
ITB VERSUS XHB
by John Murphy,
Chief Technical Analyst, StockCharts.com
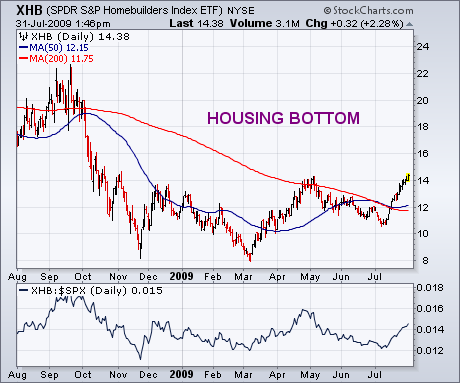
On Monday, I wrote a bullish message on the homebuilding group and suggested using the SPDR S&P Homebuilding ETF (XHB) as one way to participate in the housing recovery. I pointed out, however, that the XHB has a relatively heavy weighting in a lot of housing-related stocks that...
READ MORE
MEMBERS ONLY
ITB GIVES PURER HOMEBUILDING PLAY THAN XHB -- HOUSING STOCKS TELL US SOMETHING ABOUT THE HOUSING INDUSTRY -- SECOND EDITION OF THE VISUAL INVESTOR MAKES FOR GOOD SUMMER READING -- TWO WEEK HIATUS
by John Murphy,
Chief Technical Analyst, StockCharts.com
ITB VERSUS XHB... On Monday, I wrote a bullish message on the homebuilding group and suggested using the SPDR S&P Homebuilding ETF (XHB) as one way to participate in the housing recovery. I pointed out, however, that the XHB has a relatively heavy weighting in a lot of...
READ MORE