MEMBERS ONLY
SPY TRACES OUT POSSIBLE BROADENING FORMATION - BONDS CLOSE STRONG - CONSUMER DISCRETIONARY SPDR CONTINUES TO LEAD - FINANCE SECTOR SPDR HOLDS BREAKOUT - SCHWAB AND MORGAN STANLEY SURGE - REGIONAL BANK ETF BREAKS RESISTANCE
by John Murphy,
Chief Technical Analyst, StockCharts.com
OVERBOUGHT CONDITIONS REMAIN... Link for todays video. The major index ETFs have remained overbought for two weeks now. Charts 1, 2 and 3 show the S&P 500 ETF (SPY), Nasdaq 100 ETF (QQQQ) and Russell 2000 ETF (IWM) with the Commodity Channel Index (CCI). John Murphy and I...
READ MORE
MEMBERS ONLY
INTERMARKET TURMOIL COULD AFFECT STOCKS - DOLLAR FINDS SUPPORT - STRONG DOLLAR HITS GOLD - OIL DECLINES FROM KEY RETRACEMENT - BONDS BOUNCE OFF KEY RETRACEMENT
by John Murphy,
Chief Technical Analyst, StockCharts.com
INTERMARKET CHANGES COULD BE BEARISH FOR STOCKS ... Link for todays video. There has been a noticeable shift in the intermarket arena over the last few days. First, lets back up and look at intermarket relationships during the July rally. The S&P 500 bottomed the second week of July...
READ MORE
MEMBERS ONLY
THE S&P 500 IS WITHIN 2% OF 1000 RESISTANCE BARRIER AT NOVEMBER HIGH AND IN A SHORT-TERM OVERBOUGHT CONDITION --SO IS THE QQQQ WHICH HAS LED THE RALLY
by John Murphy,
Chief Technical Analyst, StockCharts.com
S&P 500 NEARS 1000 RESISTANCE BARRIER ... I wrote recently that an upside breakout in the S&P 500 could push it back to the high of last November near 1000. It is now trading within 20 points (or 2%) of that potential resistance barrier. There's...
READ MORE
MEMBERS ONLY
STRONG HOUSING DATA BOOSTS HOMEBUILDERS WHICH APPEAR TO HAVE BOTTOMED -- SOME HOMEBUILDING LEADERS -- TRADING THE XHB FOR A HOUSING-RELATED RECOVERY THAT INCLUDES MORE THAN HOMEBUILDERS
by John Murphy,
Chief Technical Analyst, StockCharts.com
HOMEBUILDERS RALLY... New home sales in the U.S. climbed 11% last month which is the biggest gain in eight years. Following that report, homebuilding stocks are trading higher. Judging from today's first chart, however, it appears that the market has been anticipating that good news for months....
READ MORE
MEMBERS ONLY
BIG DROP IN MICROSOFT CAUSES NERVOUS SELLING IN NASDAQ MARKET -- RSI LINE FOR THE NASDAQ 100 IS OVERBOUGHT FOR FIRST TIME SINCE SPRING BOTTOM -- THE QQQQ HAS RETRACED HALF OF ITS BEAR TREND AND IS NEARING OVERHEAD RESISTANCE
by John Murphy,
Chief Technical Analyst, StockCharts.com
MICROSOFT FALLS NEARLY 10% ON BIG VOLUME ... A nearly 10% drop in Microsoft is causing some profit-taking in the market today. Because of its huge size, Microsoft carries a lot of weight in the Nasdaq market which is leading today's profit-taking. Chart 1 shows MSFT gapping down nearly...
READ MORE
MEMBERS ONLY
S&P 500 CLEARS JUNE HIGH - SMALL-CAPS AND FINANCIALS LEAD - HEALTHCARE SPDR BREAKS FEBRUARY HIGH - DOW THEORY SIGNAL - DOLLAR HITS LONG-TERM SUPPORT - OIL FOLLOWS STOCKS - GOLD STALLS AFTER GAP
by John Murphy,
Chief Technical Analyst, StockCharts.com
STOCKS EXTEND GAINS WITH BROAD ADVANCE ... Link for todays video. Favorable reactions to earnings reports continued to propel stocks higher. The major indices were all sharply higher on Thursday with small-caps leading the way higher. It is positive to see small-caps showing relative strength. All sectors were also sharply higher...
READ MORE
MEMBERS ONLY
JUNE HIGHS MARK RESISTANCE FOR SPY - XLY BECOMES OVERBOUGHT - A SECOND CHANCE HEAD-AND-SHOULDERS - SMALL-CAPS LAG - TECHS LEAD - FINANCE STARTS TO LAG - REGIONAL BANKS CONTINUE TO LAG
by John Murphy,
Chief Technical Analyst, StockCharts.com
RESISTANCE LEVELS STILL IN PLAY... Link for todays video. Despite new reaction highs from a number technology related ETFs, other key ETFs have yet to exceed their June highs and some are meeting resistance from the June highs. Basically, ETFs trading above their June highs show relative strength, while ETFs...
READ MORE
MEMBERS ONLY
THE 1930S AND 1970S SHOW EARLIER EXAMPLES OF SECULAR BEAR TRENDS -- WHILE THE 1930S SAW BIGGER LOSSES, THE 1970S WERE FLAT -- THE TREND SINCE 2000 SHOWS A NINE-YEAR SECULAR BEAR MARKET
by John Murphy,
Chief Technical Analyst, StockCharts.com
STUDY OF EARLIER SECULAR BEARS... Last Friday, I wrote that any bull market at the current time would most likely be "cyclical" as opposed to "secular". I'd like to elaborate on that distinction. Secular trends are very long term in nature and can last...
READ MORE
MEMBERS ONLY
STEEPER YIELD CURVE CAUSED BY RISING BOND YIELDS IS A GOOD SIGN FOR STOCKS AND THE ECONOMY -- BOND YIELDS AND STOCKS HAVE BEEN TRENDING TOGETHER FOR THE LAST DECADE -- MONEY COMING OUT OF TREASURIES IS MOVING INTO STOCKS AND CORPORATE BONDS
by John Murphy,
Chief Technical Analyst, StockCharts.com
TREASURY YIELDS HAVE BOTTOMED ... The stock market is a leading indicator of the economy. Historically, stocks usually bottom about six months before the economy. With a stock bottom having formed in March, that leaves a time target for an economic bottom by September. Rising stock prices are one of the...
READ MORE
MEMBERS ONLY
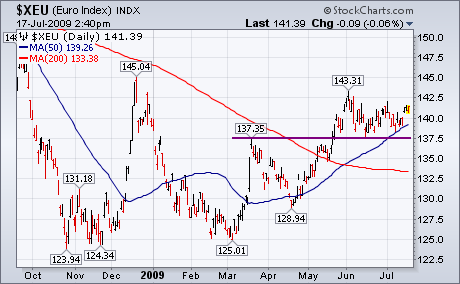
DOLLAR SELLS OFF AS EURO HOLDS SUPPORT
by John Murphy,
Chief Technical Analyst, StockCharts.com
It looks like you can throw out most of what I wrote last Friday. I was expecting a deeper market correction after most market indexes broke short-term head and shoulder "necklines" (and daily EMA lines turned negative). I also wrote about the possible threat from a rally in...
READ MORE
MEMBERS ONLY
STOCK RALLY RULES OUT HEAD AND SHOULDERS TOP -- FALLING DOLLAR BOOSTS COMMODITIES -- CHINA LEADS EMERGING MARKET ETFS -- THAT'S HELPING COPPER AND STEEL STOCKS -- CYCLICAL BULL MARKETS IN A SECULAR DOWNTREND CAN RALLY 50%
by John Murphy,
Chief Technical Analyst, StockCharts.com
STOCKS TURN HIGHER ... It looks like you can throw out most of what I wrote last Friday. I was expecting a deeper market correction after most market indexes broke short-term head and shoulder "necklines" (and daily EMA lines turned negative). I also wrote about the possible threat from...
READ MORE
MEMBERS ONLY
XLK AND QQQQ BREAK JUNE HIGHS - THINK BEFORE YOU LEAP - LOW VOLUME A MINOR CONCERN - USO HITS TRENDLINE SUPPORT - EXPONENTIAL MOVING AVERAGES VERSUS SIMPLE MOVING AVERAGES
by John Murphy,
Chief Technical Analyst, StockCharts.com
TECHS CONTINUE TO LEAD ... Link for todays video. The stock market moved higher on Thursday, but participation was a bit more mixed. Eight of the nine sectors were higher with the Financials SPDR (XLF) declining on the day. Technology showed relative strength with the second biggest gain on the day....
READ MORE
MEMBERS ONLY
SPY CHALLENGES JULY HIGH - QQQQ LEADS THE SURGE - SMH GAPS HIHGER - GOLD AND GDX MOVE SHARPLY HIGHER - DOLLAR BREAKS TRIANGLE SUPPORT - EURO HOLDS SUPPORT - MCCLELLAN OSCILLATORS REMAIN BEARISH
by John Murphy,
Chief Technical Analyst, StockCharts.com
SPY SURGES BACK TO JULY HIGH. ... After breaking below its May lows just seven days ago, the S&P 500 ETF (SPY) recouped its July losses with a surge over the last three days. The strength behind the move of the last three days is extraordinary (3 days, 5+...
READ MORE
MEMBERS ONLY
BROKERAGE UPGRADE GIVES FINANCIALS BIG BOOST -- S&P 500 CLOSES BACK ABOVE NECKLINE IN CHALLENGE OF HEAD AND SHOULDERS TOP
by John Murphy,
Chief Technical Analyst, StockCharts.com
FINANCIAL STOCKS JUMP 6%... A buy signal on Goldman Sachs by a prominent Wall Street analyst and an upgrade on bank stocks gave a big boost to that sector and the rest of the market with it. The Financials Sector SPDR (XLF) climbed 6.4% and it did so on...
READ MORE
MEMBERS ONLY
ANOTHER DROP IN CONSUMER CONFIDENCE WEAKENS STOCKS AS BROKEN SUPPORT BECOMES NEW RESISTANCE -- TREASURIES RALLY AS STOCKS AND COMMODITIES DROP -- A RIGHT SHOULDER RALLY IN THE DOLLAR COULD COINCIDE WITH A RIGHT SHOULDER BOTTOM IN STOCKS
by John Murphy,
Chief Technical Analyst, StockCharts.com
STOCK INDEXES CONTINUE TO SLIP ... Today's report of another drop in consumer confidence is contributing to more stock selling. Charts 1 through 3 show the downward drift in all three major stock indexes. Another negative sign for the market is that former support levels that have been broken...
READ MORE
MEMBERS ONLY
SPY BATTLES SUPPORT - RETAIL HOLDRS BREAK SUPPORT - REGIONAL BANKS REMAIN WEAK - REVIEWING THE 2002-2003 BASING PROCESS - PROJECTING PULLBACK TARGETS FOR SPY
by John Murphy,
Chief Technical Analyst, StockCharts.com
SPY AND DIA BATTLE SUPPORT... Link for todays video. After sharp declines in mid June and early July, the S&P 500 ETF (SPY) and Dow Diamonds (DIA) are testing support from the May lows. Chart 1 shows SPY with a head-and-shoulders pattern extending back to May. After breaking...
READ MORE
MEMBERS ONLY
YEN SURGES - EURO FAILS TO HOLD BREAKOUT - DOLLAR REMAINS IN DOWNTREND - GOLD PLUNGES ALONG WITH OIL - SPY STALLS NEAR NECKLINE BREAK - SECTOR ROTATIONS REFLECT DEFENSIVE POSTURING
by John Murphy,
Chief Technical Analyst, StockCharts.com
YEN GETS A BIG MOVE... Link for todays video. The Yen ETF (FXY) surged over 2% as money moved into relative safety. According to Bloomberg, the Yen advanced against its 16 biggest trading partners (other currencies). The biggest gains came against the South African Rand and the Australian Dollar, two...
READ MORE
MEMBERS ONLY
MARKET INDEXES BREAK MORE SUPPORT LEVELS AS VOLATILITY RISES -- SO DOES THE PUT/CALL RATIO -- RISING YEN SIGNALS MOVE TO LOWER RISK -- CRUDE OIL IS FALLING ALONG WITH STOCKS
by John Murphy,
Chief Technical Analyst, StockCharts.com
NASDAS 100 VIOLATES 50-DAY AVERAGE AS VOLATILITY RISES... I wrote yesterday that rising volatility measures for the Nasdaq (VXN) and the S&P 500 (VIX) were starting to rally which would be bearish for stocks. I also showed the Nasdaq 100 threatening to break its 50-day moving average. Chart...
READ MORE
MEMBERS ONLY
VOLATILITY INDEXES ARE BOUNCING OFF MAJOR SUPPORT LINES -- THE VIX ALSO HAS A SEASONAL TENDENCY TO BOTTOM IN JULY -- RISING VOLATILITY IS USUALLY ASSOCIATED WITH A WEAKER STOCK MARKET
by John Murphy,
Chief Technical Analyst, StockCharts.com
BOUNCING VIX TESTS 50-DAY MA... The CBOE Volatility (VIX) Index has been falling since March (as stocks have risen). The VIX peak in March near 53 coincided with the stock market bottom. A falling VIX is good for stocks since they trend in opposite directions. Correspondingly, a rising VIX is...
READ MORE
MEMBERS ONLY
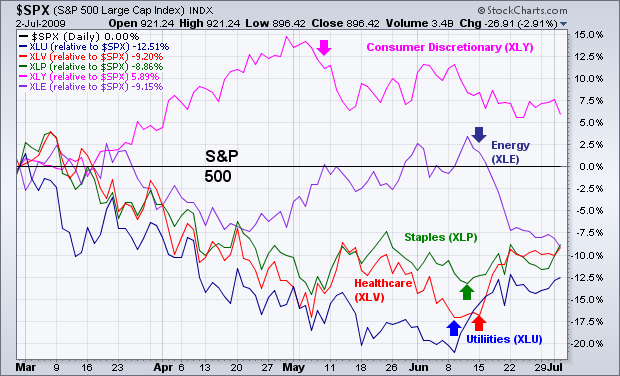
DEFENSIVE ROTATIONS DURING JUNE
by John Murphy,
Chief Technical Analyst, StockCharts.com
A sign that investors have turned more negative over the last month is the rotation out of economically-sensitive groups (like consumer discretionary and energy stocks) and into defensive groups (like utilities, consumer staples, and healthcare). Chart 3 shows relative strength lines for those five groups (versus a flat S&...
READ MORE
MEMBERS ONLY
SPRING RALLY ENDS AS S&P 500 FULFILLS INITIAL UPSIDE OBJECTIVES -- A SHORT-TERM HEAD AND SHOULDERS TOP COULD HELP COMPLETE A MAJOR HEAD AND SHOULDERS BOTTOM -- SECTOR ROTATION TURNS MORE DEFENSIVE
by John Murphy,
Chief Technical Analyst, StockCharts.com
S&P 500 HAS FULFILLED UPSIDE OBJECTIVES FOR NOW ... If you've been reading our market messages over the past couple of weeks, you know that we've called for an end to the spring rally and the start of a normal corrective process. There are several...
READ MORE
MEMBERS ONLY
STOCKS DECLINE AFTER JOBS REPORT- CLUES FROM THE 1998 SURGE - WATCHING THE MAY LOWS - MONTHLY TREND REMAINS DOWN - VOLATILITY CONTINUES TO FALL - CUMULATIVE NET NEW HIGHS CONTINUES TO RISE
by John Murphy,
Chief Technical Analyst, StockCharts.com
EMPLOYMENT REPORT ROCKS STOCKS... Non-farm payrolls declined 467,000 for June, which was worse than expected. Stocks took the news hard with a broad based decline in early trading. The major indices were down over 2% around noon. All sector ETFs were lower with the Consumer Discretionary SPDR (XLY) leading...
READ MORE
MEMBERS ONLY
STOCKS GIVE UP EARLY GAINS - BEARISH FAILURE SWING FOR RSI - INTEL AND TEXAS INSTRUMENTS LEAD SEMIS - DOLLAR DIPS AS RISK APPETITE INCREASES - GOLD BOUNCES OFF SUPPORT - OIL FAILS TO HOLD EARLY GAINS
by John Murphy,
Chief Technical Analyst, StockCharts.com
STOCKS GIVE UP EARLY GAINS... Link for todays video.
Stocks surged in early trading with the major index ETFs sporting nice gains after the first hour of trading. However, there was no follow through as stocks drifted lower the rest of the day. Charts 1, 2 and 3 show 60-minute...
READ MORE
MEMBERS ONLY
DROP IN CONSUMER CONFIDENCE WEIGHS ON STOCKS AS MARKET ENDS FIRST HALF OF YEAR -- A SHORT-TERM TOP MAY BE FORMING -- COMMODITIES ALSO SELL OFF AS DOLLAR BOUNCES -- TIPS REMAIN A SECOND QUARTER FAVORITE
by John Murphy,
Chief Technical Analyst, StockCharts.com
S&P 500 MAY END QUARTER ON FLAT NOTE... A drop in June consumer confidence to 49.3 from May's revised reading of 54.8 has caused some nervous selling in stocks as the market ends the month, quarter, and first half of the year. It remains...
READ MORE
MEMBERS ONLY
DOW AND S&P 500 BOUNCE OFF MAY LOW -- A SHORT-TERM TOP, HOWEVER, COULD LEAD TO A 38%-50% CORRECTION OF THE SPRING RALLY -- 200-DAY AVERAGES PROVIDE SUPPORT BUT ARE STILL DROPPING
by John Murphy,
Chief Technical Analyst, StockCharts.com
RUSSELL RE-BALANCING CAUSES LATE VOLUME SPIKE... In yesterday's message, I showed the Dow and S&P 500 bouncing off chart support near their May lows. The ability to bounce off initial support prevented a more serious breakdown. I also suggested, however, that the late-week bounce could still...
READ MORE
MEMBERS ONLY
DOW BOUNCES OFF MAY LOW WHILE NASDAQ HOLDS MAY HIGH -- STOCK INDEXES, HOWEVER, ARE STILL TRADING BELOW LAST WEEK'S HIGH -- MOVING AVERAGE LINES HAVE PROVIDED SUPPORT DURING RECENT PULLBACK
by John Murphy,
Chief Technical Analyst, StockCharts.com
DOW AND S&P BOUNCE OFF MAY LOWS... During any market pullback, the first layer of support is usually a previous reaction low. That's why we chose the May low as our initial downside target for the Dow and S&P 500 indexes. Arthur Hill showed...
READ MORE
MEMBERS ONLY
DIA BOUNCES OFF SUPPORT - QQQQ SHOWS RELATIVE STRENGTH - MICROSOFT PACES PC STOCKS - THE MAY LOWS ARE HOLDING - XLV LEADS THE MARKET - LLY AND BMY BREAK OUT - FINANCE SECTOR STILL LAGGING - JPM AND WFC EDGE LOWER
by John Murphy,
Chief Technical Analyst, StockCharts.com
DIA BOUNCES OFF SUPPORT... Chart 1 shows the Dow Diamonds (DIA) bouncing off support from the May lows with a bullish engulfing on Thursday. As DIA tested support, notice that the Commodity Channel Index (CCI) became oversold with the decline below 84. The combination of oversold conditions and support set...
READ MORE
MEMBERS ONLY
DOW TESTS MAY LOWS - TRANSPORTS FORM DOUBLE TOP - RETAIL HOLDRS SHOWS RELATIVE WEAKNESS - WAL-MART WEIGHS ON RETAIL - SMH BREAKS PITCHFORK TRENDLINE - EURO GIVES BACK GAINS - GOLD FIRMS AT SUPPORT
by John Murphy,
Chief Technical Analyst, StockCharts.com
INDUSTRIALS AND TRANSPORTS TEST MAY LOWS... After a sharp decline in June, a number of key indices, ETFs and stocks are testing support from their May lows. First up, chart 1 shows the Dow Industrials with support from broken resistance around 8200. This support area was confirmed with a couple...
READ MORE
MEMBERS ONLY
EMERGING MARKETS LEAD DECLINE IN GLOBAL STOCKS AND COMMODITIES -- S&P 500 IS RETESTING ITS 200-DAY AVERAGE --TRANSPORTS, REITS, AND CHIPS HAVE BROKEN 50-DAY LINES AS DOWNSIDE CORRECTION DEEPENS -- BONDS AND DOLLAR BOUNCE
by John Murphy,
Chief Technical Analyst, StockCharts.com
S&P 500 RETESTS 200-DAY AVERAGE ... My final chart on Friday showed hourly bars for the S&P 500 SPDRs starting to back off from overhead resistance starting at 92.76 which translated into 927 for the S&P 500. I suggested that a failure at that...
READ MORE
MEMBERS ONLY
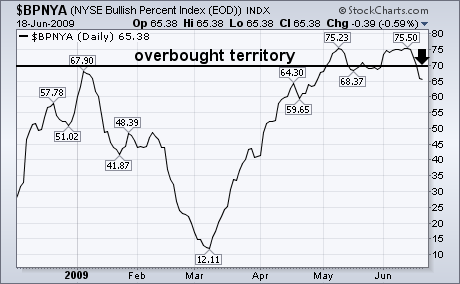
BPNYA TURNS DOWN FROM OVERBOUGHT TERRITORY
by John Murphy,
Chief Technical Analyst, StockCharts.com
I recently showed the NYSE Bullish Percent Index (BPNYA) having reached overbought territory over 70. the BPNYA is the percent of NYSE stocks that are in point & figure uptrends. I suggested that a drop below the May trough at 68 could signal a short-term top. Chart 1 shows that...
READ MORE
MEMBERS ONLY
NYSE BULLISH PERCENT INDEX TURNS DOWN -- 13 AND 34 WEEK EMAS HAVEN'T CROSSED -- DON'T CONFUSE SHORT- AND LONG-TERM VIEWS -- THE 200-DAY AVERAGE HOLDS THE KEY TO SHORT-TERM MARKET DIRECTION
by John Murphy,
Chief Technical Analyst, StockCharts.com
BPNYA TURNS DOWN FROM OVERBOUGHT TERRITORY ... I recently showed the NYSE Bullish Percent Index (BPNYA) having reached overbought territory over 70. the BPNYA is the percent of NYSE stocks that are in point & figure uptrends. I suggested that a drop below the May trough at 68 could signal a...
READ MORE
MEMBERS ONLY
SPY HITS RESISTANCE ZONE - MEDIUM-TERM MOMENTUM REMAINS BULLISH FOR SPY - QQQQ STALLS NEAR BROKEN RESISTANCE - BREADTH CONTINUES TO WEAKEN - AD VOLUME LINE FORMS NEGATIVE DIVERGENCE - VIX NEARS DOWNTREND RESISTANCE
by John Murphy,
Chief Technical Analyst, StockCharts.com
SPY HITS RESISTANCE ON WEEKLY CHART... There is still a compelling case for a stock market correction or decline from current levels. Chart 1 show the S&P 500 ETF (SPY) surging over 40% from its March low without a correction. Even though the spring uptrend remains in place,...
READ MORE
MEMBERS ONLY
SEMICONDUCTORS STAY STRONG - HEALTHCARE REBOUNDS - BMY AND PFE PACE HEALTHCARE - BIOTECHS SURGE - AMGN AND GILD LEAD BIOTECHS HIGHER - INTERMARKET PICTURE FLIPS IN JUNE - TECHNOLOGY REMAINS A STRONG SECTOR
by John Murphy,
Chief Technical Analyst, StockCharts.com
SEMIS HOLD THE UPTREND... Link for todays video.
The Semiconductors HOLDRS (SMH) remains in an uptrend that has yet to reverse. Chart 1 shows SMH with Andrews Pitchfork (blue lines). The indicators icon is shown at the top of the price chart. After selecting the indicator, users then choose (click)...
READ MORE
MEMBERS ONLY
RESPONSES TO QUESTIONS ON MCCLELLANN OSCILLATORS, DOW THEORY WEEKLY SIGNALS, AND GOLDEN CROSSES -- THE BOTTOM LINE IS THAT GLOBAL STOCKS APPEAR TO BE ENTERING A DOWNSIDE CORRECTION -- TECHNICAL SIGNS SUGGEST THE SPRING RALLY HAS PROBABLY ENDED
by John Murphy,
Chief Technical Analyst, StockCharts.com
MCCLELLAN OSCILLATORS ARE NEGATIVE ... One of our readers points out that the McClellan Oscillators for the NYSE (NYMO) and the Nasdaq (NAMO) are both in negative territory and are showing negative divergence from their price indexes. The reader is right on both counts. On May 16, I pointed out the...
READ MORE
MEMBERS ONLY
GLOBAL STOCKS AND COMMODITIES SLIDE AS DOLLAR REBOUNDS -- RAILS LEAD TRANSPORTS LOWER -- MAJOR INDEXES MAY RETEST 200-DAY MOVING AVERAGE LINES
by John Murphy,
Chief Technical Analyst, StockCharts.com
DOLLAR CONTINUES BOUNCE OFF DECEMBER LOW ... On Friday June 5, I showed the U.S. Dollar Index starting to bounce off chart support at its December low. I also showed the Euro pulling back from resistance at its December peak. I wrote that a drop in the Euro (dollar rally)...
READ MORE
MEMBERS ONLY
DOW THEORY UPDATE -- DOW TRANSPORTS FAIL TO CONFIRM LAST UPMOVE IN DOW INDUSTRIALS -- DOW THEORY OVERLAPS WITH ELLIOTT WAVES -- MAJOR DOWNSIDE OBJECTIVES WERE COMPLETED IN MARCH -- THE KEY NOW LIES WITH THE S&P 500 EXCEEDING ITS JANUARY HIGH
by John Murphy,
Chief Technical Analyst, StockCharts.com
JANUARY HIGHS ARE THE KEY ... One of our readers asked for an update on Dow Theory. For those of you not familiar with it, Dow Theory requires that the Dow Industrials and Transports must both exceed a previous peak to signal that a "confirmed" uptrend exists. The key...
READ MORE
MEMBERS ONLY
ENERGY STOCKS LEAD - BASE METALS SURGE - OIL CONTINUES ITS ADVANCE - GOLD MEETS RESISTANCE - DOLLAR ATTEMPTS TO FIRM AT SUPPORT - CONSUMER DISCRETIONARY SECTOR LAGS BROADER MARKET
by John Murphy,
Chief Technical Analyst, StockCharts.com
ENERGY STOCKS LEAD THE MARKET... The Energy SPDR (XLE) led the market higher with a surge above resistance on Thursday. Chart 1 shows XLE breaking above resistance from the November-January highs. Prior to this breakout, XLE broke triangle resistance in late April and again in late May. The energy SPDR...
READ MORE
MEMBERS ONLY
ANALYZING DIVERGENCES - PPO DIVERGENCES FORM IN IWM AND SPY - RSI BECOMES OVERBOUGHT FOR QQQQ - GAS AND INTEREST RATES CONTINUE TO RISE - REGIONAL BANK ETF SHOWS RELATIVE WEAKNESS
by John Murphy,
Chief Technical Analyst, StockCharts.com
DISSECTING DIVERGENCES ... There are some negative divergences to report, but first lets review the definition and look at some prior signals. A negative divergence occurs when the underlying security moves to a new high, but the indicator fails to exceed its prior high. This lower high in the indicator signals...
READ MORE
MEMBERS ONLY
POINT & FIGURE CHARTS OFFER EASILY SPOTTED BUY AND SELL SIGNALS -- USING STOCK SCAN P&F ALERTS -- NYSE BULLISH PERCENT INDEX IS IN UPTREND BUT OVERBOUGHT
by John Murphy,
Chief Technical Analyst, StockCharts.com
POINT & FIGURE CHARTING... Although most of the charts shown in our Market Messages are bar and candlesticks, you should be aware of a third type of chart that can be extremely helpful in spotting market signals -- the point and figure chart. In my view, the main value of...
READ MORE
MEMBERS ONLY
SPIKE IN 2-YEAR TREASURY YIELD SUPPORTS DOLLAR BUT CAUSES PROFIT-TAKING IN STOCKS AND COMMODITIES -- S&P 500 MANAGES TO HOLD ABOVE INITIAL CHART SUPPORT AT 925 AND ITS 200-DAY MOVING AVERAGE
by John Murphy,
Chief Technical Analyst, StockCharts.com
2-YEAR TREASURY YIELD SPIKES ... On Friday, I showed the U.S. Dollar Index bouncing from chart support at its December low, and suggested that a dollar bounce could cause short-term profit-taking in stocks and commodities. We saw some of that on Monday morning as stocks and commodities started the week...
READ MORE