MEMBERS ONLY
Big Techs Lead Market Retreat
by John Murphy,
Chief Technical Analyst, StockCharts.com
A selloff in the biggest tech stocks is putting downside pressure on stocks today; and is helping make the Nasdaq 100 the day's biggest percentage loser. And it looks technically vulnerable to a deeper pullback. The daily bars in Chart 1 show the Nasdaq 100 (QQQ) testing its...
READ MORE
MEMBERS ONLY
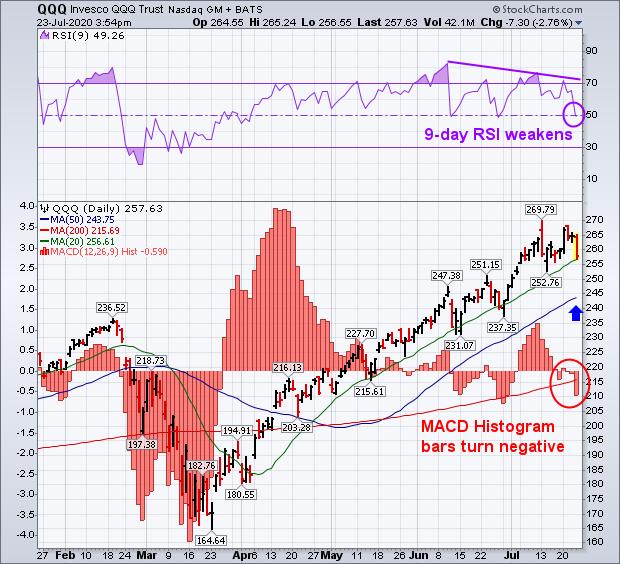
BIG TECHS LEAD MARKET RETREAT -- NASDAQ 100 IS BIGGEST LOSER AND LOOKS VULNERABLE TO DEEPER PULLBACK
by John Murphy,
Chief Technical Analyst, StockCharts.com
NASDAQ 100 TESTS 20-DAY LINE... A selloff in the biggest tech stocks is putting downside pressure on stocks today; and is helping make the Nasdaq 100 the day's biggest percentage loser. And it looks technically vulnerable to a deeper pullback. The daily bars in Chart 1 show the...
READ MORE
MEMBERS ONLY
EURO CLIMBS TO TWO -YEAR HIGH -- THAT'S GOOD FOR EUROZONE ETFS -- GERMAN ISHARES NEAR BULLISH BREAKOUT -- WEAK DOLLAR BOOSTS EMERGING MARKETS
by John Murphy,
Chief Technical Analyst, StockCharts.com
EURO RALLIES TO TWO-YEAR HIGH... Yesterday's message showed the euro testing its March high. Chart 2 shows the eurozone currency trading above that level in today's trading. That puts the euro at the highest level in nearly two years. The rising euro is putting more downside...
READ MORE
MEMBERS ONLY
RISING EURO PUSHES DOLLAR TO LOWEST LEVEL SINCE MARCH -- A WEAKER DOLLAR IS BOOSTING ENERGY AND METAL PRICES -- AND STOCKS TIED TO THEM
by John Murphy,
Chief Technical Analyst, StockCharts.com
RISING EURO PUSHES DOLLAR LOWER...Chart 1 show the Invesco Dollar Index Bullish Fund (UUP) declining today to the lowest level since March. The dollar surged during the first quarter in a flight to safety as stock prices plunged. Then fell from late March to July as stocks recovered. And...
READ MORE
MEMBERS ONLY
SILVER ISHARES REACH FOUR-YEAR HIGH -- SILVER CONTINUES TO OUTPACE GOLD --THE GOLD/SILVER RATIO AT ALL-TIME HIGH -- WHICH MAKES SILVER HISTORICALLY CHEAP
by John Murphy,
Chief Technical Analyst, StockCharts.com
SILVER ISHARES HIT FOUR-YEAR HIGH... Precious metals (and their mining ETFs) are rising again today with all of them hitting multi-year highs. As has been the case recently, however, silver (and its miners) are actually rising faster than gold (and its miners). The black daily bars in Chart 1 show...
READ MORE
MEMBERS ONLY
TRUCKERS LEAD TRANSPORTS HIGHER -- JB HUNT, OLD DOMINION, AND KNIGHT-SWIFT TRANSPORTATION HIT RECORD HIGHS -- C.H. ROBINSON IS TURNING UP...LANDSTAR MAY BE NEARING UPSIDE BREAKOUT
by John Murphy,
Chief Technical Analyst, StockCharts.com
RAILS AND TRUCKERS LEAD TRANSPORTS HIGHER... Wednesday's message showed the Dow Transports closing above their 200-day line for the first time since early June. Chart 1 shows them continuing to build on that upturn. Their relative strength ratio in the upper box has turned up as well, which...
READ MORE
MEMBERS ONLY
S&P 500 TESTS TOP OF RECENT RANGE -- RUSSELL 2000 AND DOW TRANSPORTS CLEAR 200-DAY LINES -- VALUE STOCKS GAIN GROUND -- HEALTHCARE HITS NEW RECORD -- MATERIAL STOCKS MAY BE NEXT
by John Murphy,
Chief Technical Analyst, StockCharts.com
S&P 500 TESTS JUNE HIGH... Stocks gained more ground today with ten of eleven sectors in the black. Chart 1 shows the S&P 500 ending the day just below its early June intra-day high at 3233. Also encouraging was better participation by value stocks which have...
READ MORE
MEMBERS ONLY
ENERGY, MATERIALS, INDUSTRIALS, AND HEALTHCARE LEAD STOCKS HIGHER -- CATERPILLAR AND DEERE ARE XLI LEADERS -- ALIGN TECH AND UNITEDHEALTH ARE XLV LEADERS -- STOCKS CLOSE STRONG
by John Murphy,
Chief Technical Analyst, StockCharts.com
CATERPILLAR AND DEERE HAVE A STRONG DAY...With technology stocks underperforming for the second day in a row, money flowed into cheaper parts of the market today. All eleven sectors closed higher with energy, materials, industrials and healthcare in the lead. Energy is benefiting from crude oil prices over $40,...
READ MORE
MEMBERS ONLY
HEALTHCARE IS DAY'S STRONGEST SECTOR -- AND MAY BE READY TO RESUME LEADERSHIP ROLE -- HEALTHCARE LEADERS ARE LAB CORP, QUEST DIAGNOSTICS AND PERKINELMER -- S&P 500 TESTS ITS JUNE HIGH -- WHILE THE DOW TRADES ABOVE ITS 200-DAY LINE
by John Murphy,
Chief Technical Analyst, StockCharts.com
BUYING HEALTHCARE AGAIN... After taking a leadership role during March and April, healthcare stocks have essentially moved sideways over the last couple of months while the rest of the market has gained ground. The sector's recent underperformance can be seen by the falling XLV/SPX relative strength ratio...
READ MORE
MEMBERS ONLY
Long-Term Trend Shifting in Favor of Gold
by John Murphy,
Chief Technical Analyst, StockCharts.com
Recent messages showing the ongoing bull market in gold (and its miners) have stressed that a weaker dollar and historically low global interest rates have pushed the price of gold to the highest level in nearly nine years. Yesterday's message showed gold rising faster than the world'...
READ MORE
MEMBERS ONLY
LONG-TERM TREND SHIFTING IN FAVOR OF GOLD -- GOLD/DOW RATIO MAY BE BOTTOMING -- RATIO OF GOLD MINERS TO SPX IS EVEN STRONGER
by John Murphy,
Chief Technical Analyst, StockCharts.com
LONG-TERM TREND APPEARS TO BE SHIFTING TO GOLD OVER STOCKS... Recent messages showing the ongoing bull market in gold (and its miners) have stressed that a weaker dollar and historically low global interest rates have pushed the price of gold to the highest level in nearly nine years. Yesterday'...
READ MORE
MEMBERS ONLY
A WEAKER DOLLAR IS HELPING TO BOOST GOLD -- BUT GOLD IS ALSO RISING FASTER THAN MAJOR FOREIGN CURRENCIES ON CONCERNS ABOUT GLOBAL ECONOMY -- INVESTORS MAY ALSO BE BUYING GOLD TO HEDGE AGAINST AN UNCERTAIN STOCK MARKET
by John Murphy,
Chief Technical Analyst, StockCharts.com
GOLD VERSUS THE DOLLAR... The generally inverse relationship between gold and the U.S. Dollar is one of the best known and reliable intermarket relationships. Part of the reason is that gold is traded in U.S. dollars. Another part is due to the fact that gold is often preferred...
READ MORE
MEMBERS ONLY
GOLD SPDR REACHES AN EIGHT-YEAR HIGH -- ITS MINERS ARE ALSO HITTING MULTI-YEAR HIGHS -- SILVER IS RALLYING AS WELL -- ITS MINERS ARE LEADING THE COMMODITY HIGHER
by John Murphy,
Chief Technical Analyst, StockCharts.com
GOLD SPDR REACHES ANOTHER EIGHT-YEAR HIGH...Gold prices are on the rise again. The monthly bars in Chart 1 show the Gold Shares SPDR (GLD) rising to the highest level since 2012. The August gold contract has risen to $1820 and appears headed toward its 2011 peak at $1923. Gold...
READ MORE
MEMBERS ONLY
RISING CHINESE STOCKS PULL COPPER HIGHER -- ALONG WITH COPPER PRODUCERS -- FREEPORT MCMORAN IS DAY'S SPX LEADER
by John Murphy,
Chief Technical Analyst, StockCharts.com
CHINESE STOCKS AND COPPER HAVE BEEN RISING TOGETHER...This morning's message showed the Shanghai Stock Index surging to the highest level in two years; and mentioned that was also good for copper prices. This message elaborates a bit more on the relationship between the two. The red bars...
READ MORE
MEMBERS ONLY
CHINESE STOCKS LEAD GLOBAL STOCKS HIGHER -- CHINESE ETFS NEAR MAJOR UPSIDE BREAKOUTS -- ASIA LEADS EMERGING MARKETS HIGHER -- STRONGER CHINA BOOSTS COPPER PRICES
by John Murphy,
Chief Technical Analyst, StockCharts.com
CHINESE STOCK SOAR... A huge rally in China is leading a rally in stock markets around the world. The red arrow in Chart 1 shows the Shanghai Composite Index surging 5.7% to close at the highest level in more than two years. The SSEC close at 3332 also puts...
READ MORE
MEMBERS ONLY
A Tale of Two Markets
by John Murphy,
Chief Technical Analyst, StockCharts.com
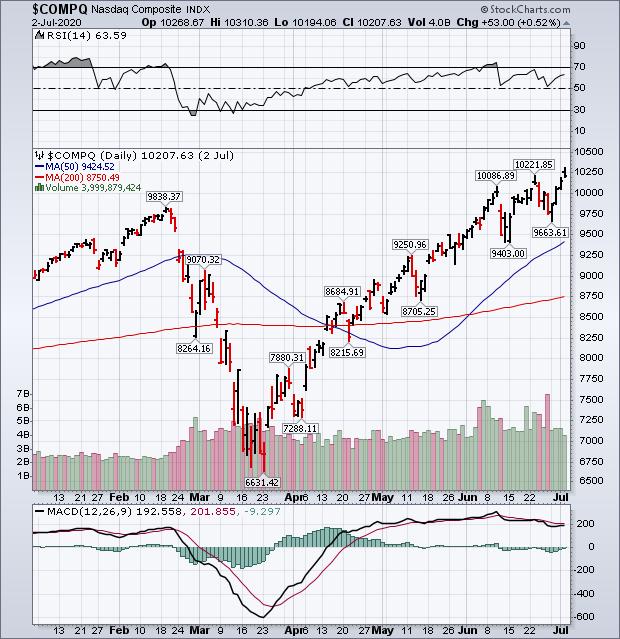
Despite gaining ground this past week, little has changed for the market's major stock indexes. Continued buying of technology growth stocks pushed the Nasdaq Composite to a new record (Chart 1). The rest of the market, however, continued to lag behind. Chart 2 shows the S&P...
READ MORE
MEMBERS ONLY
STRONG JOBS REPORT BOOSTS STOCKS -- NASDAQ HITS NEW HIGH -- WHILE DOW AND S&P 500 REMAIN IN TRADING RANGES -- AIRLINES AND FINANCIALS REMAIN WEAK -- SMALL CAPS LAG BEHIND -- A TALE OF TWO MARKETS
by John Murphy,
Chief Technical Analyst, StockCharts.com
DOW AND SPX REMAIN IN TRADING RANGES...Despite gaining ground this past week, little has changed for the market's major stock indexes. Continued buying of technology growth stocks pushed the Nasdaq Composite to a new record (Chart 1). The rest of the market, however, continued to lag behind....
READ MORE
MEMBERS ONLY
WEAK DOLLAR BOOSTS COMMODITY PRICES -- CRUDE OIL, COPPER, GOLD HAVE STRONG QUARTER -- SO DO STOCKS TIED TO THEM -- GOLD TOUCHES 11-YEAR HIGH -- WITH A LOT OF HELP FROM LOW INTEREST RATES
by John Murphy,
Chief Technical Analyst, StockCharts.com
US DOLLAR HAD WEAK SECOND QUARTER... After surging during March (as stock prices plunged), the U.S. Dollar peaked in late March and moved lower during the second quarter. Rising stock prices during that quarter reduced the appeal of the dollar as a haven currency. Rising foreign currencies also reflected...
READ MORE
MEMBERS ONLY
UPSIDE GAPS IN FEDEX AND UPS BOOST TRANSPORTS -- A REBOUND IN AIRLINE STOCKS IS ALSO HELPING -- BOTH GROUPS ARE ALSO CONTRIBUTING TO THE XLI
by John Murphy,
Chief Technical Analyst, StockCharts.com
DOW TRANSPORTS NEAR TEST OF 200-DAY AVERAGE...Transportation stocks are off to a strong start this morning. Chart 1 shows the Dow Transports rising to a two-week high after bouncing off their 50-day moving average last week. They may be headed for a test of their 200-day moving average. Tranportation...
READ MORE
MEMBERS ONLY
STOCKS OFF TO A STRONG START -- DOW AND S&P 500 HOLD CHART SUPPORT -- SMALL CAPS ARE HAVING A STRONG DAY -- BOEING AND SOUTHWEST AIR LEAD INDUSTRIALS
by John Murphy,
Chief Technical Analyst, StockCharts.com
DOW AND SPX HOLD CHART SUPPORT... Stocks are off to a strong start for the week. And are holding some important support levels. Chart 1 shows the Dow Industrials bouncing off potential chart support at its 50-day average (blue line) and its early June intra-day low at 24,800. It&...
READ MORE
MEMBERS ONLY
STOCKS WEAKEN AS CORONAVIRUS CASES RISE -- NASDAQ PULLS BACK FROM OVERBOUGHT CONDITION -- WHILE S&P 500 ENDS BELOW ITS 200-DAY LINE -- SECTOR LEADERSHIP REMAINS THIN -- FINANCIALS HAVE A BAD WEEK -- FACEBOOK LEADS INTERNET STOCKS LOWER
by John Murphy,
Chief Technical Analyst, StockCharts.com
MAJOR STOCK INDEXES WEAKEN... Major stock indexes lost ground this week on a disturbing rise in coronavirus cases which could undermine the U.S. economy. Chart 1 shows the Nasdaq Composite pulling back from a record high set on Tuesday. Its 14-day RSI line in the upper box shows a...
READ MORE
MEMBERS ONLY
APPAREL RETAILERS LEAD XLY HIGHER -- AIRLINES ARE HOLDING TRANSPORTS BACK -- STRONGER RAILS AND TRUCKERS ARE A VOTE OF CONFIDENCE IN THE U.S. ECONOMY
by John Murphy,
Chief Technical Analyst, StockCharts.com
APPAREL RETAILERS LEAD XLY HIGHER... Chart 1 shows the Consumer Discretionary SPDR (XLY) trading at the highest level in three months and north of its 200-day average. The XLY/SPX relative strength ratio in the upper box is also rising. Apparel retailers are leading the XLY higher. Chart 2 shows...
READ MORE
MEMBERS ONLY
STOCKS HAVE ANOTHER STRONG DAY -- S&P 500 NEARS TEST OF 200-DAY AVERAGE -- ALL ELEVEN SECTORS ARE GAINING -- SMALLER STOCKS SHOW STRONG GAINS
by John Murphy,
Chief Technical Analyst, StockCharts.com
STOCKS CONTINUE RALLY MODE... Stock prices are trading sharply higher again today. Chart 1 shows the Nasdaq Composite Index ($COMPQ) trading at a three month high. Chart 2 shows the S&P 500 nearing a test of its 200-day moving average. Chart 3 shows the Dow Industrials nearing a...
READ MORE
MEMBERS ONLY
SEMICONDUCTORS LEAD TECH SECTOR HIGHER -- CHIPS LEADERS ARE NVIDIA, SKYWORKS, AND INTEL
by John Murphy,
Chief Technical Analyst, StockCharts.com
SEMIS LEAD TECH SPDR HIGHER... Technology is the day's strongest sector. Chart 1 shows the Technology Sector SPDR (XLK) rising today to the highest level in nearly three months. It's being led higher by semiconductors . Chart 2 shows the PHLX Semiconductor iShares (SOXX) moving above its...
READ MORE
MEMBERS ONLY
STOCKS SURGE ON VACCINE OPTIMISM -- MAJOR INDEXES NEAR TEST OF RECENT HIGHS -- SMALL STOCKS SURGE AS WELL -- CONSUMER CYCLICALS CLEAR 200-DAY LINE -- MODERNA SURGES ON VACCINE NEWS
by John Murphy,
Chief Technical Analyst, StockCharts.com
STOCKS SURGE ON VACCINE OPTIMISM... A report that a vaccine developed by Moderna is showing positive results helped push stocks sharply higher today. Charts 1 and 2 show the Dow Industrials and S&P 500 gapping higher and in position to test their recent highs. The SPX may also...
READ MORE
MEMBERS ONLY
Stock Indexes Stabilize
by John Murphy,
Chief Technical Analyst, StockCharts.com
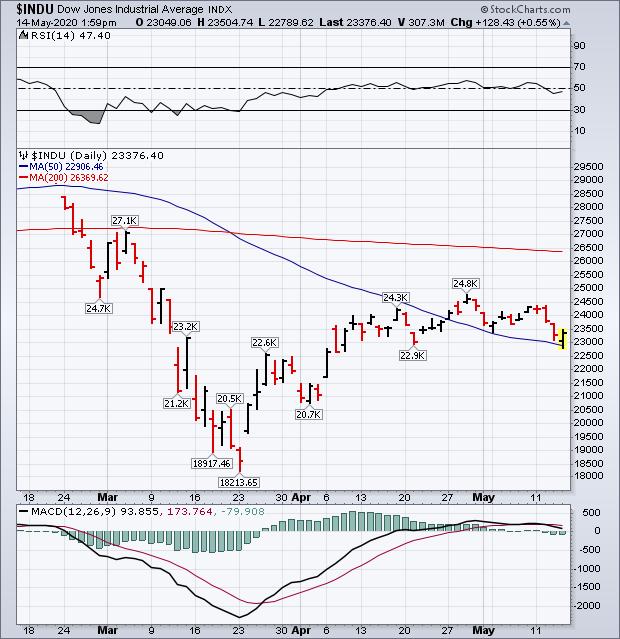
After a weak start this morning, major stock indexes are stabilizing near some short-term support levels. Chart 1 shows the Dow Industrials finding support at its 50-day moving average and its mid-April intraday low at 22900. Chart 2 shows the S&P 500 holding support at 2797. So far,...
READ MORE
MEMBERS ONLY
STOCK INDEXES STABILIZE -- FINANCIALS REBOUND -- BANK INDEX TESTS MARCH LOW
by John Murphy,
Chief Technical Analyst, StockCharts.com
STOCK INDEXES STABILIZE NEAR SUPPORT... After a weak start this morning, major stock indexes are stabilizing near some short-term support levels. Chart 1 shows the Dow Industrials finding support at its 50-day moving average and its mid-April intraday low at 22900. Chart 2 shows the S&P 500 holding...
READ MORE
MEMBERS ONLY
STOCKS START THE DAY UNDER PRESSURE -- SMALL CAPS ARE LEADING THE DECLINE -- SO ARE FINANCIALS AND INDUSTRIALS
by John Murphy,
Chief Technical Analyst, StockCharts.com
DOW AND S&P 500 WEAKEN... Stock prices are continuing the pullback that began yesterday afternoon. And some short-term support levels may soon be tested. Chart 1 shows the Dow Industrials slipping below their 20-day average (green line) and in position to test their early May low at 23400....
READ MORE
MEMBERS ONLY
NASDAQ TURNS POSITIVE FOR YEAR -- S&P 500 MAY RETEST APRIL HIGH -- USING SCTR LINES TO RANK SECTORS
by John Murphy,
Chief Technical Analyst, StockCharts.com
STOCKS RALLY ON BAD ECONOMIC NEWS... Last weekend's message suggested that the spring rally in stocks may have peaked. Judging from this week's strong price action, that doesn't appear to be the case. Stock prices have shown remarkable resilience in the face of very...
READ MORE
MEMBERS ONLY
CONSUMER DISCRETIONARY SPDR MAY BE NEXT TO CHALLENGE 200-DAY LINE -- EBAY IS ONE OF ITS BEST PERFORMERS -- SO ARE CHIPOTLE, TRACTOR SUPPLY, AND ROLLINS -- AND HOME IMPROVEMENT STOCKS
by John Murphy,
Chief Technical Analyst, StockCharts.com
CONSUMER DISCRETIONARY SPDR NEARS 200-DAY LINE... Yesterday's message showed the Communication Services SPDR (XLC) trying to clear its 200-day moving average which it has done. The next in line may be consumer cyclicals. Chart 1 shows the Consumer Discretionary SPDR (XLY) nearing a test of its red line....
READ MORE
MEMBERS ONLY
COMMUNICATION SPDR STILL TESTING 200-DAY LINE -- INTERNET STOCKS ARE LEADING IT HIGHER -- USING SCTR RANKINGS TO FIND STOCK LEADERS
by John Murphy,
Chief Technical Analyst, StockCharts.com
XLC CONTINUES TO TEST 200-DAY LINE... Tuesday's message showed the Communication Services SPDR (XLC) challenging its 200-day moving average. Chart 1 shows that test still in progress. Its relative strength line in the lower box has also been rising. Internet stocks are the main driver behind recent XLC...
READ MORE
MEMBERS ONLY
STOCKS OPEN HIGHER -- NASDAQ CONTINUES TO LEAD -- CHIPS REGAIN 200-DAY LINE -- MICROSOFT AND APPLE REMAIN STRONG -- ALHPABET AND FACEBOOK LEAD COMMUNICATION SERVICES SPDR HIGHER
by John Murphy,
Chief Technical Analyst, StockCharts.com
STOCKS OPEN ON A STRONG NOTE... Stock prices opened much higher this morning. And all three major stock indexes are bouncing off some moving average lines. Chart 1 shows the Dow Industrials bouncing off their 20- and 50-day moving averages which is usually their first line of support. Chart 2...
READ MORE
MEMBERS ONLY
STOCK INDEXES MAY HAVE PEAKED -- THE QUESTION IS HOW MUCH WILL THEY RETRACE -- FALLING CHIP STOCKS THREATEN NASDAQ UPTREND -- AMAZON IS THE FIRST OF BIG FIVE TO BE SOLD
by John Murphy,
Chief Technical Analyst, StockCharts.com
STOCK RALLY MAY HAVE PEAKED... A number of short-term technical indicators suggest that the spring rebound in stocks may have peaked this past week. The daily bars in Chart 1 show the S&P 500 selling off on Thursday and Friday after touching its 62% Fibonnaci retracement line (purple...
READ MORE
MEMBERS ONLY
Amazon Weighs on Consumer Cyclicals
by John Murphy,
Chief Technical Analyst, StockCharts.com
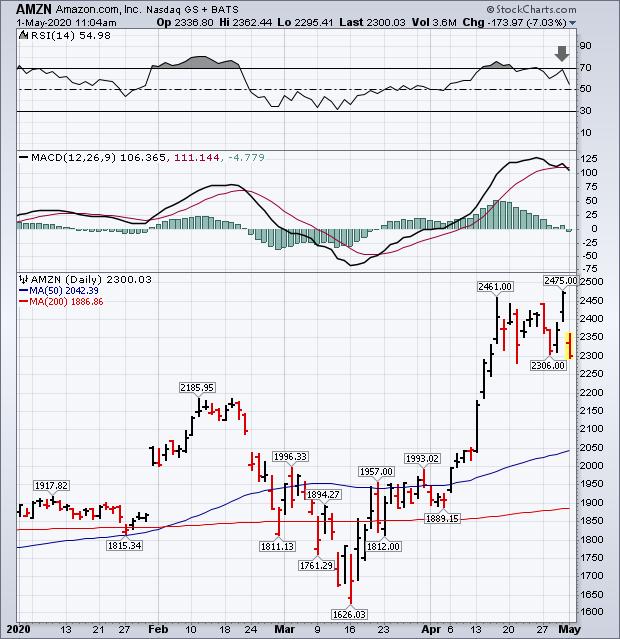
Stocks in general are undergoing some profit-taking today. And consumer cyclicals are one of the day's weakest groups. A big reason for that is today's big drop in Amazon.com (AMZN). Chart 1 shows that influential stock dropping -7% today on last evening's reported...
READ MORE
MEMBERS ONLY
AMAZON WEIGHS ON CONSUMER CYCLICALS -- LAM RESEARCH LEADS SEMIS LOWER -- EXCEPT FOR AMAZON, BIG TECH STOCKS ARE HAVING A RELATIVELY STRONG WEEK
by John Murphy,
Chief Technical Analyst, StockCharts.com
AMAZON SELLOFF HURTS CONSUMER CYCLICALS... Stocks in general are undergoing some profit-taking today. And consumer cyclicals are one of the day's weakest groups. A big reason for that is today's big drop in Amazon.com (AMZN). Chart 1 shows that influential stock dropping -7% today on...
READ MORE
MEMBERS ONLY
STOCKS CLIMB ON ENCOURAGING DRUG NEWS -- S&P 500 APPROACHES 200-DAY AVERAGE -- GOOGLE AND FACEBOOK LEAD XLC HIGHER -- XLY NEARS ITS 200-DAY LINE
by John Murphy,
Chief Technical Analyst, StockCharts.com
S&P 500 NEARS TEST OF 200-DAY AVERAGE...A positive report by Gilead Sciences on its Covid-19 drug helped stocks get off to a strong start today. The biotech stock is up 3% this morning on that report. Chart 1 shows the S&P 500 gaining more than...
READ MORE
MEMBERS ONLY
DOW AND S&P 500 CLEAR 50-DAY LINES -- SMALL CAPS HAVE A STRONG DAY -- FALLING VIX ALSO SUPPORTS HIGHER STOCK PRICES
by John Murphy,
Chief Technical Analyst, StockCharts.com
DOW AND S&P 500 CLEAR 50-DAY LINES...Stocks spent Monday extending the rebound that started two months ago. And they continue to overcome some overhead resistance barriers. Chart 1 shows the Dow Industrials trading back above its 50-average for the first time since February. While Chart 2 shows...
READ MORE
MEMBERS ONLY
STOCK REBOUND REMAINS INTACT --BUT LONGER-TERM TREND REMAINS IN DOUBT -- HEALTHCARE AND TECH ACCOUNT FOR THIRD OF SPX -- EQUAL-WEIGHT S&P 500 ETF LAGS BEHIND
by John Murphy,
Chief Technical Analyst, StockCharts.com
MAJOR STOCK INDEXES END WEEK SLIGHTLY LOWER...After an unusually volatile week which included a plunge in the price of oil below zero, major stock indexes ended the week with small losses. Which leaves their overall trend patterns little changed. Chart 1 shows the Dow Industrials ending the week just...
READ MORE
MEMBERS ONLY
GOLD MINERS FINALLY BREAK OUT TO THE UPSIDE -- GOLD MINERS ARE STARTING TO DO BETTER THAN GOLD -- AND THE STOCK MARKET
by John Murphy,
Chief Technical Analyst, StockCharts.com
GOLD MINERS ACHIEVE UPSIDE BREAKOUT... The price of gold continues to rise. Chart 1 shows the Gold Shares SPDR (GLD) trading higher and nearing another seven-year high. Gold miners, however, are doing even better. The daily bars in Chart 2 show the VanEck Vectors Gold Miners ETF (GDX) jumping more...
READ MORE
MEMBERS ONLY
STOCKS SELL OFF AS OIL PRICE PLUNGES -- DOW AND S&P 500 PULL BACK FROM 50-DAY AVERAGES -- THE NASDAQ FALLS BELOW ITS 200-DAY LINE ON TECHNOLOGY SELLING
by John Murphy,
Chief Technical Analyst, StockCharts.com
MAJOR STOCK INDEXES ARE UNDER HEAVY SELLING PRESSURE...The plunge in the price of the May crude oil contract below zero this week, and the continuing plunge in oil prices in general, is taking a toll on stock market sentiment and trading. All three major stock indexes are under heavy...
READ MORE