MEMBERS ONLY
NASDAQ IS FIRST INDEX TO CLEAR ITS 200-DAY LINE -- STRONG BIOTECH GROUP LEADS HEALTHCARE HIGHER-- AMAZON.COM LEADS CONSUMER CYCLICALS
by John Murphy,
Chief Technical Analyst, StockCharts.com
STOCKS EXTEND APRIL RALLY...Stocks ended the week on a strong note to extend their April rally. The daily bars in Chart 1 show the S&P 500 climbing 2.6% on Friday to close just above its 50-day average at 2863; and slightly above its late February broken...
READ MORE
MEMBERS ONLY
STOCKS OFF TO A STRONG START -- WITH ENERGY, FINANCIALS, INDUSTRIALS, AND MATERIALS LEADING IT HIGHER -- GOLD IS EXPERIENCING SOME PROFIT-TAKING
by John Murphy,
Chief Technical Analyst, StockCharts.com
STOCK INDEXES TEST SOME MOVING AVERAGE LINES... Today's strong price action suggests that stock indexes are trying to extend their April rebound. All major stocks got off to strong start. Chart 1 shows the Dow Industrials rising more than 2% today and nearing a test of its 50-day...
READ MORE
MEMBERS ONLY
STOCKS SELL OFF ON WEAK ECONOMIC NEWS -- BANKS DROP ON WEAK EARNINGS -- ENERGY AND FINANCIALS ARE DAY'S WEAKEST SECTORS
by John Murphy,
Chief Technical Analyst, StockCharts.com
WEAK ECONOMIC DATA CAUSES PROFIT-TAKING IN STOCKS... A lot of weak economic reports today are causing profit-taking in stock prices. Weak bank earnings are making that group one of the day's weakest. A 10 basis point drop by the 10-year Treasury yield to 0.64% may also be...
READ MORE
MEMBERS ONLY
GOLD REACHES HIGHEST LEVEL IN SEVEN YEARS -- WHILE ITS MINERS MAY ALSO BE BREAKING OUT -- GOLD MINERS ETF IS ALSO SHOWING RELATIVE STRENGTH AGAINST THE METAL AND STOCK MARKET
by John Murphy,
Chief Technical Analyst, StockCharts.com
GOLD REACHES SEVEN-YEAR HIGH... Gold seems to have everything moving in its favor. Low global interest rates, a softer dollar, and fears of global economic recession. And most of all, a bullish chart pattern both for the yellow metal and its miners. A lot of bullish articles on gold have...
READ MORE
MEMBERS ONLY
Weekly and Monthly Charts Show Improvement
by John Murphy,
Chief Technical Analyst, StockCharts.com
Stock prices are trading higher again today following a Fed injection of $2.3 trillion dollars into the economy. The question is how far can the rally carry, and are there still risks on the downside. For that, we're going to look at weekly and monthly charts to...
READ MORE
MEMBERS ONLY
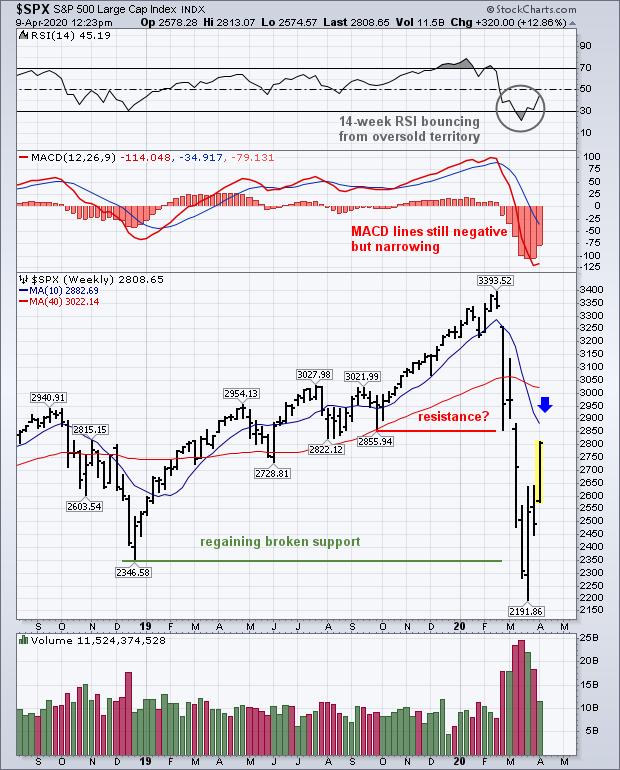
WEEKLY AND MONTHLY CHARTS SHOW IMPROVEMENT -- BUT IDENTIFY POTENTIAL OVERHEAD RESISTANCE -- THE STAYING POWER OF THE CURRENT STOCK REBOUND MAY SOON BE TESTED
by John Murphy,
Chief Technical Analyst, StockCharts.com
POTENTIAL OVERHEAD RESISTANCE ON WEEKLY CHART... Stock prices are trading higher again today following a Fed injection of $2.3 trillion dollars into the economy. The question is how far can the rally carry, and are there still risks on the downside. For that, we're going to look...
READ MORE
MEMBERS ONLY
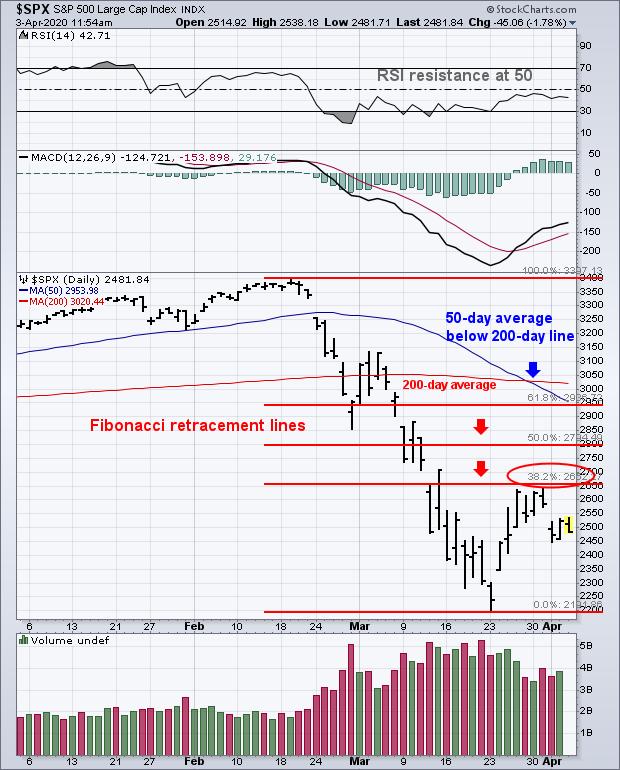
STOCKS GAIN MORE GROUND -- DOW AND S&P 500 MAY TEST 50% RETRACEMENT LINES -- THE QQQ IS TRYING AGAIN TO CLEAR ITS 200-DAY LINE -- ALL SECTORS ARE UP WITH REAL ESTATE, ENERGY, UTILITIES, MATERIALS, AND FINANCIALS LEADING
by John Murphy,
Chief Technical Analyst, StockCharts.com
STOCKS REGAIN UPSIDE MOMENTUM... Stocks are gaining ground today following yesterday's late selloff. Chart 1 shows the Dow Industrials gaining 3% today. Today's price gain has kept the Dow above its lower 38% Fibonnaci retracement line; and may be signalling a test of its 50% retracement...
READ MORE
MEMBERS ONLY
TECH SPDR FALLS BACK BELOW ITS 200-DAY AVERAGE -- SO DO THE QQQ AND SEMICONDUCTOR ISHARES -- LATE STOCK SELLING MIGHT SIGNAL MORE TO COME
by John Murphy,
Chief Technical Analyst, StockCharts.com
NASDAQ 100 QQQ CLOSES BELOW 200-DAY LINE...Today's two earlier messages focused on three technology-dominated ETFs that were trying to clear their 200-day averages. All three failed that initial test by closing lower today. Chart 1 shows the Invesco QQQ Trust giving up its earlier gains and ending...
READ MORE
MEMBERS ONLY
NASDAQ 100 QQQ TRADING ABOVE ITS 200-DAY LINE -- AMAZON, INTEL, AND MICROSOFT HELP LEAD IT HIGHER
by John Murphy,
Chief Technical Analyst, StockCharts.com
QQQ TRADES ABOVE 200-DAY LINE...This morning's message showed the Technology SPDR (XLK) and Semiconductor iShares (SOXX) testing their 200-day moving averages. This message focuses on the Nasdaq 100 QQQ which is also trying to clear its 200-day line. Chart 1 shows the Invesco QQQ Trust trading above...
READ MORE
MEMBERS ONLY
MAJOR STOCK INDEXES CLEAR LATE-MARCH HIGH -- ALL SECTORS ARE IN THE GREEN -- ENERGY AND MATERIALS ARE LEADING -- TECH SPDR IS TESTING ITS 200-DAY AVERAGE -- SO ARE SEMICONDUCTORS
by John Murphy,
Chief Technical Analyst, StockCharts.com
STOCK INDEXES CLEAR LATE-MARCH HIGH...The stock market is building on yesterday's strong gain to improve its short- to intermediate trend picture. The daily bars in Chart 1 show the S&P 500 rising above its late-March intra-day peak at 2641 after clearing its green 20-day average...
READ MORE
MEMBERS ONLY
STOCKS START WEEK ON THE UPSIDE -- ALL STOCK SECTORS ARE GAINING -- BIOTECHS LEAD HEALTHCARE HIGHER -- TREASURY YIELD BOUNCES AS TREASURIES DIP -- CORPORATE BONDS ARE ACTING BETTER
by John Murphy,
Chief Technical Analyst, StockCharts.com
S&P 500 MAY BE HEADED FOR TEST OF LATE-MARCH HIGH...Global stocks are starting the week higher. The daily bars in Chart 1, for example, show the S&P 500 gapping higher this morning and clearing its green 2o-day average. The green circle shows the SPX leaving...
READ MORE
MEMBERS ONLY
Major Stock Indexes are Trying to Stabilize
by John Murphy,
Chief Technical Analyst, StockCharts.com
Major U.S. stock indexes continue to probe for a short-term bottom. The daily bars in Chart 1 show the S&P 500 regaining some lost ground over the last two weeks after falling to the lowest level in three years. But there's still a lot of...
READ MORE
MEMBERS ONLY
MAJOR STOCK INDEXES ARE TRYING TO STABILIZE -- LONG-TERM CHARTS, HOWEVER, REMAIN A CONCERN -- WEEKLY AND MONTHY CHARTS OF THE S&P 500 SUGGEST CONTINUED STOCK MARKET RISK
by John Murphy,
Chief Technical Analyst, StockCharts.com
DAILY S&P 500 CHART CONTINUES TO STABILIZE...Major U.S. stock indexes continue to probe for a short-term bottom. The daily bars in Chart 1 show the S&P 500 regaining some lost ground over the last two weeks after falling to the lowest level in three...
READ MORE
MEMBERS ONLY
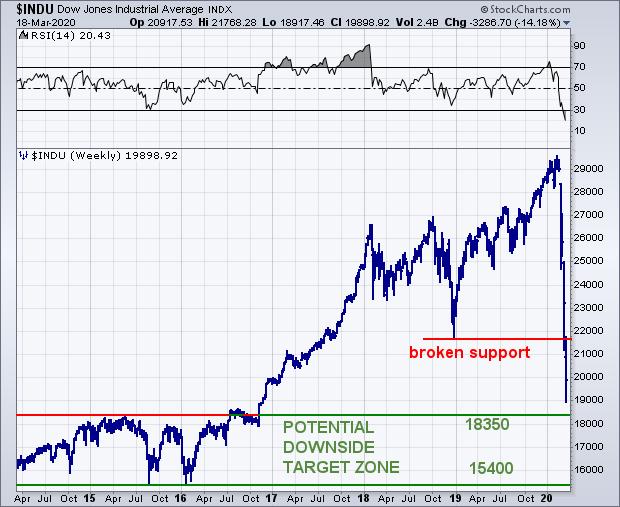
Dow Breaks 2018 Low and Signals Lower Prices
by John Murphy,
Chief Technical Analyst, StockCharts.com
My weekend message showed the Dow Industrials testing important chart support along its late 2018 low. The weekly bars in Chart 1 show the Dow falling below that important support line this week. That raises the likelihood of even lower prices. The question is how low. The best way to...
READ MORE
MEMBERS ONLY
DOW BREAKS 2018 LOW AND SIGNALS LOWER PRICES -- THE S&P 500 IS TESTING SUPPORT LINES
by John Murphy,
Chief Technical Analyst, StockCharts.com
LOWER TARGET FOR THE DOW... My weekend message showed the Dow Industrials testing important chart support along its late 2018 low. The weekly bars in Chart 1 show the Dow falling below that important support line this week. That raises the likelihood of even lower prices. The question is how...
READ MORE
MEMBERS ONLY
THE DOW TESTS MAJOR LONG-TERM SUPPORT LINES -- BUT ANY REBOUND COULD MEET WITH NEW SELLING -- A BEAR MARKET HAS LIKELY BEGUN -- THE QUESTION IS HOW LONG AND HOW DEEP
by John Murphy,
Chief Technical Analyst, StockCharts.com
DOW DROPS INTO BEAR TERRITORY... Friday's strong rebound helped prevent a very bad week in stocks from getting worse. And it came at a good time. That's because of number of U.S. stock indexes are nearing tests of major long-term support lines. We'll...
READ MORE
MEMBERS ONLY
GLOBAL STOCKS ENTER BEAR MARKET -- FOREIGN STOCKS BREAK LONG-TERM SUPPORT LEVELS -- S&P 500 HEADING TOWARD SOME TESTS OF ITS OWN
by John Murphy,
Chief Technical Analyst, StockCharts.com
WORLD STOCK INDEX NEARS TEST OF LONG-TERM SUPPORT...The Dow Industrials entered a bear market yesterday when it closed more than -20% off its recent high. Another big global selloff today has put the world's stocks in a bear market as well. Which suggests that stocks in the...
READ MORE
MEMBERS ONLY
RETEST OF RECENT LOWS TAKING PLACE -- FRIDAY'S LATE REBOUND IS MILDLY ENCOURAGING -- BUT MONTHLY INDICATORS WARN OF POSSIBLE TOP
by John Murphy,
Chief Technical Analyst, StockCharts.com
NASDAQ HOLDS 200-DAY LINE... Let's start with some good news. Heading into the close yesterday afternoon (Friday), stocks were under heavy selling pressure. And the Nasdaq Composite Index was in danger of closing below its 200-day moving average for the first time since last spring. A late stock...
READ MORE
MEMBERS ONLY
Stock Indexes Headed for Retest of Recent Low
by John Murphy,
Chief Technical Analyst, StockCharts.com
Another day of heavy selling has marked the end of this week's rebound, and a likely retest of last week's lows. Another plunge in bond yields to record lows and a 10% plunge in the price of oil are just two factors contributing to the stock...
READ MORE
MEMBERS ONLY
STOCK INDEXES HEADED FOR RETEST OF RECENT LOW -- NASDAQ THREATENING ITS 200-DAY AVERAGE
by John Murphy,
Chief Technical Analyst, StockCharts.com
RETEST OF LAST WEEK'S LOWS APPEARS LIKELY... Another day of heavy selling has marked the end of this week's rebound, and a likely retest of last week's lows. Another plunge in bond yields to record lows and a 10% plunge in the price of...
READ MORE
MEMBERS ONLY
FALLING BOND YIELDS PUSH BANK INDEX TO NEW LOW -- AIRLINE INDEX FALLS TO THREE YEAR LOW -- CRUISE, GAMBLING, AND HOTELS CONTINUE TO SLIDE -- TODAY'S STOCK SELLING THREATENS REBOUND
by John Murphy,
Chief Technical Analyst, StockCharts.com
BANKS AND AIRLINES HIT NEW LOWS... Another record low in bond yields and a continuing flight to the safety of bonds (and gold) are helping put stock prices under heavy selling pressure today. The biggest sector losers are financials, energy, industrials, and cyclicals. It's not hard to understand...
READ MORE
MEMBERS ONLY
SHORT-TERM STOCK REBOUND CONTINUES -- S&P 500 REGAINS 200-DAY LINE -- UPSIDE RESISTANCE LEVELS TO WATCH -- VIX FALLS BACK BELOW 40 -- TREASURY BOND ISHARES LOOK OVERBOUGHT
by John Murphy,
Chief Technical Analyst, StockCharts.com
SHORT-TERM STOCK REBOUND CONTINUES... Extremely oversold readings on daily charts at the end of last week, combined with chart support near the October low, increased odds for a rebound in stocks this week. Stocks are rebounding today after yesterday's selloff. And are building on gains that started on...
READ MORE
MEMBERS ONLY
DAILY OVERSOLD READINGS COULD SUPPORT REBOUND -- BUT WEEKLY RSI NOT YET OVERSOLD -- NEITHER IS THE % SPX STOCKS BELOW 200-DAY LINE -- VIX INDEX REACHES POTENTIAL RESISTANCE AT 40
by John Murphy,
Chief Technical Analyst, StockCharts.com
VERY OVERSOLD BUT NO REBOUND YET... After this week's stock plunge, it's not surprising to see short-term momentum and sentiment indicators reach very oversold conditions. That doesn't guarantee a short-term bottom; but does increase the technical odds for one. And even if one does...
READ MORE
MEMBERS ONLY
VIX CLOSES AT HIGHEST LEVEL IN TWO YEARS -- S&P 500 FALLS BELOW ITS 200-DAY AVERAGE --- FIVE MORE SECTORS FELL BELOW THEIR 200-DAY LINES -- THAT PUTS EIGHT SECTORS IN DOWNTRENDS
by John Murphy,
Chief Technical Analyst, StockCharts.com
VIX CLOSES AT HIGHEST LEVEL IN TWO YEARS... Stocks sold off hard again today with more 200-day moving averages being broken. The inability of stock indexes to offer any buying near those long-term support lines is a very discouraging sign. So was today's large jump in the CBOE...
READ MORE
MEMBERS ONLY
NO SIGN OF A BOTTOM YET AS EARLY BOUNCE FADES -- SELLOFF IN TRANSPORTS AND SMALL CAPS DEEPENS -- TWO SECTOR SPDRS THREATEN 200-DAY AVERAGES -- WHILE ANOTHER ONE SLIPPED BELOW ITS RED LINE -- SPX MAY BE HEADED TOWARD ITS 200-DAY LINE
by John Murphy,
Chief Technical Analyst, StockCharts.com
S&P 500 APPEARS HEADED TOWARD 200-DAY AVERAGE... An early rebound attempt faded today and the Dow and S&P 500 ended the day lower. Only the Nasdaq managed to hold onto a small gain. The Dow Industrials closed below their 200-day average for the second day in...
READ MORE
MEMBERS ONLY
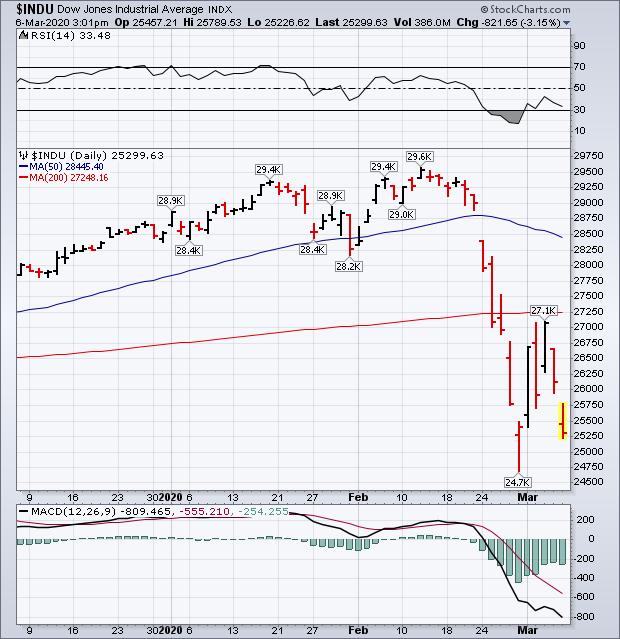
STOCK CORRECTION DEEPENS -- NASDAQ AND S&P 500 BREAK JANUARY LOWS -- DOW FALLS BELOW 200-DAY LINE -- SO DO BANKS, MATERIALS, SMALL CAPS, AND TRANSPORTS -- 10-YEAR TREASURY FALLS TO RECORD LOW
by John Murphy,
Chief Technical Analyst, StockCharts.com
MARKET ROUT CONTINUES... Stocks tumbled for the second day in a row and in heavy trading once again. And important support levels are being broken. The S&P 500 and Nasdaq fell below their January lows today and further below their 50-day averages in pretty decisive fashion. Charts 1...
READ MORE
MEMBERS ONLY
GLOBAL STOCKS TUMBLE ON CORONAVIRUS SPREAD -- 10-YEAR YIELD FALLS TO NEARLY FOUR-YEAR LOW -- ENERGY, TECH, AND CYCLICALS LEAD THE DECLINE -- SOME SUPPORT LEVELS HAVE BEEN BROKEN -- VIX SURGES TO HIGHEST LEVEL IN A YEAR
by John Murphy,
Chief Technical Analyst, StockCharts.com
GLOBAL STOCKS PLUNGE ON CORONAVIRUS SPREAD... Recent technical warnings that global stocks were vulnerable to more selling became a harsh reality today. And in a big way. Global stocks fell the most in nearly a year. Selling started in Asia and Europe before spreading to the states. And a lot...
READ MORE
MEMBERS ONLY
GLOBAL STOCK INDEXES LOOK VULNERABLE -- THAT INCLUDES AN OVERBOUGHT S&P 500 -- EAFE ISHARES BACKING OFF FROM 2018 HIGH -- EMERGING MARKETS LOOKING THE WEAKEST -- % S&P 500 STOCKS ABOVE 50-DAY AVERAGE WEAKENS
by John Murphy,
Chief Technical Analyst, StockCharts.com
GLOBAL STOCKS LOOK OVER-EXTENDED AND VULNERABLE... A number of recent messages have shown charts suggesting that the U.S. stock market looks overbought on the upside and vulnerable to some profit-taking. Not necessarily a major top, but a correction of some sort. Foreign stocks look even more vulnerable. And what...
READ MORE
MEMBERS ONLY
Friday's Selling Suggests that Overbought Stock Pullback has Probably Begun
by John Murphy,
Chief Technical Analyst, StockCharts.com
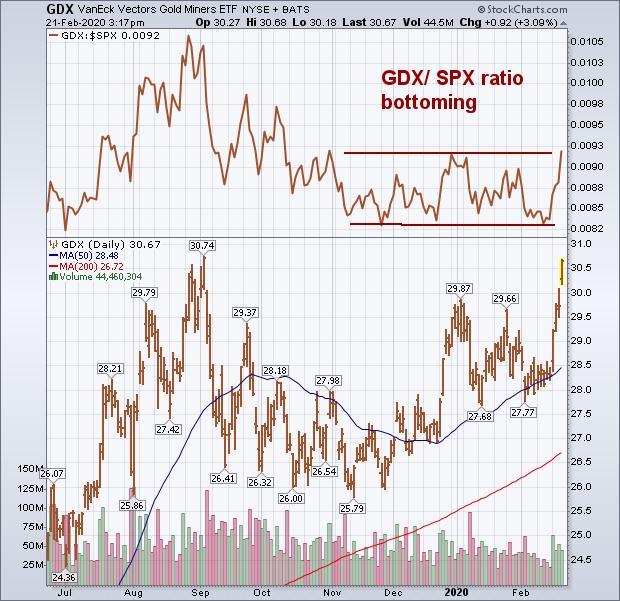
With gold surging again today to another seven-year high, gold miners are having an even stronger day percentage-wise. And are nearing a major upside breakout. Chart 1 shows the VanEck Gold Miners ETF (GDX) trading 3% higher today and nearing a challenge of its early September peak. A close above...
READ MORE
MEMBERS ONLY
GOLD MINERS ETF NEARS UPSIDE BREAKOUT -- SEMICONDUCTERS LEAD TECH SECTOR LOWER -- FRIDAY'S SELLING SUGGESTS THAT OVERBOUGHT STOCK PULLBACK HAS PROBABY BEGUN
by John Murphy,
Chief Technical Analyst, StockCharts.com
GOLD MINERS ETF NEARS UPSIDE BREAKOUT... With gold surging again today to another seven-year high, gold miners are having an even stronger day percentage-wise. And are nearing a major upside breakout. Chart 1 shows the VanEck Gold Miners ETF (GDX) trading 3% higher today and nearing a challenge of its...
READ MORE
MEMBERS ONLY
DOLLAR SURGES TO NEARLY THREE-YEAR HIGH -- PLUNGING YEN HURTS JAPAN ISHARES -- WEAK EM CURRENCIES HURT EEM ISHARES --U.S. STOCKS LOOK VULNERABLE TO SOME PROFIT-TAKING
by John Murphy,
Chief Technical Analyst, StockCharts.com
U.S. DOLLAR INDEX BREAKS OUT TO THE UPSIDE... The strong rally that started in the dollar in January passed another technical milestone this week. The daily bars in Chart 1 show the U.S. Dollar Index rising above its September/October peaks in yesterday's trading to reach...
READ MORE
MEMBERS ONLY
GOLD REACHES SEVEN-YEAR HIGH -- GOLD MINERS ARE ALSO TURNING UP -- NEWMONT GOLDCORP EXCEEDS 2016 HIGH -- BARRICK GOLD REACHES FOUR-YEAR HIGH
by John Murphy,
Chief Technical Analyst, StockCharts.com
GOLD RESUMES UPTREND... My weekend message explained why falling bond yields, and an over-extended stock market, might be two of the reasons that investors have been buying gold since the start of the year. And they're doing so in the face of a rising dollar. The message also...
READ MORE
MEMBERS ONLY
FALLING BOND YIELDS HAVE BEEN GIVING A BIG BOOST TO THE PRICE OF GOLD -- AND HELPED OFFSET IMPACT OF RISING DOLLAR
by John Murphy,
Chief Technical Analyst, StockCharts.com
RELATIONSHIP BETWEEN GOLD AND THE DOLLAR... Last weekend's message explained that one of the side-effects of a rising U.S dollar is weaker commodity prices. And that's been the case so far this year as a four-month high in the U.S. Dollar Index has pushed...
READ MORE
MEMBERS ONLY
LOWER YIELDS PUSH REITS AND UTILITIES TO RECORDS -- BANK SPDR MEETS SELLING AT 50-DAY LINE -- S&P 500 STILL LOOKS OVEREXTENDED -- WITH A SHORT-TERM NEGATIVE DIVERGENCE
by John Murphy,
Chief Technical Analyst, StockCharts.com
10-YEAR TREASURY YIELD CONTINUES TO WEAKEN... Treasury yields are down again today, and are losing some of the gains made over the last two weeks. The daily bars in Chart 1 show the 10-Year Treasury Yield losing 3 basis points today to 1.58%. The pennant-like shape of its sideways...
READ MORE
MEMBERS ONLY
BUYING OF GAMBLING, HOTELS, AND CRUISE LINES IS A SIGN THAT CORONAVIRUS THREAT MAY BE PASSING -- AMERICAN AIRLINES LEADS AIRLINES HIGHER
by John Murphy,
Chief Technical Analyst, StockCharts.com
MARKETS LOOKING BEYOND CORONAVIRUS THREAT... Price action of the global financial markets over the past week strongly suggest that fears of the coronavirus are fading.Major U.S. stock indexes are trading at new records. Foreign stocks are being led higher by Asian emerging markets, with help from China. Crude...
READ MORE
MEMBERS ONLY
DOLLAR INDEX HAS A STRONG WEEK AS EURO FALLS -- GLOBAL INVESTORS ARE FAVORING U.S. ASSETS -- STRONGER $ WEAKENS COMMODITIES -- AND FOREIGN STOCK ETFS
by John Murphy,
Chief Technical Analyst, StockCharts.com
US DOLLAR INDEX TURNS UP... My Thursday message showed the Invesco US Dollar Index ETF (UUP) hitting a four month high and challenging its previous peak formed during October. It cleared that barrier on Friday. Chart 1, however, plots the US Dollar Index ($USD) which I prefer using to track...
READ MORE
MEMBERS ONLY
Travel Stocks Under Pressure Again
by John Murphy,
Chief Technical Analyst, StockCharts.com
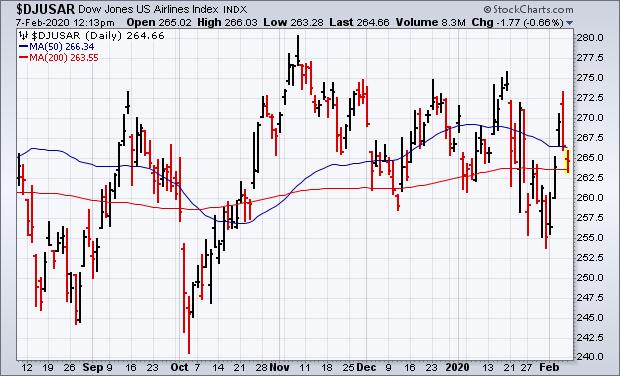
My Tuesday message showed a number of travel and tourism stock groups with heavy exposure to China finding support near moving average lines; or regaining them. Today's message shows those same groups under pressure again today. Let's start with airlines. Chart 1 shows the Dow Jones...
READ MORE
MEMBERS ONLY
TRAVEL STOCKS UNDER PRESSURE AGAIN -- AIRLINES, GAMBLING STOCKS, AND CRUISE LINERS RETEST MOVING AVERAGE LINES -- PLAYING SOME DEFENSE GOING INTO WEEKEND
by John Murphy,
Chief Technical Analyst, StockCharts.com
TRAVEL STOCKS UNDER PRESSURE... My Tuesday message showed a number of travel and tourism stock groups with heavy exposure to China finding support near moving average lines; or regaining them. Today's message shows those same groups under pressure again today. Let's start with airlines. Chart 1...
READ MORE
MEMBERS ONLY
DOLLAR RALLIES TO A FOUR MONTH HIGH -- MOST MAJOR CURRENCIES ARE DROPPING -- THE EURO IS THREATENING CHART SUPPORT -- A STRONGER DOLLAR COULD SIGNAL GLOBAL INVESTORS ROTATING BACK INTO U.S. MARKETS -- BUT COULD BE NEGATIVE FOR COMMODITY PRICES
by John Murphy,
Chief Technical Analyst, StockCharts.com
DOLLAR INDEX NEARS TEST OF EARLY OCTOBER HIGH...While recent volatility in stocks, commodities, and bonds has received a lot of attention, currency trading has been relatively quiet. But that may be changing. Chart 1 shows the Invesco US Dollar Index (UUP) climbing this week to the highest level in...
READ MORE
MEMBERS ONLY
BIG JUMP IN ASIA BOOSTS GLOBAL STOCKS -- AIRLINES, CRUISE LINES, HOTELS, AND GAMING STOCKS ARE REGAINING MOVING AVERAGE SUPPORT -- COPPER STOCKS ARE ALSO FINDING SUPPORT -- DOW REGAINS ITS 50-DAY AVERAGE
by John Murphy,
Chief Technical Analyst, StockCharts.com
EMERGING ASIA LEADS GLOBAL STOCKS HIGHER...A strong rebound in Asia today is giving a big boost to global stocks. Emerging markets in Asia led the rest of the world lower over the last two weeks. And are leading it higher today. Chart 1 shows the MSCI Asia ex Japan...
READ MORE