MEMBERS ONLY
NASDAQ CORRECTING FROM RESISTANCE BARRIER -- BOLLINGER BANDS CONTRACT
by John Murphy,
Chief Technical Analyst, StockCharts.com
NASDAQ PULLS BACK FROM 2100 ... One of the reasons that the market rally remains stalled has to do with the inability of the Nasdaq Composite to get through its February/March highs at 2100. With the Nasdaq having moved into a short-term overbought condition, that was a logical spot to...
READ MORE
MEMBERS ONLY
DIVIDEND PAYING ETF DOES BETTER WHEN BOND YIELDS ARE FALLING
by John Murphy,
Chief Technical Analyst, StockCharts.com
SELECT DIVIDEND ETF IS DOING RELATIVELY WELL... Earlier in the year I wrote that one of the places that I thought would do well this year were large-cap dividend paying stocks. That was based partially on my general negative view of the stock market. Large-cap dividend stocks provide a market...
READ MORE
MEMBERS ONLY
ENERGY STOCKS GAIN -- TRANPORTS FALL
by John Murphy,
Chief Technical Analyst, StockCharts.com
DROP IN INVENTORIES BOOSTS OIL BY A DOLLAR ... A big drop in oil inventories reported today is pushing crude oil nearly a dollar higher today. Crude has been consolidating over the last week within its recent uptrend. It still looks like like crude is going to test its March high...
READ MORE
MEMBERS ONLY
NYSE BULLISH PERCENT INDEX TURNS UP
by John Murphy,
Chief Technical Analyst, StockCharts.com
BPI BOUNCES OFF SUPPORT ... On May 25, I wrote a message about the NYSE Bullish Percent Index bouncing off support near 50, which kept the cyclical bull market intact (May 25, 2005). Chart 1 is an updated version of the chart in that earlier piece. To refresh your memory, the...
READ MORE
MEMBERS ONLY
LOWER BOND YIELDS BOOST MARKET -- RATE- SENSITIVE STOCKS GAIN THE MOST -- MID-CAP INDEX CHALLENGES 2005 HIGH
by John Murphy,
Chief Technical Analyst, StockCharts.com
BOND YIELDS RESUME DECLINE ... Last week the yields on the 10-year T-note fell below 4% to the lowest level in a year. That gave a boost to the stock market and especially to stocks tied to interest rates. After bouncing back to the 4% level on Monday, yields are falling...
READ MORE
MEMBERS ONLY
GOLD MAY BE DRAWING STRENGTH FROM THE YEN WHICH MAY BE REPLACING THE EURO AS THE DOMINANT FOREIGN CURRENCY
by John Murphy,
Chief Technical Analyst, StockCharts.com
GOLD IS ATTRACTING NEW ATTENTION... Over the last week I've shown the Gold & Silver (XAU) Index starting to bounce from potential chart support at its spring 2004 low, and the price of bullion bouncing off its February 2005 low. Last Friday I suggested it might be a...
READ MORE
MEMBERS ONLY
RISING OIL MAY BE STARTING TO WORRY THE MARKET -- FALLING BOND YIELDS MAY BE THE REASON WHY GOLD AND GOLD STOCKS ARE BOUNCING OFF SUPPORT LEVELS
by John Murphy,
Chief Technical Analyst, StockCharts.com
OIL ISN'T DEAD YET ... A lot of recent optimism on the stock market and the economy has been predicated on the view that the historic rise in oil prices has probably ended. A lot of economists have also declared the major bull market in commodities over. Both of...
READ MORE
MEMBERS ONLY
OIL SURGES 5% TO BOOST ENERGY SECTOR -- PLUNGING BOND YIELDS SUPPORT MARKET RALLY LED BY RATE-SENSITIVE SHARES -- NASDAQ INDEXES REACH INITIAL TARGETS
by John Murphy,
Chief Technical Analyst, StockCharts.com
CRUDE OIL SURGES 5% ... After surviving a recent test of its 200-day moving average, crude oil surged $2.63 (5%) today. That puts the key commodity back over its 50-day average, its early May high, and breaks a two-month down trendline. That strong price action puts crude in position to...
READ MORE
MEMBERS ONLY
MAY DATA PUSHES BOND YIELDS BELOW 4% AND SPARKS BOND AND STOCK BUYING
by John Murphy,
Chief Technical Analyst, StockCharts.com
PLUNGE IN PRICE DATA PUSHES YIELDS LOWER... This morning's report that prices paid by manufacturers during May saw the biggest drop since the early 1970's helped push bond yields well below 4% and to the lowest level in a year. Chart 1 shows the 10-year T-note...
READ MORE
MEMBERS ONLY
EURO PLUNGES TO SEVEN-MONTH LOW -- GOLD AND OIL RECOVER MOST OF EARLY LOSSES -- OVERBOUGHT MARKET PULLS BACK
by John Murphy,
Chief Technical Analyst, StockCharts.com
EURO FALLS ON FRENCH VOTE... The Euro tumbled to the lowest level in seven months after the French voted against the European constitution over the weekend. Needless to say, that gave the dollar a big boost, but pushed gold prices lower. By day's end, however, gold regained some...
READ MORE
MEMBERS ONLY
NASDAQ APPROACHES NEXT TARGET AT 2100 -- LIGHT VOLUME IS A CONCERN -- UPTURN IN ENERGY PATCH MAY CAUSE SOME SHORT-TERM PROFIT-TAKING NEXT WEEK
by John Murphy,
Chief Technical Analyst, StockCharts.com
LACK OF VOLUME IS A CONCERN ... The last time I showed the Nasdaq Composite market I wrote that it's next upside target was its spring high at 2100. Friday's close put it very close to that initial upside target. It's daily oscillators also show...
READ MORE
MEMBERS ONLY
SEMICONDUCTOR HOLDERS PULLED HIGHER BY INTEL AND TEXAS INSTRUMENTS
by John Murphy,
Chief Technical Analyst, StockCharts.com
SEMICONDUCTOR HOLDERS NEAR 2005 HIGH ... As a follow-up to my earlier message on the improving performance by the semiconductor group, I'm going to focus this report on the Semiconductor Holders and a couple of big stocks pulling it higher. Chart 1 shows the Semiconductor Holders (SMH) trading within...
READ MORE
MEMBERS ONLY
SEMICONDUCTORS CONTINUE TO SHOW NEW LEADERSHIP -- WHY THAT'S GOOD FOR THE REST OF THE MARKET
by John Murphy,
Chief Technical Analyst, StockCharts.com
THE SOX IS NEARING TEST OF MAJOR RESISTANCE ... On May 16 I wrote about new signs of leadership coming from the semiconductor group. That was predicated on the move by the SOX Index back over its moving average lines and, more importantly, an upturn in its relative strength line. That...
READ MORE
MEMBERS ONLY
NYSE BULLISH PERCENT INDEX IS HOLDING AT SUPPORT, BUT HASN'T BOUNCED MUCH
by John Murphy,
Chief Technical Analyst, StockCharts.com
THE NYSE BULLISH PERCENT INDEX... I've written about using the Bullish Percent Indexes with point & figure charts. As useful as that is, you can also produce line charts on the various Bullish Percent Indexes. And they can yield some interesting market information. Chart 1 shows the NYSE...
READ MORE
MEMBERS ONLY
LONG-TERM RATES ARE TESTING 4.00% LEVEL -- HOLDERS OF REITS AND HOUSING STOCKS MIGHT WANT TO PAY CLOSE ATTENTION
by John Murphy,
Chief Technical Analyst, StockCharts.com
10-YEAR T-NOTE TESTS FEBRUARY LOW ... After spiking higher from mid-February to mid-March, long-term rates have been dropping. No one is sure exactly why they've been dropping, but they have. Chart 1 shows, however, that the yield on the 10-year T-note (TNX) has reached an important chart point. The...
READ MORE
MEMBERS ONLY
OIL CLIMBS BACK OVER $51 -- OIL SERVICE LEADS ENERGY SECTOR HIGHER
by John Murphy,
Chief Technical Analyst, StockCharts.com
CRUDE OIL BOUNCES OFF 200-DAY AVERAGE... Today's $1.58 gain in crude oil pushes it more than a dollar over the psychological $50 level and may represent a successful test of its 200-day moving average. That's giving a boost to energy stocks which have also been...
READ MORE
MEMBERS ONLY
A LOOK AT BOLLINGER BANDS IN THREE DIFFERENT TIME DIMENSIONS
by John Murphy,
Chief Technical Analyst, StockCharts.com
A TRIBUTE TO JOHN BOLLINGER ... In honor of John Bollinger's having received the MTA Annual Award this past weekend, I thought it an appropriate time to write about his greatest invention which are aptly called Bollinger bands. Chart 1 shows the bands applied to a daily chart of...
READ MORE
MEMBERS ONLY
THOUGHTS AND IMPRESSIONS FROM THE MARKET TECHNICIANS WEEKEND MEETING -- JOHN BOLLINGER GETS MTA AWARD
by John Murphy,
Chief Technical Analyst, StockCharts.com
WHAT TOP TECHNICIANS ARE THINKING ... The Market Technicians Associations annual seminar held this past weekend in New York gave me a great opportunity to get a glimpse of what some of the top technical analysts are thinking right now. I was relieved that they were also a little puzzled by...
READ MORE
MEMBERS ONLY
GOLD AND OIL STOCKS ARE TESTING MAJOR SUPPORT LEVELS -- THEIR RECENT WEAKNESS HAS BEEN DUE TO A RISING DOLLAR AND HAS HELPED STOCKS RALLY
by John Murphy,
Chief Technical Analyst, StockCharts.com
OIL SERVICE INDEX TESTING 200-DAY AVERAGE... Oil service stocks, which have corrected downward with the price of crude oil, continue to test important chart support. Chart 1 shows the OSX trying to bounce off its 200-day moving average. The Commodity Channel (CCI) Index shows that the OSX is in oversold...
READ MORE
MEMBERS ONLY
SECTOR ROTATIONS INDICATE A COMPRESSED CYCLE -- WHY SECTOR ROTATIONS HAVE TURNED POSITIVE -- MARKET INDEXES NOW JUSTIFY NEW LONGS
by John Murphy,
Chief Technical Analyst, StockCharts.com
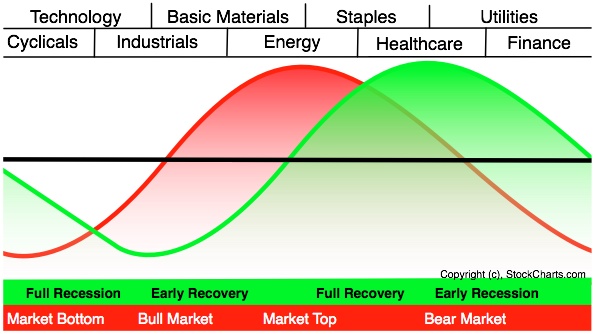
SECTOR ROTATION MODEL... The diagram in chart 1 shows the sector rotations that normally occur at different stages of a market (red line) and business cycle (green line). When we talk about a business cycle, we're normally talking about the traditional four-year cycle. That means that these shifts...
READ MORE
MEMBERS ONLY
MARKET TAKES TURN FOR THE BETTER -- FINANCIALS, RETAILERS, AND TECHS LEAD MARKET HIGHER -- MAJOR INDEXES EXCEED MOVING AVERAGES
by John Murphy,
Chief Technical Analyst, StockCharts.com
SECTOR ROTATIONS TURN POSITIVE ... Over the last couple of days, I've been writing about sector rotations that normally take place in a market upturn that's often accompanied by falling energy prices. Earlier in the week I wrote about how semiconductors were leading the technology-dominated Nasdaq market...
READ MORE
MEMBERS ONLY
CRUDE OIL TESTS 200-DAY AVERAGE -- ENERGY STOCKS ARE ALSO TESTING LONG-TERM SUPPORT LINES
by John Murphy,
Chief Technical Analyst, StockCharts.com
CRUDE IS STILL TESTING 200-DAY AVERAGE ... The last time I showed the chart of crude oil, it was testing major support at its 200-day moving average. That's still the case. Chart 1 (plotted through Monday) shows that crude is also testing the low hit in early May. Needless...
READ MORE
MEMBERS ONLY
WHY TECHNOLOGY LEADERSHIP IS IMPORTANT -- MORE ON SECTOR ROTATONS AT DIFFERENT STAGES OF THE BUSINESS CYCLE
by John Murphy,
Chief Technical Analyst, StockCharts.com
WHY TECHNOLOGY LEADERSHIP IS IMPORTANT... I wrote yesterday about the technology-dominated Nasdaq market starting to show better relative strength than the S&P 500. I've also written many times that upside technology leadership is a vital ingredient in any serious stock market rally. I'll try...
READ MORE
MEMBERS ONLY
MONEY IS ROTATING OUT OF BASIC MATERIALS AND ENERGY INTO SEMICONDUCTORS
by John Murphy,
Chief Technical Analyst, StockCharts.com
MATERIALS AND ENERGY ARE WEEK'S WORST ... There appears to be some group rotations going on in the market that's been sparked by the recent drop in commodity-related groups like basic materials and energy. Gold stocks have also fallen sharply. In fact, those were last week'...
READ MORE
MEMBERS ONLY
UTILITIES LOSE SAVE HAVEN STATUS -- DOW COMPOSITE INDEX BREAKS 200-DAY LINE
by John Murphy,
Chief Technical Analyst, StockCharts.com
UTILITY PLUNGE ENDS SAFE HAVEN STATUS ... With the market apparently starting another downleg, even the safe haven status of utilities appears to have ended. Chart 1 shows why. The Dow Utilities plunged over 13 points earlier today to shatter their 50-day moving average. That puts all three Dow averages in...
READ MORE
MEMBERS ONLY
RECENT DOWNTURN SUGGESTS BEAR MARKET BOUNCE MAY HAVE ENDED -- NYSE RETESTING 200-DAY AVERAGE
by John Murphy,
Chief Technical Analyst, StockCharts.com
DOW AND RUSSELL 2000 STILL BELOW 200-DAY LINES ... Despite the recent market bounce (which may be ending), the market still has major bearish bias. Charts 1 and 2 show the Dow Industrials (Chart 1) and the Russell 2000 Small Cap Index (Chart 2) unable to exceed their January lows and...
READ MORE
MEMBERS ONLY
WHY A RISING DOLLAR ISN'T GOOD FOR COMMODITIES AND STOCKS AND MAY MEAN A WEAKER GLOBAL ECONOMY
by John Murphy,
Chief Technical Analyst, StockCharts.com
DOLLAR INDEX ACHIEVES BULLISH BREAKOUT ... The US Dollar Index broke out on Thursday to a new 2005 high. It also broke through its 200-day moving average. I discussed a more positive outlook for the dollar's intermediate-term trend on Wednesday and some ripple effects an upside breakout would have...
READ MORE
MEMBERS ONLY
MARCH TRADE DEFICIT NARROWS AS DOLLAR TESTS TOP OF 2005 TRADING RANGE -- WHY AN UPSIDE BREAKOUT WOULDN'T BE GOOD FOR STOCKS OR COMMODITIES
by John Murphy,
Chief Technical Analyst, StockCharts.com
FOREIGN CURRENCIES FALL... The U.S. trade deficit for March was much narrower than expected. That's giving a boost to the U.S. dollar and is pushing foreign currencies lower. Charts 1 and 2 show the Canadian Dollar and the Euro in danger of falling below their 200-day...
READ MORE
MEMBERS ONLY
MAKING A BULLISH CASE FOR HEALTHCARE -- BIOTECHS ARE FINALLY TURNING HIGHER
by John Murphy,
Chief Technical Analyst, StockCharts.com
HEALTHCARE IS TOP APRIL GAINER ... Last Monday I wrote about healthcare being the top sector gainer for the month of April (May 02, 2005). I've also written several bullish articles on the revival of this group over the last couple of months. I believe that healthcare is the...
READ MORE
MEMBERS ONLY
ANOTHER LOOK AT BULLISH PERCENTAGE READINGS -- DOW AND S&P TEST MAJOR SUPPORT -- NASDAQ IN DOWNTREND
by John Murphy,
Chief Technical Analyst, StockCharts.com
FIRST A LOOK AT THE NYSE COMPOSITE INDEX ... Every time I write about a certain stock market index, I'm asked why I don't write about some of the others. I generally try to spread my coverage around to all the major stock indexes, but can'...
READ MORE
MEMBERS ONLY
THE S&P 500 FROM THREE TIME DIMENSIONS -- SHORT-TERM TREND IS NEUTRAL WHILE LONG-TERM SIGNALS ARE MIXED
by John Murphy,
Chief Technical Analyst, StockCharts.com
DAILY CHART SHOWS NEUTRAL TREND ... In order to understand why the market is caught in a lot of cross-currents right now, it's necessary to look at it from different time perspectives. It's not enough to just consult the daily chart. It's necessary to also...
READ MORE
MEMBERS ONLY
FINANCIALS LEAD MARKET RALLY -- MARKET INDEXES EXCEED INITIAL RESISTANCE LEVELS -- LIGHTEN UP ON BEAR POSITIONS
by John Murphy,
Chief Technical Analyst, StockCharts.com
FINANCIAL SPDR EXCEEDS 200-DAY LINE ... I've written several times recently that if the market were going to stage a rally, one of the groups that would lead it higher would be the financials. And that's what happened today. In a strong market day, financials were the...
READ MORE
MEMBERS ONLY
FED TIGHTENS AS EXPECTED -- MARKET STILL TESTING OVERHEAD RESISTANCE -- DROP IN OIL WEIGHS ON ENERGY SECTOR
by John Murphy,
Chief Technical Analyst, StockCharts.com
CRUDE NEARING TEST OF 200-DAY AVERAGE ... Crude oil prices fell over a dollar today and ended back under the $50 level. That continues the short-term downtrend that started in mid-March. Chart 1 shows that crude is nearing a test of its 200-day moving average. It bounced off that long-term support...
READ MORE
MEMBERS ONLY
HEALTHCARE TAKES TOP SPOT IN APRIL -- DRUG STOCKS GET BETTER -- DNA EXAGGERATES BIOTECH BOUNCE -- ABI BREAKS OUT -- WATCHING RESISTANCE LEVELS
by John Murphy,
Chief Technical Analyst, StockCharts.com
HEALTHCARE SPDR MOVES AHEAD OF UTILITIES... Chart 1 shows the performance of the nine sector SPDRs for the month of April relative to the S&P 500 which is the zero line. Healthcare moved slightly ahead of the utilities as the best sector performer for April. Financials and consumer...
READ MORE
MEMBERS ONLY
WEAK GDP REPORT HURTS STOCKS BUT HELPS BONDS -- TIPS LEAD BOND RALLY -- WHY COMMODITY DOWNTURNN IS BAD FOR STOCKS -- LOSS OF ENERGY LEADERSHIP ISN'T GOOD EITHER UNTIL SOMETHING ELSE TURNS UP
by John Murphy,
Chief Technical Analyst, StockCharts.com
FIRST QUARTER GDP CONFIRMS WEAKENING ECONOMY ... The economic news keeps getting worse. Consumer confidence is falling as are durable goods orders, while inventories are building. The drop in consumer confidence suggests a drop in consumer spending (which is two-thirds of the economy). The drop in durable good orders reveals lower...
READ MORE
MEMBERS ONLY
DROP IN BOND YIELDS BOOSTS RATE-SENSITIVE STOCKS LIKE UTILITIES AND REITS -- OVERSOLD FINANCIALS ARE REBOUNDING
by John Murphy,
Chief Technical Analyst, StockCharts.com
BOND YIELDS CONTINUE TO DROP ... Two things happened today that help explain the continuing drop in bond yields -- and another jump in bond prices. One is the plunge in crude oil futures, which is anti-inflationary. Another is the big drop in durable goods orders, which is more evidence of...
READ MORE
MEMBERS ONLY
ENERGY STOCKS DROP WITH OIL -- OIL SERVICE INDEX UP AGAINST LONG-TERM RESISTANCE
by John Murphy,
Chief Technical Analyst, StockCharts.com
CRUDE DROPS HEAVILY... A big buildup in crude oil inventories has pushed the key commodity down by $1.85 in afternoon trading. Chart 1 shows crude slipping back under its 50-day moving average. It's still above its mid-April low, however, at $51. The drop in crude is causing...
READ MORE
MEMBERS ONLY
GOLD SHARES BREAK LONG-TERM SUPPORT LINES AS NEWMONT TUMBLES
by John Murphy,
Chief Technical Analyst, StockCharts.com
GOLD STILL OVER 200-DAY LINE, BUT XAU ISN'T ... A bounce in the U.S. dollar is starting to put some downward pressure on the price of gold. The last time I looked at the gold market was on April 18 when it was bouncing off its 200-day moving...
READ MORE
MEMBERS ONLY
MARKET SELLS OFF ON RISING VOLUME -- TECHNICAL BOUNCE COULD BE ENDING
by John Murphy,
Chief Technical Analyst, StockCharts.com
NASDAQ 100 DROPS ON HEAVIER VOLUME... Last evening I wrote about the lack of upside progress by the Nasdaq market and also the lack of upside volume, which has been a problem for the entire market. Things took a turn for the worse today. The Nasdaq 100 Shares (QQQQ) helped...
READ MORE
MEMBERS ONLY
RUSSELL 2000 CAN'T GET BACK OVER ITS 200-DAY LINE - RECENT MARKET BOUNCE LOOKS LIKE A BEAR FLAG AND A WAVE 4 WHICH MAY BE ABOUT OVER
by John Murphy,
Chief Technical Analyst, StockCharts.com
HEALTH CARE HOLDING UP OK ... One of our readers asked if the healthcare group was still holding up. The answer is yes. Chart 1 shows the Health Care Sector SPDR (XLV) still trading over its 50-day moving average. Its relative strength line just recently hit a new high for the...
READ MORE