MEMBERS ONLY
EUR/USD Completes H&S Top Formation and Looks Ready For a BIG Move Lower
by Julius de Kempenaer,
Senior Technical Analyst, StockCharts.com
The Relative Rotation Graph above shows the rotation for the G10 currencies against the USD, which is the base (=benchmark) for this universe. Or, better, it shows nine of the G10 currencies against the USD.
The general direction for this universe is pretty clear. The majority is moving inside the...
READ MORE
MEMBERS ONLY
Sector Spotlight: H&S Formation Calls for BIG Move
by Julius de Kempenaer,
Senior Technical Analyst, StockCharts.com
On this edition of StockCharts TV's Sector Spotlight, I take a chance and bring in seasonality for next month. Usually, we do that on the last Tuesday of the month, but this time the last Tuesday (next week) falls exactly on the last day of August and we...
READ MORE
MEMBERS ONLY
Sector Spotlight: Conflicting Sector Rotations
by Julius de Kempenaer,
Senior Technical Analyst, StockCharts.com
On this edition of StockCharts TV's Sector Spotlight, I look at last week's rotations for asset classes and sectors and conclude that the current sector rotation is throwing curve balls at investors making it difficult to come up with a very clear and well-defined trend or...
READ MORE
MEMBERS ONLY
From Sectors to Groups to Stocks to Find One Name That Dominates
by Julius de Kempenaer,
Senior Technical Analyst, StockCharts.com
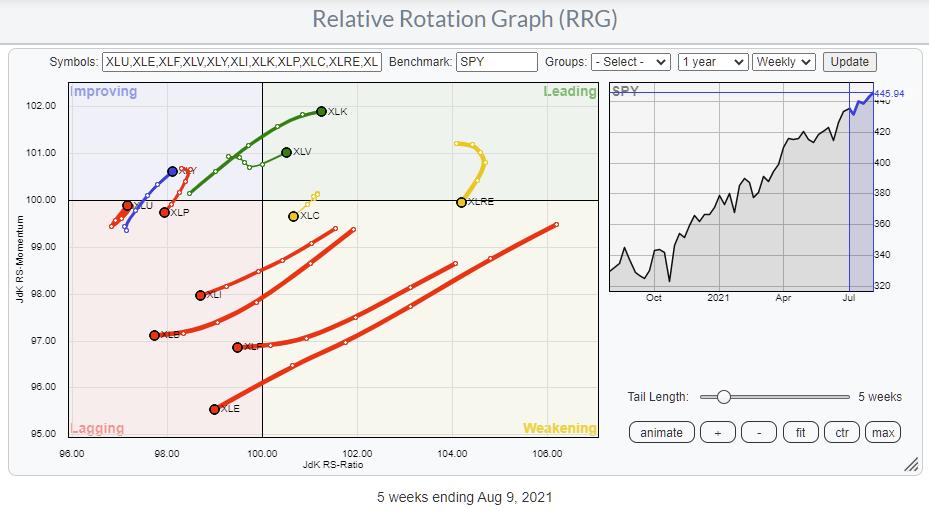
Relative Rotation Graphs are a great tool to use for a top-down approach. Lots of people look at sectors and trade the sector ETFs. The State Street sector SPDRs range (XLK, XLY, XLP, etc.) is probably the most popular family of ETFs for that purpose. The RRG above shows the...
READ MORE
MEMBERS ONLY
Sector Rotation to Discretionary Only in Large Cap Segment, Small Caps Lagging
by Julius de Kempenaer,
Senior Technical Analyst, StockCharts.com
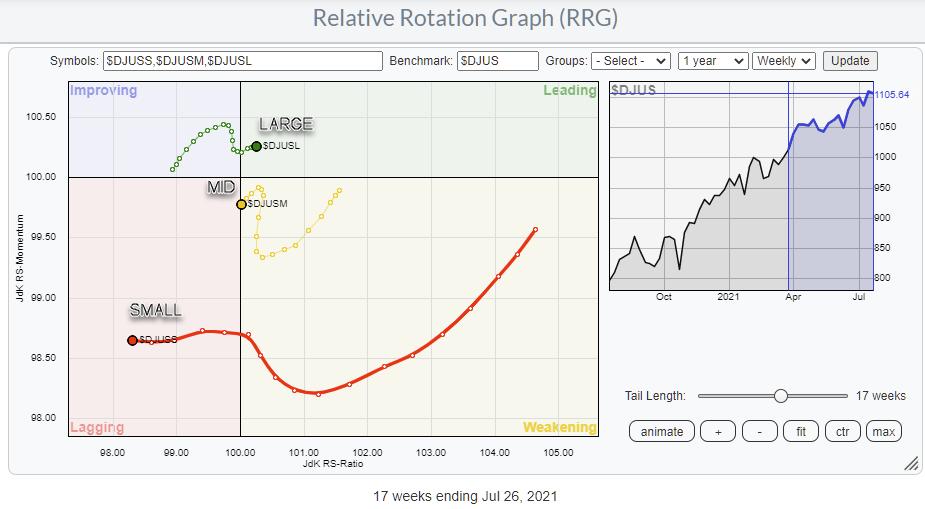
For a few weeks already I am monitoring the rotation between large-, mid-, and small-cap segments.
On the various Relative Rotation Graphs, the deterioration for Small-Caps and, to a lesser degree, Mid-Caps vs Large-Caps is clearly visible.
Over the last 13 weeks, Large Caps have pushed into the leading quadrant...
READ MORE
MEMBERS ONLY
Sector Spotlight: Watching Healthcare for Defense
by Julius de Kempenaer,
Senior Technical Analyst, StockCharts.com
On this edition of StockCharts TV's Sector Spotlight, I spend the entire show on talking you through the current rotations for Asset Classes and Sectors and how they interact with longer term trends and price charts. Caution remains for the S&P 500, while the Healthcare sector...
READ MORE
MEMBERS ONLY
Sector Spotlight: Monthly Trends Intact
by Julius de Kempenaer,
Senior Technical Analyst, StockCharts.com
On this edition of StockCharts TV's Sector Spotlight, I go over the completed monthly charts for July, highlighting the major trends and pointing out the areas of support and resistance to watch. Before the break, I give a quick overview of last week's rotations for sectors...
READ MORE
MEMBERS ONLY
In Healthcare, Focus on Supplies and Equipment; Avoid Providers
by Julius de Kempenaer,
Senior Technical Analyst, StockCharts.com
After slowly rolling over while inside the improving quadrant, the tail on XLV (Health Care) picked up again at the start of this week and is now moving into the leading quadrant.
This move follows the recent rotation on the daily RRG, which started out in the leading quadrant, rolled...
READ MORE
MEMBERS ONLY
A Warning From Small Caps Weakness Across The Board
by Julius de Kempenaer,
Senior Technical Analyst, StockCharts.com
The Relative Rotation Graph showing the rotations for Large-, Mid- and Small-Cap indexes is sending a very clear message: Avoid Small-Caps. (And also Mid-Caps.)
The large-cap segment pushes further into the leading quadrant, while small-caps are on a very long tail moving deeper into negative territory. It looked as if...
READ MORE
MEMBERS ONLY
RRG Identifies 2 Interesting Semiconductor Stocks
by Julius de Kempenaer,
Senior Technical Analyst, StockCharts.com
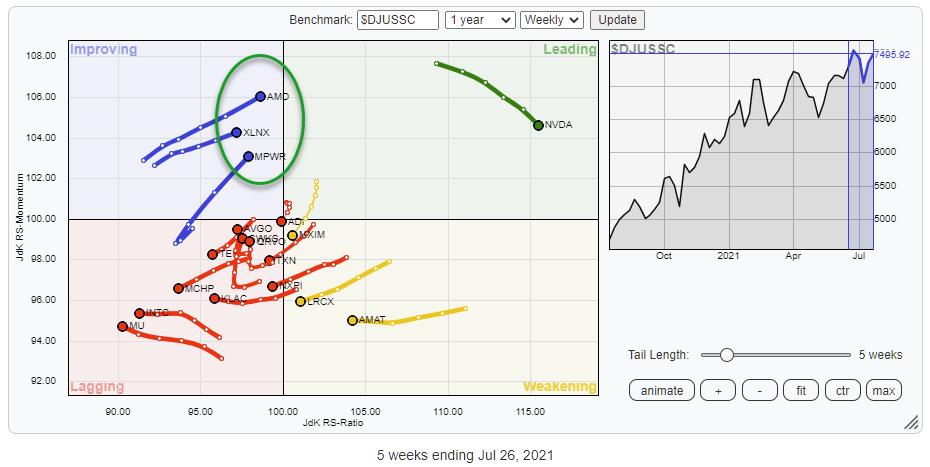
The Relative Rotation Graph above shows the rotation for the members of the Semiconductor group against the DJ US Semiconductor index. Clearly, NVDA is the main component of this group, and it has been leading the group higher recently. Over the last few weeks, however, NVDA has started to lose...
READ MORE
MEMBERS ONLY
Sector Spotlight: Tech is Back, But...
by Julius de Kempenaer,
Senior Technical Analyst, StockCharts.com
On this edition of StockCharts TV's Sector Spotlight, I highlight interesting seasonal patterns for various sectors and explore if they are aligning with the current rotations on the Relative Rotation Graph. It looks like August has some interesting seasonal anomalies that are worth exploring. 7 out of the...
READ MORE
MEMBERS ONLY
Technology Rotating Into Leading Quadrant on RRG, But Will It Be Enough?
by Julius de Kempenaer,
Senior Technical Analyst, StockCharts.com
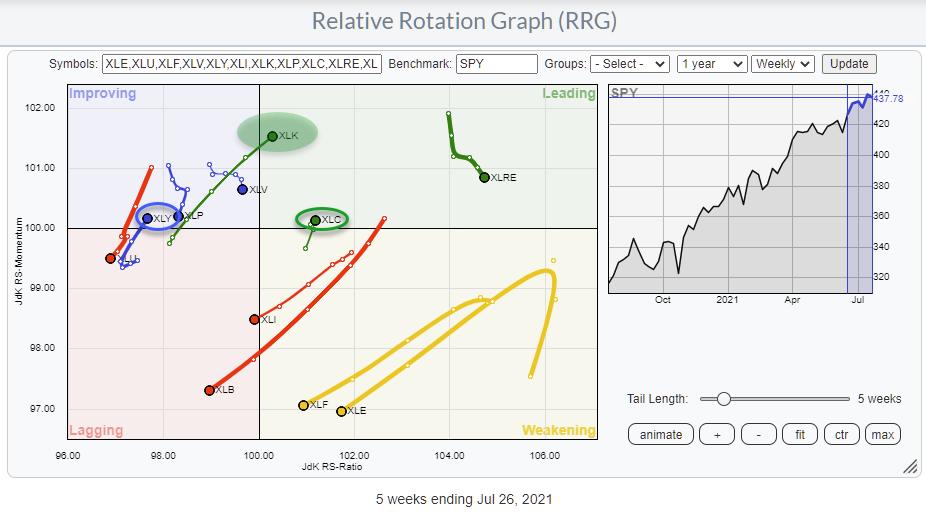
At the start of this week, the technology sector is rotating into the leading quadrant on the weekly RRG. Clearly, the endpoint of the tail is not fixed until Friday's close. Still, the improvement is visible and follows the improvement that was already visible for a few weeks...
READ MORE
MEMBERS ONLY
Long Overdue RRG Basket Update
by Julius de Kempenaer,
Senior Technical Analyst, StockCharts.com
First of all, I'm sorry I had to cancel today's episode of Sector Spotlight. I've been battling a nasty cough/cold and a sore throat with not much voice left for a week now, and things did not improve enough to do a decent...
READ MORE
MEMBERS ONLY
Thinking Outside the US Box
by Julius de Kempenaer,
Senior Technical Analyst, StockCharts.com
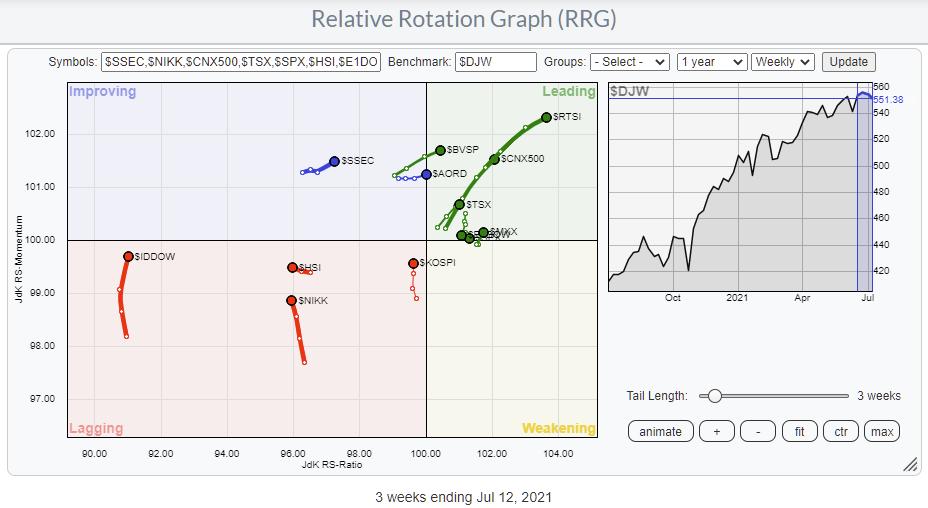
The Relative Rotation Graph above shows the rotation for major stock market indexes against the Dow Jones Global Index.
First of all, this is a so-called "open universe" which means that not all constituents of the benchmark are plotted on the graph. As a result, the universe is...
READ MORE
MEMBERS ONLY
Sector Spotlight: Answering Viewer Questions (+ Charting the Second Half!)
by Julius de Kempenaer,
Senior Technical Analyst, StockCharts.com
On this edition of StockCharts TV's Sector Spotlight, I seize the opportunity to answer questions from the mailbag. Why is this stock showing a negative performance while it is inside the leading quadrant? Can you give some guidelines on where to buy or sell? These are the major...
READ MORE
MEMBERS ONLY
This Energy Group is Moving on the RRG
by Julius de Kempenaer,
Senior Technical Analyst, StockCharts.com
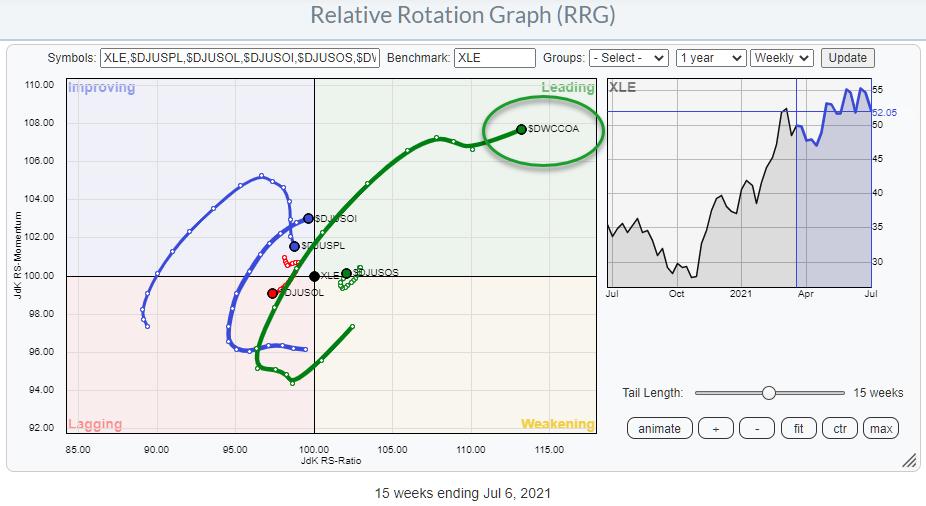
This Relative Rotation Graph shows the industries that make up the Energy sector. One tail that especially stands out is for $DWCCOA. I have looked at this RRG, and the sector before, but always excluded Coal as none of the stocks in that index are in the S&P....
READ MORE
MEMBERS ONLY
Sector Spotlight: Risk for SPX Increasing
by Julius de Kempenaer,
Senior Technical Analyst, StockCharts.com
On this edition of StockCharts TV's Sector Spotlight, I go over the completed monthly charts for June. Starting with Asset Classes, I note the stretched levels for the stock market and revives the concept of "Reversed Relative Strength" that I first introduced in a blog article...
READ MORE
MEMBERS ONLY
Elevated Risk for Stocks
by Julius de Kempenaer,
Senior Technical Analyst, StockCharts.com
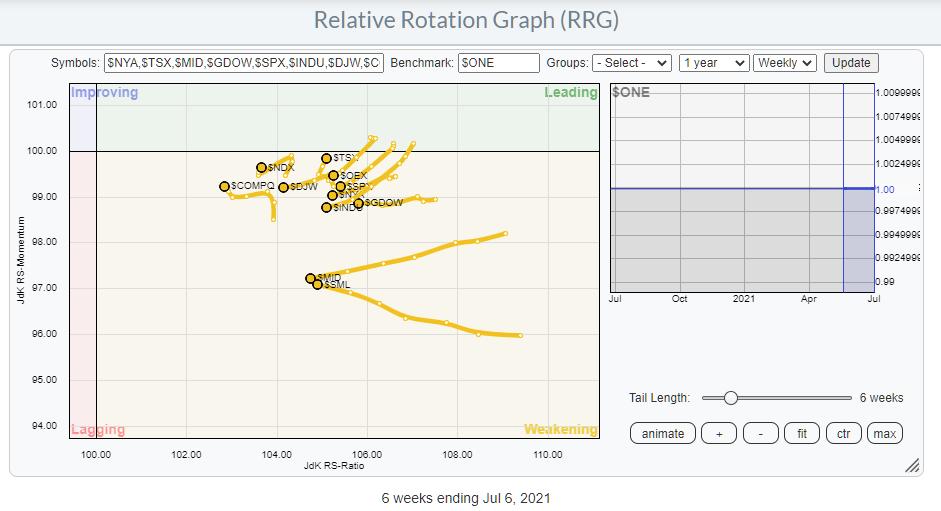
The RRG above shows the ABSOLUTE rotations for a selection of major indexes. Instead of plotting them against a global or otherwise encompassing index, I have plotted them against $ONE to get a handle on their underlying absolute trends. What is noticeable is that they are all inside the weakening...
READ MORE
MEMBERS ONLY
Energy vs. Utilities: 2 Sectors, 8 Groups, 28 Stocks
by Julius de Kempenaer,
Senior Technical Analyst, StockCharts.com
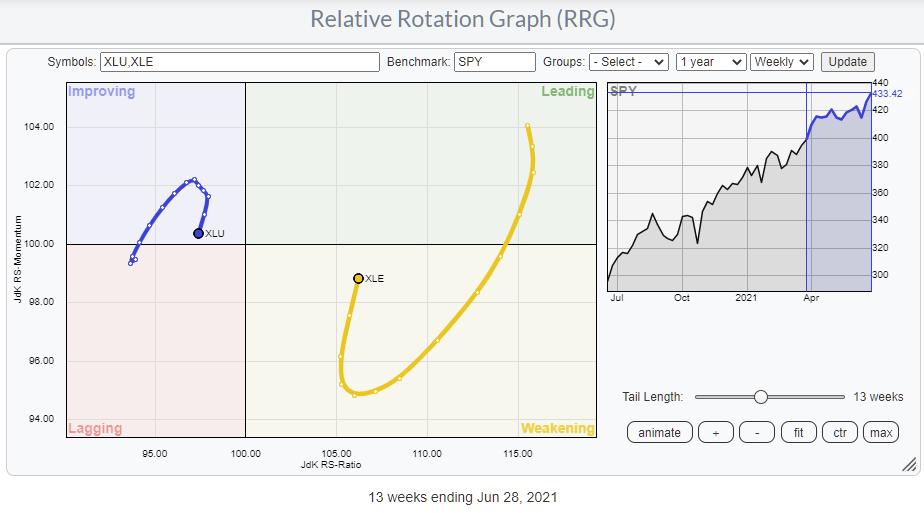
On the Sector RRG, the tails for Energy and Utilities stand out. The Utilities sector is positioned inside the improving quadrant, but started rolling over a few weeks ago and is now heading towards the lagging quadrant again. On the opposite side, Energy is inside the weakening quadrant, but is...
READ MORE
MEMBERS ONLY
Sector Spotlight: Will Seasonality Save SPX?
by Julius de Kempenaer,
Senior Technical Analyst, StockCharts.com
On this edition of StockCharts TV's Sector Spotlight, as per usual on the last Tuesday of the month, I dive into seasonality for sectors. This time, I present a sneak preview of some work that expands on the 3D visualizations that I usually use for this segment. At...
READ MORE
MEMBERS ONLY
Growth / Value... A (Fake) Break?
by Julius de Kempenaer,
Senior Technical Analyst, StockCharts.com
The Relative Rotation Graph above shows growth vs. value stocks rotations over the last six months (two quarters). After the initial cross into the leading/lagging quadrant, the relationship almost immediately started to move back in favor of Growth. Until both tails hooked in the week of 22 Feb, from...
READ MORE
MEMBERS ONLY
Sector Spotlight: SPX on the Edge
by Julius de Kempenaer,
Senior Technical Analyst, StockCharts.com
On this edition of StockCharts TV's Sector Spotlight, after spending almost an entire show on a question from the mailbag last week, I shift gears again and highlight the most important rotations in asset classes and sectors. In the asset class segment, I look closely at the stock/...
READ MORE
MEMBERS ONLY
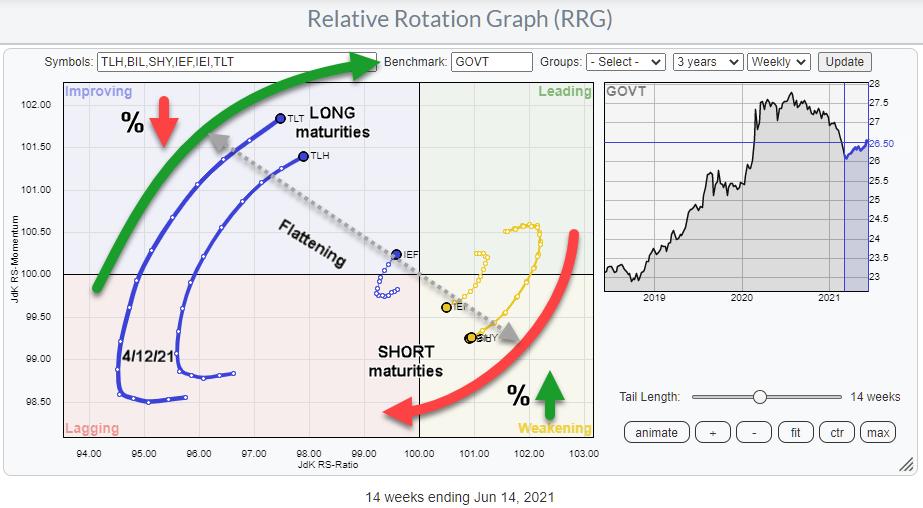
Is The Bond Market Sending Us Warning Signals?
by Julius de Kempenaer,
Senior Technical Analyst, StockCharts.com
There's been a lot of talk and articles on rates, rising yields, and rate hikes lately. That seems like a good moment for a reminder of the fact that Relative Rotation Graphs can also be very well used to visualize the (relative) movement of yields for various maturities....
READ MORE
MEMBERS ONLY
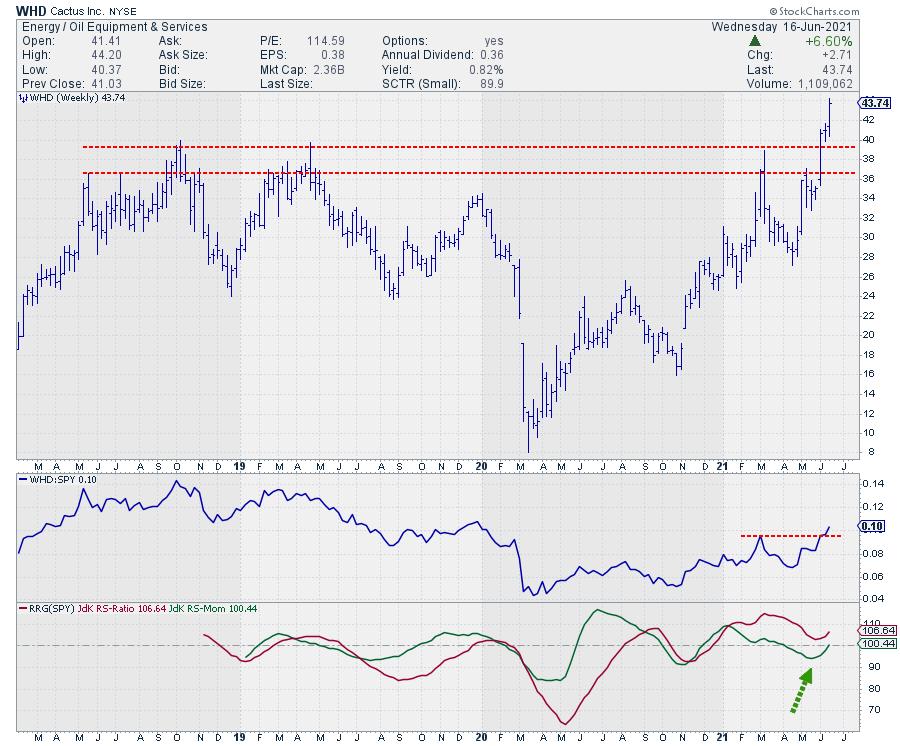
Cactus, Not The Plant, Is Breaking Out.
by Julius de Kempenaer,
Senior Technical Analyst, StockCharts.com
In yesterday's article in the RRG blog, I highlighted the Oil&Equipment Services industry as potentially interesting.
Using the scan-manager to find the members of this industry gives 78 matching results.
[group is OilEquipmentServices]
One thing that we need to take into account when using the scan-manager...
READ MORE
MEMBERS ONLY
Financials and Energy Sectors Are (Re-)Gaining Strength -- Which Industries to Watch?
by Julius de Kempenaer,
Senior Technical Analyst, StockCharts.com
The Relative Rotation Graph for US sectors shows interesting rotations on the tails of the Financials and the Energy sectors. These two sectors are inside the weakening quadrant on the RRG, but ranking highest on the JdK RS-Ratio scale.
Both sectors completed a first stint through the leading quadrant, entering...
READ MORE
MEMBERS ONLY
Sector Spotlight: Does RRG Really Matter?
by Julius de Kempenaer,
Senior Technical Analyst, StockCharts.com
On this edition of StockCharts TV's Sector Spotlight, I address an email I received from a user with the subject line "Does RRG Really Matter?" At first glance, one could think a lot of things about such a subject line. However, it appeared to be a...
READ MORE
MEMBERS ONLY
Sector Spotlight: Putting Rotation into Perspective
by Julius de Kempenaer,
Senior Technical Analyst, StockCharts.com
On this edition of StockCharts TV's Sector Spotlight, I make up for last week's brief coverage of recent rotations in asset classes and sectors by spending half of today's show examining recent rotations on the daily Relative Rotation Graphs. I put things into longer-term...
READ MORE
MEMBERS ONLY
Recap of Long/Short Baskets, adding CRM (+) and SWKS (-)
by Julius de Kempenaer,
Senior Technical Analyst, StockCharts.com
In today's episode of Sector Spotlight, I did a full review of all stocks that we are monitoring in the RRG L/S baskets. Both baskets (Long and Short) with the stocks on watch are shown in the RRGs above; the members of the Long basket are on...
READ MORE
MEMBERS ONLY
The Big Turnaround in Commodities Continues, Favoring Energy and Agricultural
by Julius de Kempenaer,
Senior Technical Analyst, StockCharts.com
The improvement of commodities started already back in early 2020. Looking at long-term (monthly) charts, that rally seems like one straight move higher.
This chart shows $GNX and GSG stacked on top of each other. ($GNX is the S&P GSCI Commodity Index and GSG is the iShares S&...
READ MORE
MEMBERS ONLY
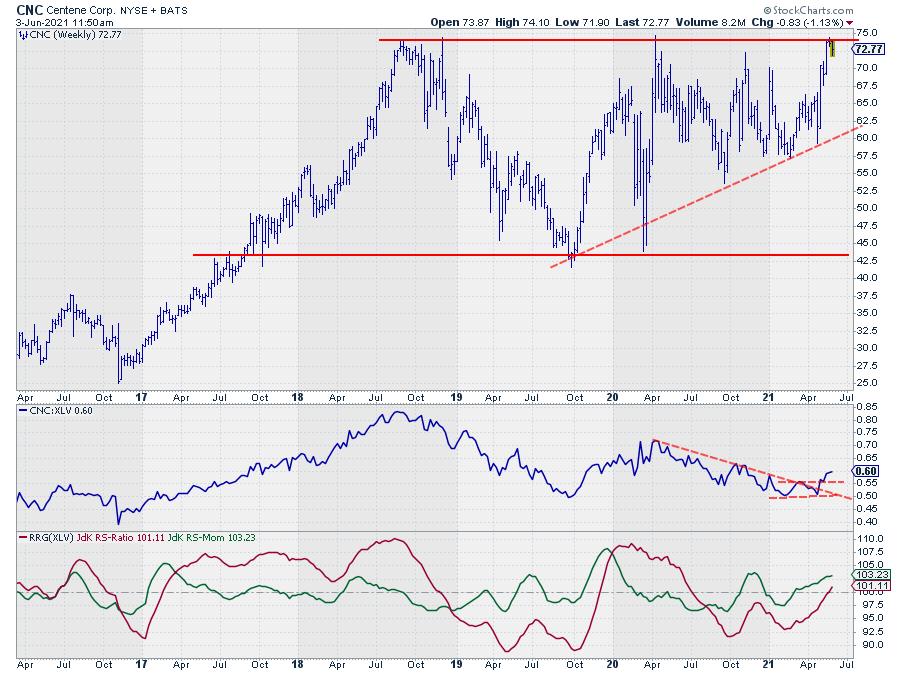
This Health Care Provider is Ready to Pop
by Julius de Kempenaer,
Senior Technical Analyst, StockCharts.com
In this week's episode of Sector Spotlight, I discussed the outlook for the Health Care sector based on the current alignment of the rotation on the Relative Rotation Graph and the seasonal expectation for the sector. Over the last 20 years, the Health Care sector outperformed the S&...
READ MORE
MEMBERS ONLY
Sector Spotlight: It's Healthcare Season
by Julius de Kempenaer,
Senior Technical Analyst, StockCharts.com
On this edition of StockCharts TV's Sector Spotlight, for the first Tuesday of the month, I combine the usual look at long-term trends on the monthly charts with the seasonal expectations along with current rotations as they are visible on the Relative Rotation Graph for US sectors. For...
READ MORE
MEMBERS ONLY
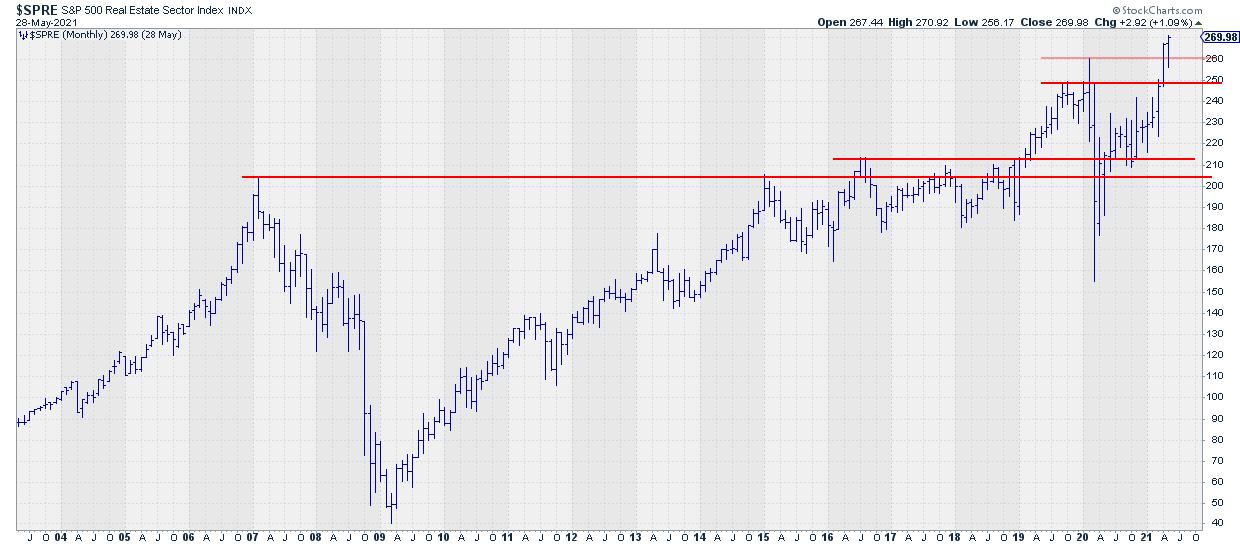
Specialty REITs are Surfacing Inside a Strong Real-Estate Sector
by Julius de Kempenaer,
Senior Technical Analyst, StockCharts.com
Going over the monthly charts, I noticed the confirmation of the upward break visible at the end of April. During May, that upward break managed to hold up above the breakout level, record a new high during the month and close the month at a new closing high.
These are...
READ MORE
MEMBERS ONLY
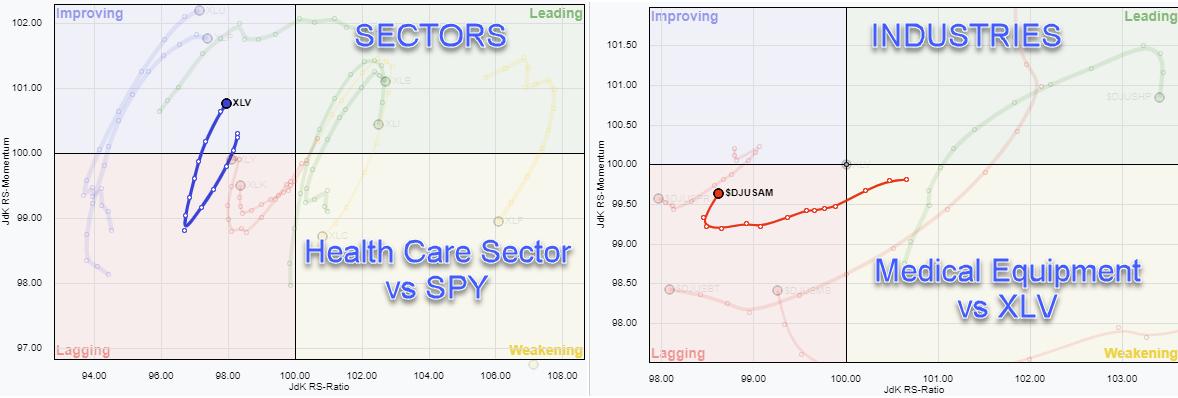
From Sector to Industry to Agilent Technologies
by Julius de Kempenaer,
Senior Technical Analyst, StockCharts.com
The Health Care sector is one of the defensive sectors in the S&P 500 which is on a positive trajectory inside the improving quadrant and heading towards leading. The RRG for sectors, highlighting XLV, is on the left above.
The RRG on the right shows the industries inside...
READ MORE
MEMBERS ONLY
Sector Spotlight: Rotation to Defense Continues
by Julius de Kempenaer,
Senior Technical Analyst, StockCharts.com
On this edition of StockCharts TV's Sector Spotlight, I highlight the rotations in asset classes and US sectors as they played out last week and then put things into a longer-term perspective. The warning signals that already popped up over the last few weeks are persisting. In today&...
READ MORE
MEMBERS ONLY
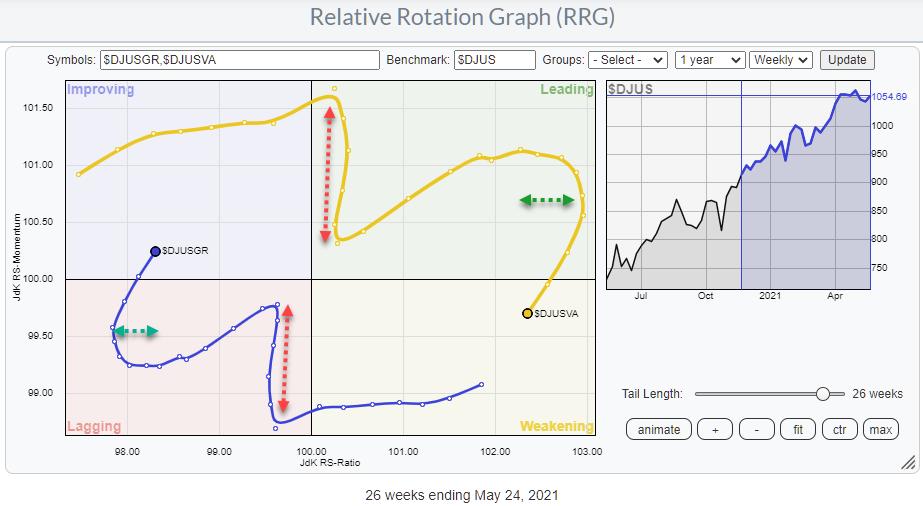
Value to Growth Rotation is Slowing Down
by Julius de Kempenaer,
Senior Technical Analyst, StockCharts.com
The Big Growth to Value Rotation, which has been going on for months, seems to be slowing down. NOT REVERSING, yet, but slowing down!
In the RRG Long/Short baskets, we have IVE on the Long side and IVW on the Short side since September 2020. Looking at the RRG...
READ MORE
MEMBERS ONLY
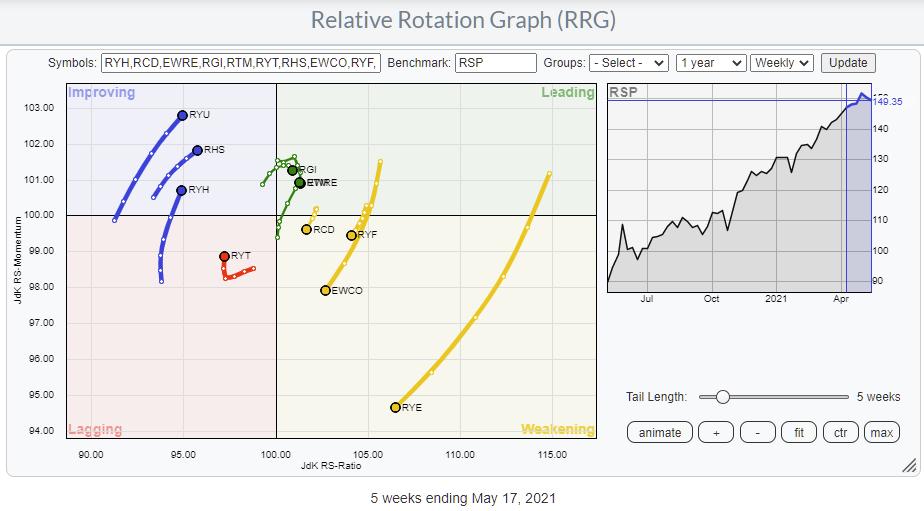
Is Equal-Weight Really Equal Weight When it Comes to Sectors?
by Julius de Kempenaer,
Senior Technical Analyst, StockCharts.com
The Relative Rotation Graph shows the rotation of the Invesco family of equal-weight ETFs. These sector ETFs are often used to eliminate the dominating weight of some individual stocks in specific sectors. Think AAPL and MSFT in Technology, AMZN and (to a lesser extent) TSLA in Consumer Discretionary and FB...
READ MORE
MEMBERS ONLY
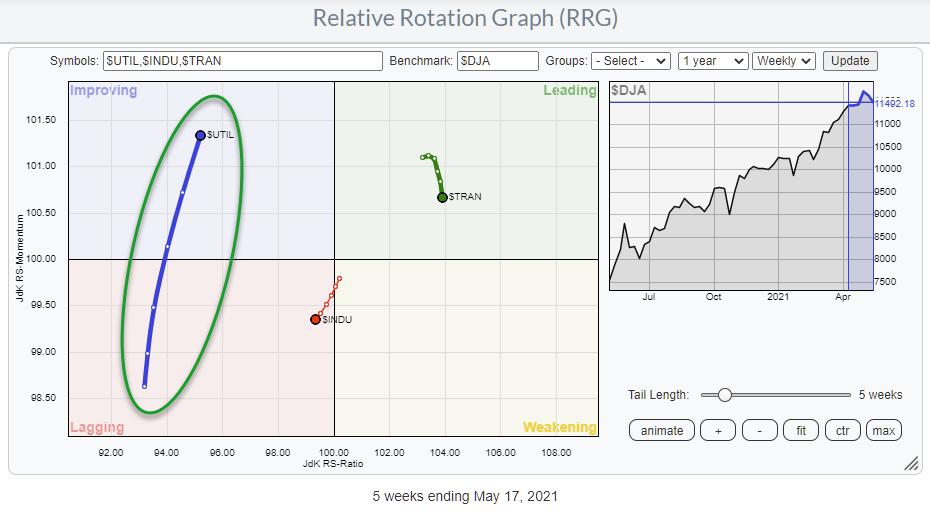
A Long Tail on Utilities Signals Power for Defense
by Julius de Kempenaer,
Senior Technical Analyst, StockCharts.com
A great way to keep an eye on offense vs. defense is using the Relative Rotation Graph above, which shows the three main Dow indexes against the Dow Jones Composite Average.
This RRG is available from the drop-down on the RRG page under <DJ Composite 65>. As the...
READ MORE
MEMBERS ONLY
Sector Spotlight: Discretionary Danger
by Julius de Kempenaer,
Senior Technical Analyst, StockCharts.com
On this edition of StockCharts TV's Sector Spotlight, I start with the usual overview of last week's rotations in asset classes and sectors, blending those observations in with a look at the weekly Relative Rotation Graphs to identify meaningful relative trends. On the Asset Class side,...
READ MORE
MEMBERS ONLY
Sector Spotlight: It's Not Good Under the Hood
by Julius de Kempenaer,
Senior Technical Analyst, StockCharts.com
On this edition of StockCharts TV's Sector Spotlight, I kicksoff the show with an overview of last week's rotation in asset classes, immediately blending them with a longer term picture using the weekly RRGs and price charts. After that, the focus is on stock sectors, starting...
READ MORE
MEMBERS ONLY
RRG Tails Have a Story to Tell
by Julius de Kempenaer,
Senior Technical Analyst, StockCharts.com
One of the main characteristics of a Relative Rotation Graph is the "tail," which shows us the sector's trajectory through recent history.
Tails illustrate how the security ended up in the position where it currently is, helping us to view current rotations and create a big...
READ MORE