MEMBERS ONLY
While Everything is Going Digital, This Stock is Breaking Higher
by Julius de Kempenaer,
Senior Technical Analyst, StockCharts.com
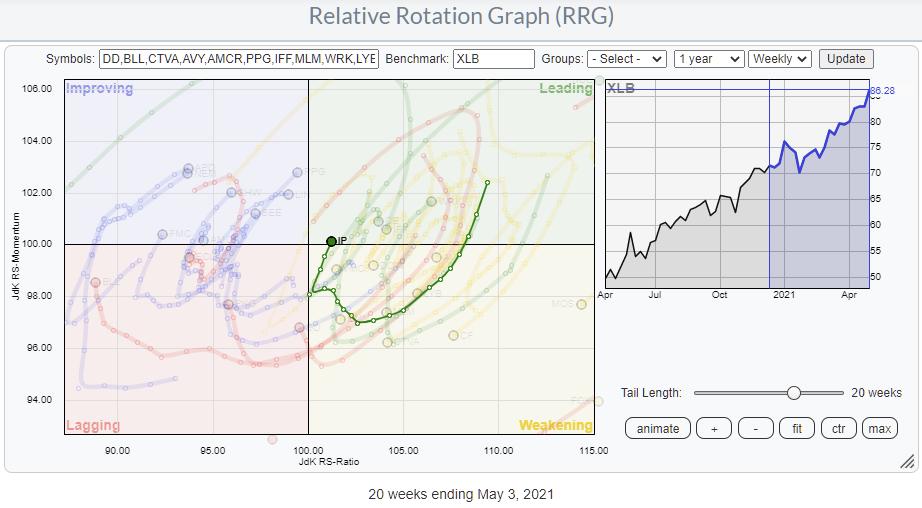
The Relative Rotation Graph for sectors shows XLB, the Materials sector, powering into the leading quadrant.
The RRG at the top of the article shows the rotations of the individual stocks in the Industrials sector, with the tail for IP highlighted. After entering the leading quadrant in October, IP traveled...
READ MORE
MEMBERS ONLY
Europe is Ready to Turn Around a Long Period of Underperformance
by Julius de Kempenaer,
Senior Technical Analyst, StockCharts.com
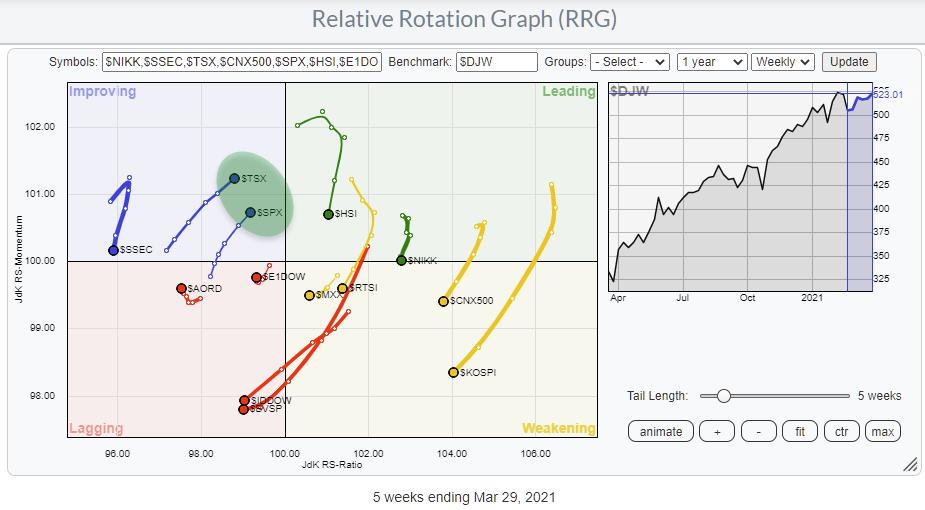
From time to time, I keep an eye on the Relative Rotation Graph showing the rotations of various world markets against the DJ Global Index. The tail on Europe ($E1DOW) has just crossed into the leading quadrant after a quick improving-lagging-improving rotation, setting it up for a powerful rotation into...
READ MORE
MEMBERS ONLY
Sector Spotlight: Short-Term Weakness Ahead
by Julius de Kempenaer,
Senior Technical Analyst, StockCharts.com
On this edition of StockCharts TV's Sector Spotlight, I start the month with an overview of rotations in asset classes and sectors last week using Relative Rotation Graphs. The main theme remains intact; the stock market is in a long-term uptrend and stocks continue to outperform bonds. However,...
READ MORE
MEMBERS ONLY
Seasonality Shows Weakness Ahead For Financials
by Julius de Kempenaer,
Senior Technical Analyst, StockCharts.com
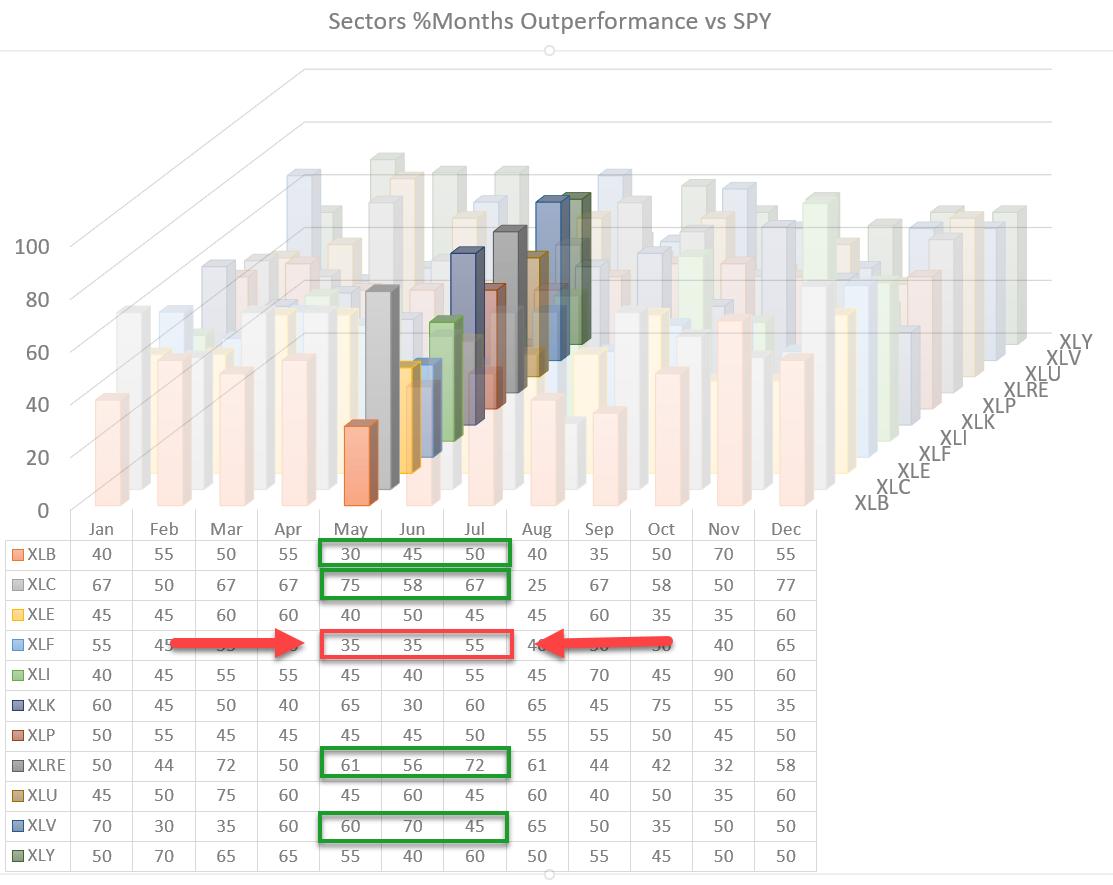
Looking at the 3D visualization for US sectors going into May, one sector stands out negatively. That sector is Financials, the fourth largest sector at ~11% of market cap.
For May and June, the historical record is that the Financial sector outperforms the S&P 500 only 35% of...
READ MORE
MEMBERS ONLY
Sector Spotlight: Seasonal Stars Aligning
by Julius de Kempenaer,
Senior Technical Analyst, StockCharts.com
It's all about tails on this edition of StockCharts TV's Sector Spotlight. For the last Tuesday of the month, I examine the seasonal patterns for sectors and compare them to the current rotations on Relative Rotation Graphs. Five sectors are worth a further investigation based on...
READ MORE
MEMBERS ONLY
Forget Bitcoin, There is a New Kid on The Block(chain)
by Julius de Kempenaer,
Senior Technical Analyst, StockCharts.com
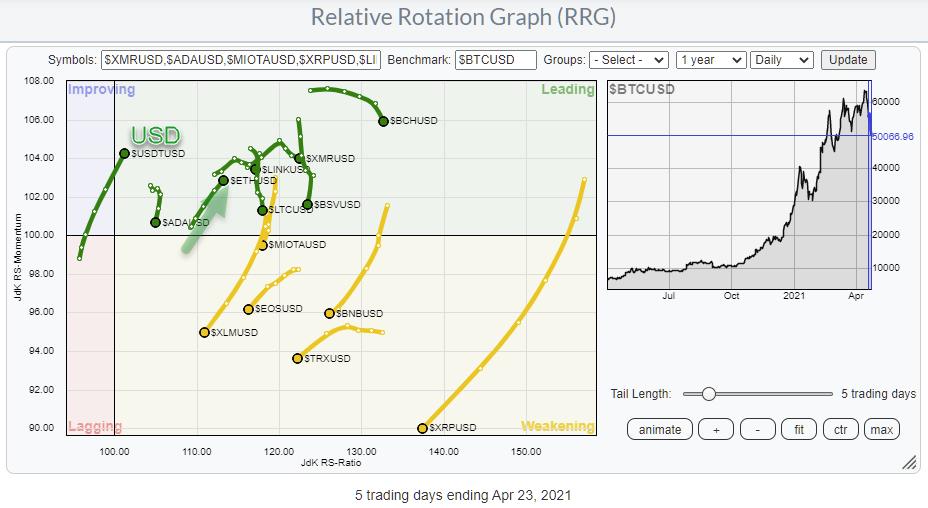
Another wild ride in crypto space this week. Bitcoin dropped almost 10% in value against the US Dollar in the past five days, while market darling DOGE lost a whopping 27%, as did TRON, Bitcoin SV, EOS and a few other major coins.
If you are ever looking for action,...
READ MORE
MEMBERS ONLY
XLB and XLI Show Strong Rotations, But What About the Industries Inside?
by Julius de Kempenaer,
Senior Technical Analyst, StockCharts.com
Currently, two sectors stand out on the Relative Rotation Graph for sectors -- Industrials and Materials. Both tails are pushing further into the leading quadrant after a rotation through weakening and back into leading. Such a rotation usually signals a new up-leg in an already established rising relative trend. If...
READ MORE
MEMBERS ONLY
Sector Spotlight: The Tale of the Tails
by Julius de Kempenaer,
Senior Technical Analyst, StockCharts.com
It's all about tails on this edition of StockCharts TV's Sector Spotlight. After a short look at last week's rotations for asset classes and sectors, I dive into the meaning of the tails on the Relative Rotation Graphs. What do they represent? How to...
READ MORE
MEMBERS ONLY
Can XLK hold without participation of AAPL & MSFT?
by Julius de Kempenaer,
Senior Technical Analyst, StockCharts.com
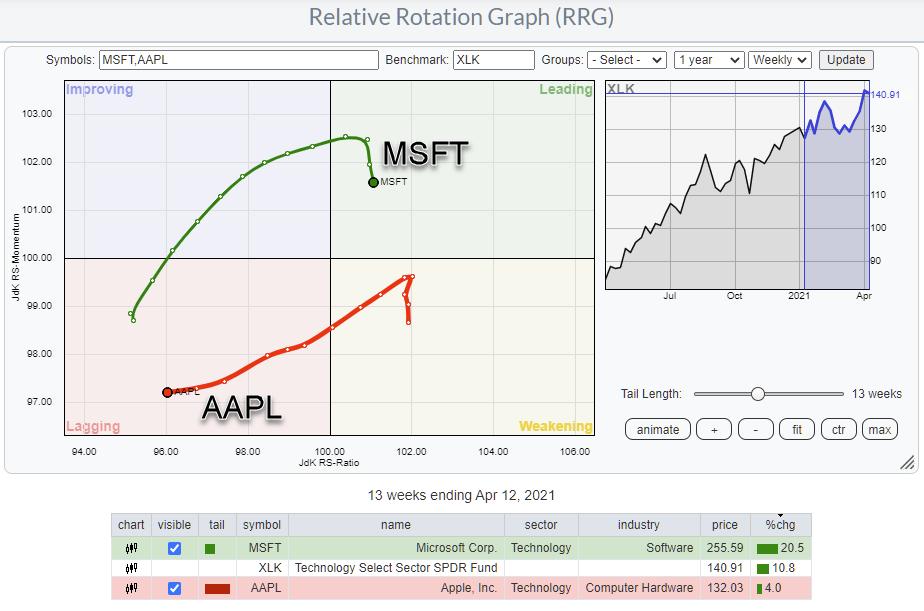
Developments in the technology sector keep me busy, but above all alert.
First of all it's the biggest sector in the S&P 500 and therefore by default an important one to watch. Primarily because you need a lot of power to push the S&P...
READ MORE
MEMBERS ONLY
Sector Spotlight: Strong Rotation for Industrials
by Julius de Kempenaer,
Senior Technical Analyst, StockCharts.com
In this edition of StockCharts TV's Sector Spotlight, I look at last week's rotations for asset classes and sectors and review the daily rotations on the Relative Rotation Graph in combination with the weekly picture, aligning these with the current trends on the price charts. Caution...
READ MORE
MEMBERS ONLY
A Review of the RRG L/S Baskets
by Julius de Kempenaer,
Senior Technical Analyst, StockCharts.com
Earlier today in Sector Spotlight, I discussed the various stocks inside the Long/Short baskets as I show them from time to time. The two RRGs above show both baskets as they currently are after the updates in Sector Spotlight.
Long
On the Long side, I removed EBAY and replaced...
READ MORE
MEMBERS ONLY
A Battle for Breadth on Relative Rotation Graphs
by Julius de Kempenaer,
Senior Technical Analyst, StockCharts.com
This past Thursday, I was one of the guest hosts to fill in for David Keller on The Final Bar, as Dave was enjoying a week off. Of course I brought RRG to the show, but I also wanted to add a bit of educational content on how to use...
READ MORE
MEMBERS ONLY
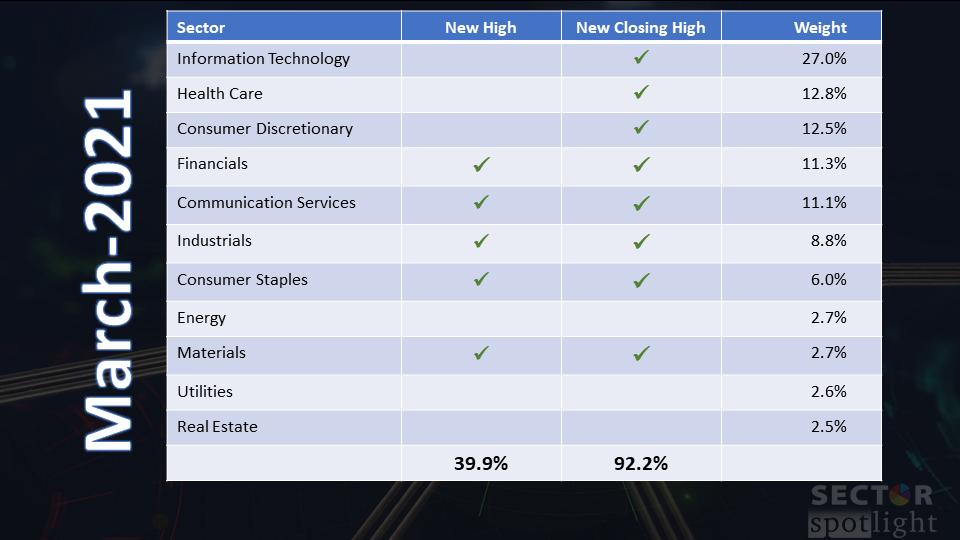
Sector Spotlight: 8 Sectors at New Closing Highs
by Julius de Kempenaer,
Senior Technical Analyst, StockCharts.com
It is the last Tuesday of the month, and that means looking at seasonality!
In this edition of StockCharts TV's Sector Spotlight, it's time to go over some monthly charts! As usual, Julius brings two batches of monthly charts to the show: one for Asset Classes,...
READ MORE
MEMBERS ONLY
Over 90% of "The Market" is in an Uptrend
by Julius de Kempenaer,
Senior Technical Analyst, StockCharts.com
Every first Tuesday of the month, I look at Asset Classes and Sectors' developments using monthly charts. This start-of-the-month routine keeps me on track of the longer-term developments in terms of price trends.
Yes, Relative Rotation Graphs are all about relative trends and relative strength. And I consider that...
READ MORE
MEMBERS ONLY
US Moving Towards Leading Quadrant vs. the World..... oh, and Canada Too
by Julius de Kempenaer,
Senior Technical Analyst, StockCharts.com
With the S&P 500 jumping to new highs, it's interesting to see how that impacts the position and the rotation of the US vs. the rest of the world.
The RRG above visualizes that. The highlighted area shows both the S&P and the Candian...
READ MORE
MEMBERS ONLY
Sector Spotlight: Tech is a Drag
by Julius de Kempenaer,
Senior Technical Analyst, StockCharts.com
It is the last Tuesday of the month, and that means looking at seasonality!
In this edition of StockCharts TV's Sector Spotlight, after an overview of last week's rotations and performances for asset classes and sectors, I bring up his 3-D visualization for sector seasonality and...
READ MORE
MEMBERS ONLY
Comm is Da Bomb
by Julius de Kempenaer,
Senior Technical Analyst, StockCharts.com
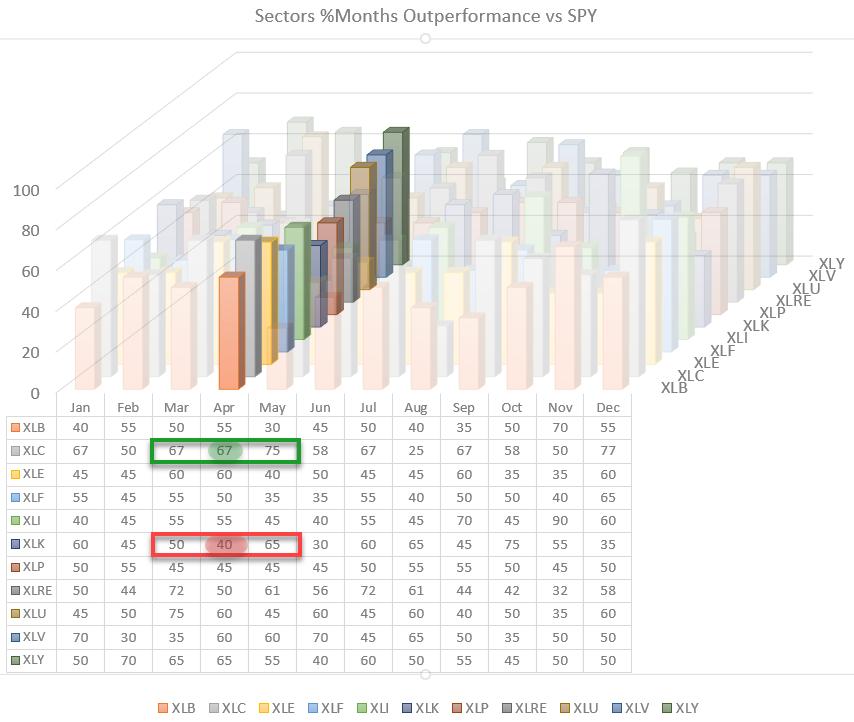
The seasonal trends for sectors vs. the S&P 500 going into April show many 50/50 odds for out- or underperformance. But the two sectors that stand out are interesting and important ones.
Seasonality for Communication services shows that this sector outperformed 67% of the time in April...
READ MORE
MEMBERS ONLY
Tech Is a Drag
by Julius de Kempenaer,
Senior Technical Analyst, StockCharts.com
There is no doubt about it; Tech(nology) is an important sector. As a matter of fact, it is a crucial sector. At 26% weight inside the S&P 500 index, technology is twice as big as the next biggest sector -- Health Care at 13% -- and number...
READ MORE
MEMBERS ONLY
Is the Dow Theory Sending Us a Message?
by Julius de Kempenaer,
Senior Technical Analyst, StockCharts.com
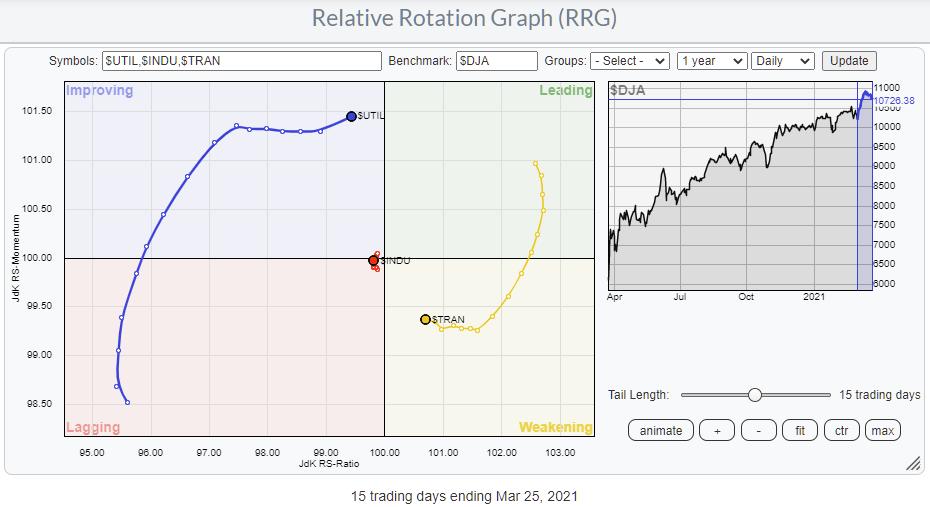
The Dow theory is more than 100 years old, but still holds value today. Sometimes simple things can help you paint a clearer picture for yourself.
One of the principles of the Dow Theory is that "Indices Must Confirm Each Other." Basically, this means that signals or trends...
READ MORE
MEMBERS ONLY
Taking FB and FCX from The RRG L/S Basket
by Julius de Kempenaer,
Senior Technical Analyst, StockCharts.com
The two RRGs above show the long positions in the RRG L/S basket on the left and the short positions on the right. Going over these rotations, combined with the recent performance (dropping around 4% in a few days), two tails stood out.
On the long side, we have...
READ MORE
MEMBERS ONLY
Sector Spotlight: Rising Real Estate
by Julius de Kempenaer,
Senior Technical Analyst, StockCharts.com
Last week, I spent a lot of time on answering a question from the mailbag. This week is all about charts!
In this edition of StockCharts TV's Sector Spotlight, I starting with a look back at the rotations as they unfolded in various asset classes and US sectors....
READ MORE
MEMBERS ONLY
Real Nice Stocks in the Real Estate Sector
by Julius de Kempenaer,
Senior Technical Analyst, StockCharts.com
Every last Tuesday of the month in Sector Spotlight, I review the seasonality for US sectors and try to match the historical performance with the current performance as it is playing out on the Relative Rotation Graph.
For March (see episode 68, "Seasonal Surprise for XLRE"), the Real...
READ MORE
MEMBERS ONLY
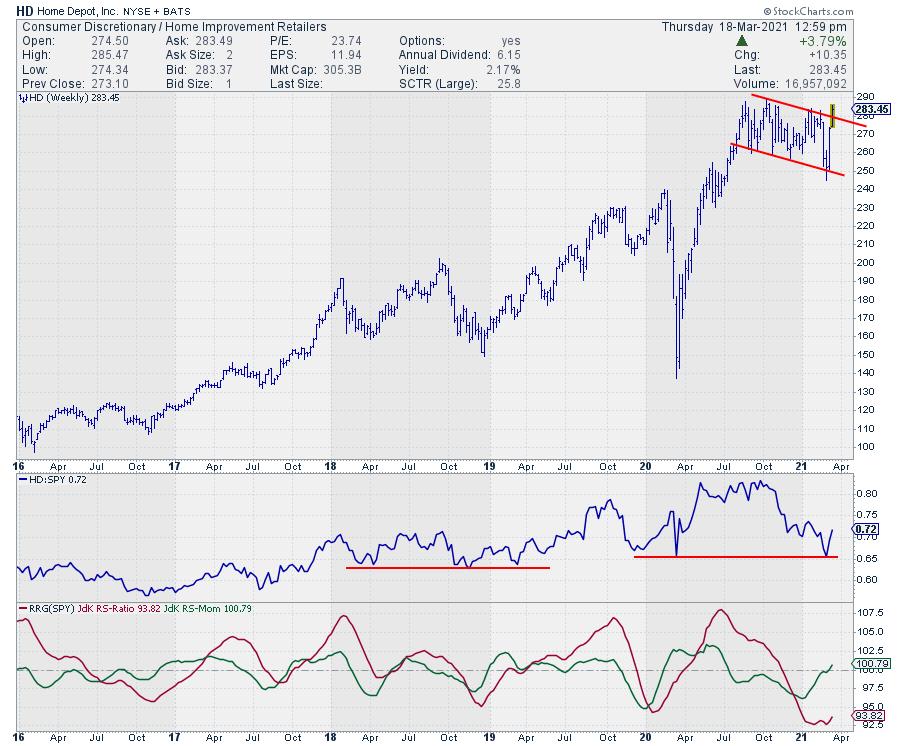
HD Popping From Consolidation and TRV Pushing to New High
by Julius de Kempenaer,
Senior Technical Analyst, StockCharts.com
I started at the Market movers (%up) widget for Dow Jones stocks on my dashboard for today's chart(s). When I requested the RRG for these ten stocks, the RRG below showed up.
These then stocks are all moving higher today, but their relative trends differ significantly, as...
READ MORE
MEMBERS ONLY
Sector Spotlight: A Scan and a Trading Plan
by Julius de Kempenaer,
Senior Technical Analyst, StockCharts.com
In this edition of StockCharts TV's Sector Spotlight, I begin with a quick look at last week's rotations in asset classes and sectors. Then, I look into the RRG mailbag and present in-depth discussion of a recent 3-part question that came in. All three elements that...
READ MORE
MEMBERS ONLY
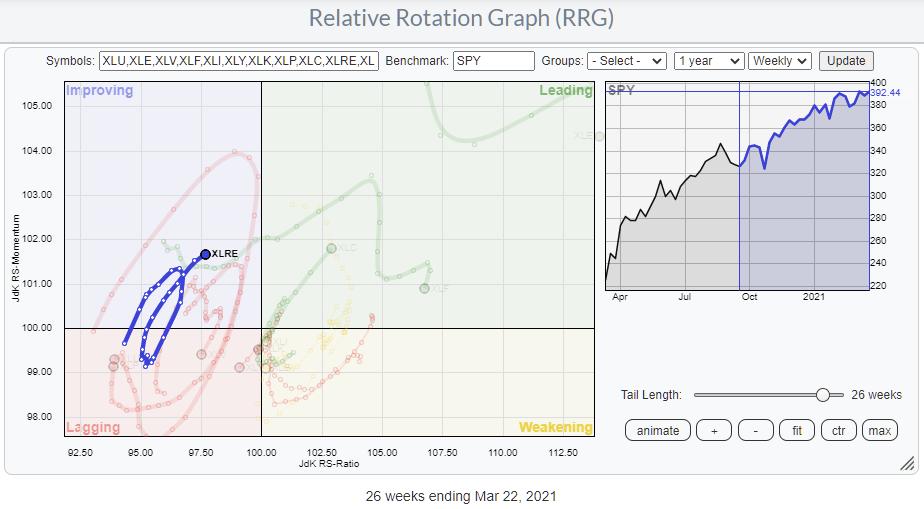
Consumer Discretionary Sector Rotating Back Towards Leading; the Equal Weight Sector, That Is...
by Julius de Kempenaer,
Senior Technical Analyst, StockCharts.com
The Equal Weight version of the Relative Rotation Graph for US sectors shows an interesting divergence in rotation for the Consumer Discretionary sector.
Two weeks ago, 3/2, I showed the RRG for small-cap sectors and analyzed the discrepancies between the small-cap and the large-cap sector rotations. Here also, the...
READ MORE
MEMBERS ONLY
The Name is Value, Growth to Value....
by Julius de Kempenaer,
Senior Technical Analyst, StockCharts.com
The Growth/Value relationship is always interesting to keep an eye on -- but even more so recently.
For a long period of time, roughly from late 2018 until Q3 2020, Growth stocks were beating Value hands down.
The chart above shows the Growth/Value relationship in the big pane...
READ MORE
MEMBERS ONLY
Sector Spotlight: USD Strength and Tech Weakness
by Julius de Kempenaer,
Senior Technical Analyst, StockCharts.com
In this edition of StockCharts TV's Sector Spotlight, I start with a look at what happened last week in terms of rotation for asset classes and sectors. After that, I put these rotations in longer-term perspective using weekly charts and Relative Rotation Graphs while overlaying the 12-month rolling...
READ MORE
MEMBERS ONLY
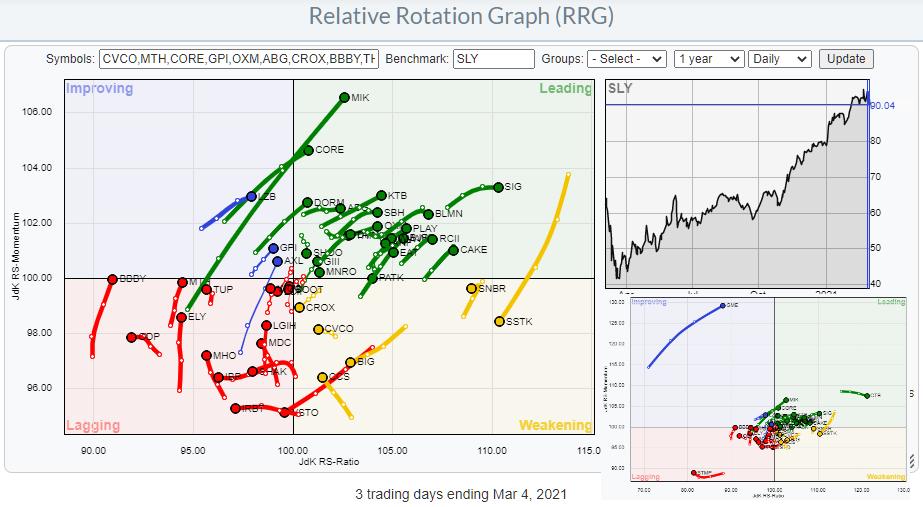
KTB Holds while SLY, SPY and PSCD Drop
by Julius de Kempenaer,
Senior Technical Analyst, StockCharts.com
Recently, I have been talking and writing about small-cap sectors and especially how the small cap segment in the consumer discretionary sector, the PSCD ETF, is currently diverging from its large cap counterpart, XLY. For this article I have collected the top 50 members in PSCD (Invesco), and there are...
READ MORE
MEMBERS ONLY
Sector Spotlight: Small Caps Secret Message
by Julius de Kempenaer,
Senior Technical Analyst, StockCharts.com
In this edition of StockCharts TV's Sector Spotlight, I go over the rotations for asset classes and sectors as they were traced out last week. While talking about the short-term rotations, I bring in the weekly RRGs and charts to find matching and therefore more reliable trends. After...
READ MORE
MEMBERS ONLY
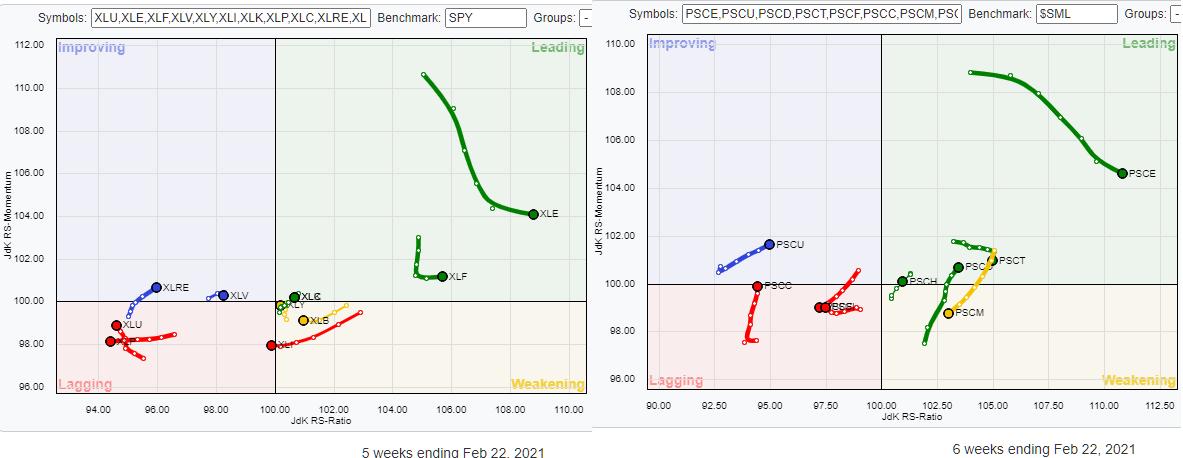
Playing Consumer Discretionary Through PSCD
by Julius de Kempenaer,
Senior Technical Analyst, StockCharts.com
In my article for last weekend's ChartWatchers newsletter, I wrote about a set of ETFs representing small-cap sectors and how they can be used in a Relative Rotation Graph. I also talk about it in this week's episode of Sector Spotlight. The crux is that looking...
READ MORE
MEMBERS ONLY
When the Tails are Diverging, Opportunities Arise
by Julius de Kempenaer,
Senior Technical Analyst, StockCharts.com
Last week, Friday 2/19, Tom Bowley invited me to be his guest in a webinar he did with EarningsBeats.com.
Of course, I talked about RRG in general and we applied it to international markets, crypto-currencies and US sectors. All good fun. After I presented my bit on sectors...
READ MORE
MEMBERS ONLY
Value Small Caps Are Breaking to New Highs
by Julius de Kempenaer,
Senior Technical Analyst, StockCharts.com
One of the predefined RRGs allows you to bring up a universe of growth, value and size indexes, and this can help you to spot how the various parts of the market are positioned against each other and how they are rotating.
Ths small RRG shows the tail of the...
READ MORE
MEMBERS ONLY
Sector Spotlight: Seasonal Surprise for XLRE
by Julius de Kempenaer,
Senior Technical Analyst, StockCharts.com
In this edition of StockCharts TV's Sector Spotlight, since it's the last Tuesday of the month, I dive into the seasonal outlook for the month(s) ahead. Communication Services seems on track with its current rotation on the Relative Rotation Graph. But a surprise could be...
READ MORE
MEMBERS ONLY
Communication Services on Seasonal Track
by Julius de Kempenaer,
Senior Technical Analyst, StockCharts.com
Looking at the 3-D seasonality chart above, most of the sectors have a 50/50 history of outperforming SPY in the coming month of March.
Both Communication Services and Consumer Discretionary are showing an upcoming string of months that are historically strong for them. XLC starts with 62% in March,...
READ MORE
MEMBERS ONLY
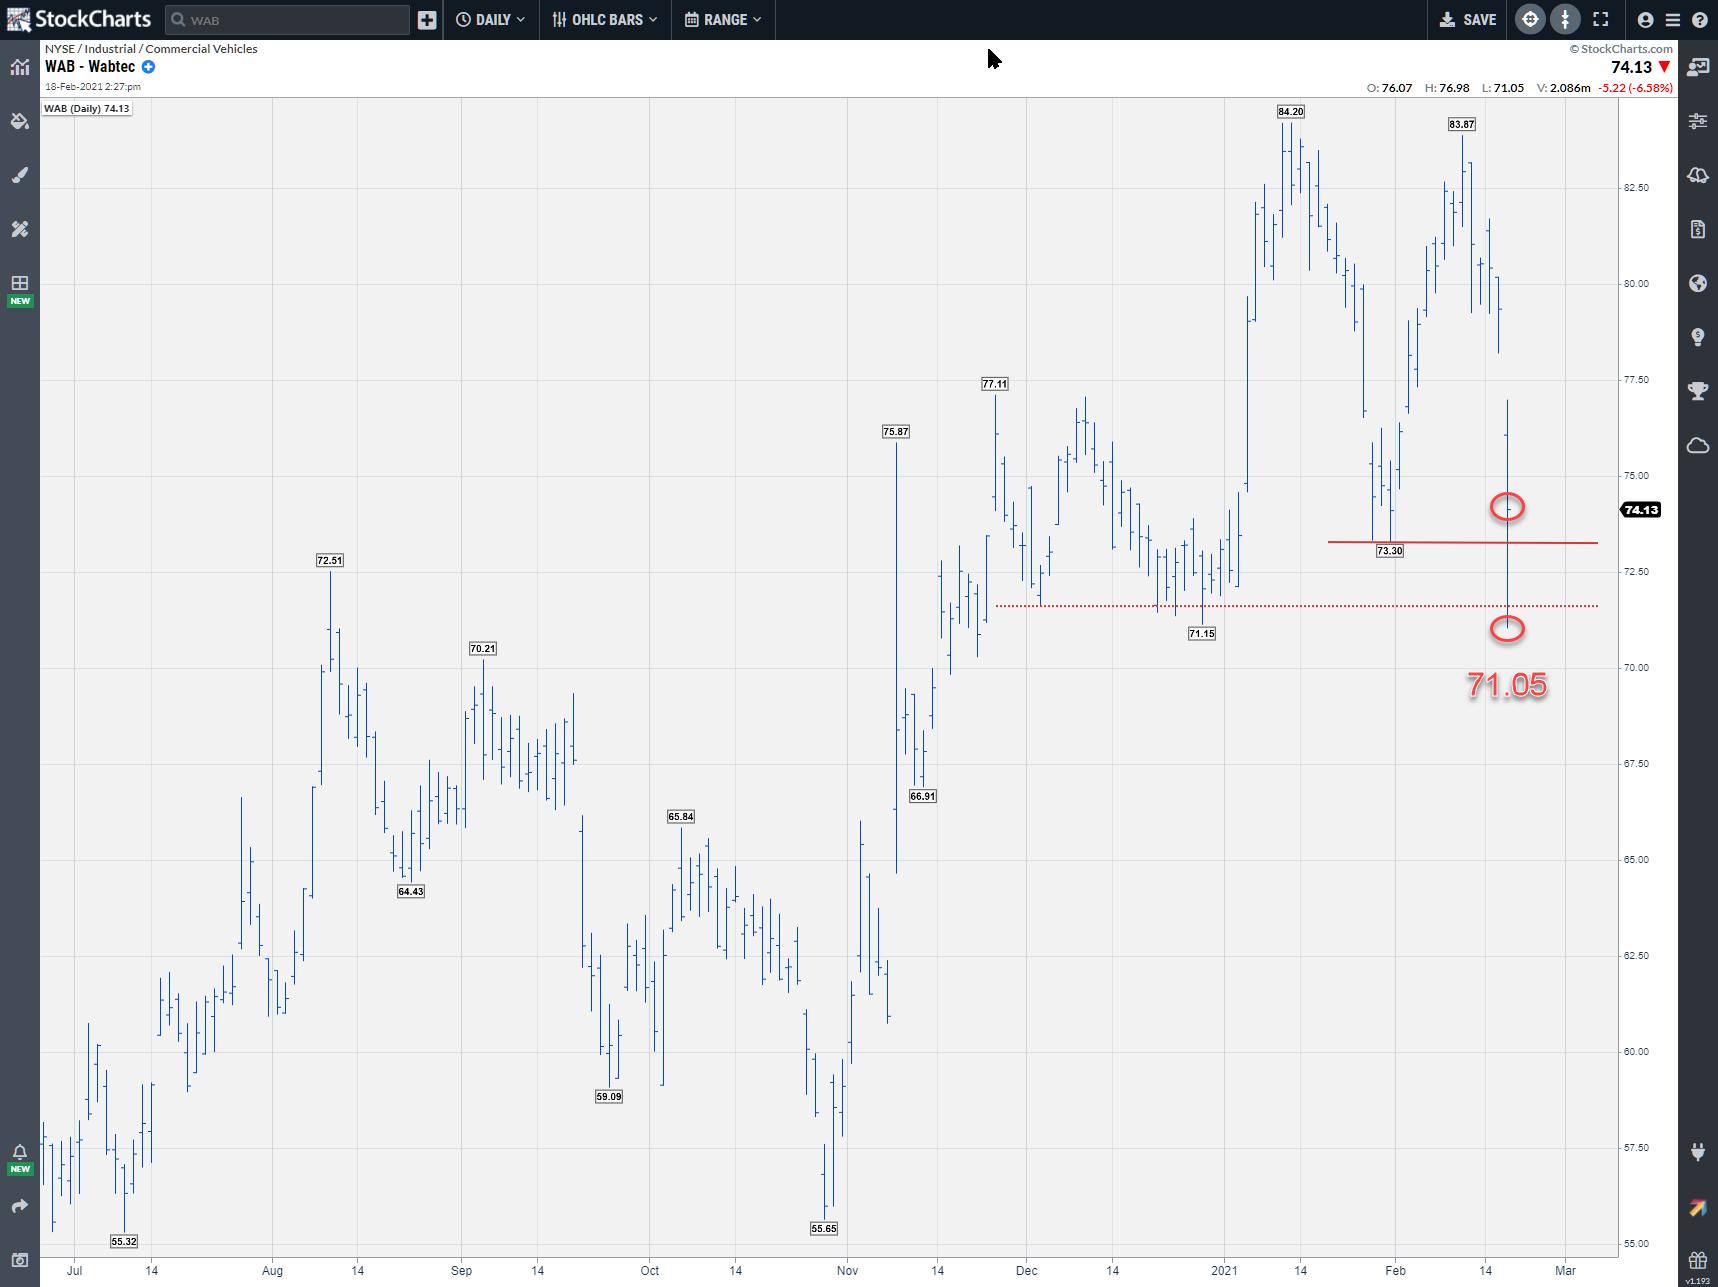
WAB Triggers Turtle Soup Buy Setup
by Julius de Kempenaer,
Senior Technical Analyst, StockCharts.com
One of the BIG improvements or advantages in ACP is the fact that I can run a scan in the side-bar, then immediately click on the symbol to bring up the chart.
One of the scans that I use frequently is the 'Turtle Soup" scan on intraday data....
READ MORE
MEMBERS ONLY
Sector Spotlight: This Bull Has Legs to Run
by Julius de Kempenaer,
Senior Technical Analyst, StockCharts.com
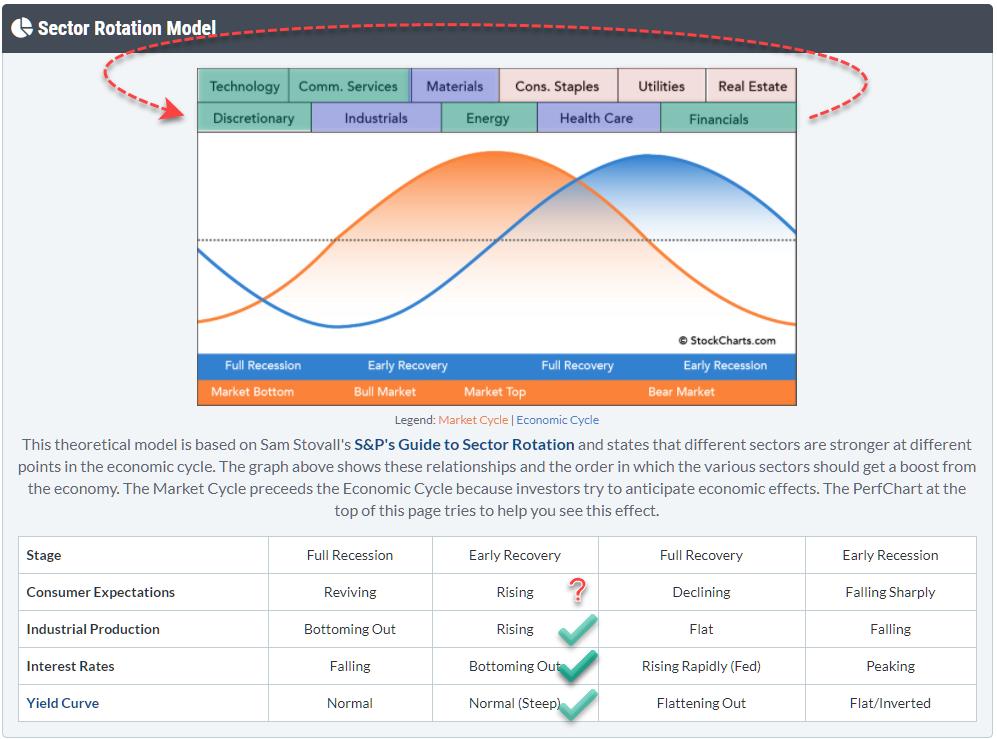
In this edition of StockCharts TV's Sector Spotlight, after a review of last week's rotations in asset classes and sectors, I take a deep dive into the Sector Rotation Model, bringing together all different elements of the Sector Rotation Model using Relative Rotation Graphs to gauge...
READ MORE
MEMBERS ONLY
Using RRG to Find a Match Between Theory and Reality
by Julius de Kempenaer,
Senior Technical Analyst, StockCharts.com
This article appeared in last weekend's ChartWatchers newsletter with the title "Sector Rotation Model Suggests Bull Market in Stocks Ongoing". As I feel that it is one of the more important/better articles showing how to use Relative Rotation Graphs in combination with other analysis techniques,...
READ MORE
MEMBERS ONLY
Sector Rotation Model Suggests Bull Market in Stocks Ongoing
by Julius de Kempenaer,
Senior Technical Analyst, StockCharts.com
From time to time, I like to check the macro environment and try to see if I can find meaningful clues to draw conclusions from generally accepted theories/models. The Sector Rotation Model (From Sam Stovall's guide to sector rotation) is one of those models that I like...
READ MORE
MEMBERS ONLY
These Two Relationships Point to Ongoing Strength for Stocks
by Julius de Kempenaer,
Senior Technical Analyst, StockCharts.com
The RRG above shows the rotations for two relationships that can help you get a handle for the market as a whole:
* Growth vs Value: Generally, when growth stocks are doing well and outperforming value, that is good for the market - whereas, vice versa, when value stocks are outperforming...
READ MORE
MEMBERS ONLY
Sector Spotlight: Three Sectors That Will Drive SPY Higher
by Julius de Kempenaer,
Senior Technical Analyst, StockCharts.com
In this edition of StockCharts TV's Sector Spotlight, I walk you through the current rotations in asset classes and US sectors using Relative Rotation Graphs. On the weekly RRG for sectors, I note three that are rotating back into the leading quadrant. And when these sectors are outperforming,...
READ MORE