MEMBERS ONLY
Rebalancing a Portfolio is Important
by Julius de Kempenaer,
Senior Technical Analyst, StockCharts.com
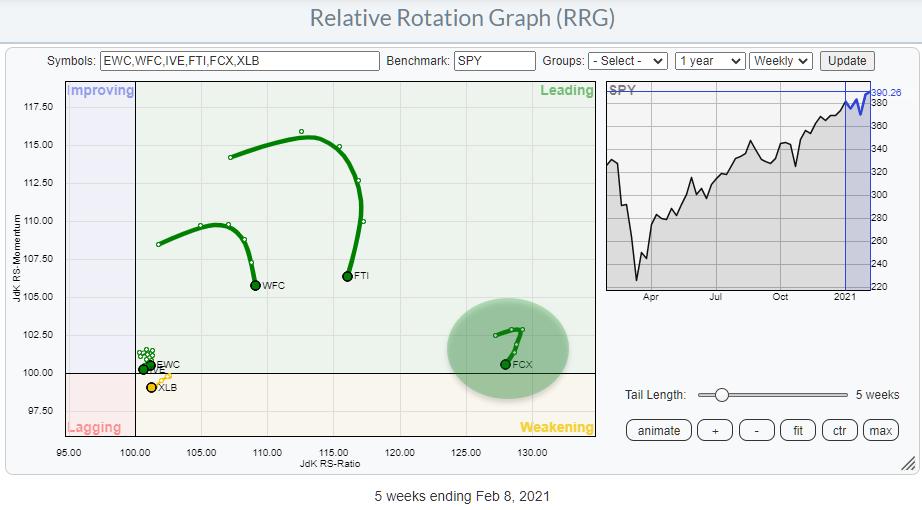
Good money management can help you a great deal in managing portfolios. Rebalancing is a very important part of that discipline. In this article, I am reviewing the current RRG Long/Short basket, replacing XLB and FTI with EBAY and MSFT while at the same time bringing all positions back...
READ MORE
MEMBERS ONLY
EBAY Popping to New High and Unlocking More Upside Potential
by Julius de Kempenaer,
Senior Technical Analyst, StockCharts.com
One of my routines to gauge the current market action is to start at the StockCharts.com Dashboard and take a look at the Market Movers - Most Active for the S&P 500. The link at the bottom left of that widget allows me to open up the...
READ MORE
MEMBERS ONLY
Sector Spotlight: Stealth Rotation for Healthcare
by Julius de Kempenaer,
Senior Technical Analyst, StockCharts.com
In this edition of StockCharts TV's Sector Spotlight, I attack the monthly charts to monitor the long-term trends that are in play. With this knowledge, I then build this into a "view" using the investment pyramid that covers the market from asset classes all the way...
READ MORE
MEMBERS ONLY
US Stocks are Lagging the World, and a Clear Preference for Short-Dated Bonds
by Julius de Kempenaer,
Senior Technical Analyst, StockCharts.com
In today's episode of Sector Spotlight, I cover, or at least try to, the complete investment landscape from asset allocation, all the way down to stocks at sector level.
With the monthly bars for January just completed, I stuck to my guns, looking at the long-term trends on...
READ MORE
MEMBERS ONLY
Finding Winners in a Pool of Mud
by Julius de Kempenaer,
Senior Technical Analyst, StockCharts.com
At the start of this week in my weekly StockCharts TV show Sector Spotlight, I discussed the re-emerging strength of Consumer Discretionary and Technology stocks.
In the second half of the week, markets started to shift a bit and, as usual, the question is whether this down move, which we...
READ MORE
MEMBERS ONLY
Sector Spotlight: AMZN Ready to Lead Rotation
by Julius de Kempenaer,
Senior Technical Analyst, StockCharts.com
In this edition of StockCharts TV's Sector Spotlight, I look at current rotations in asset classes and sectors and highlight some changes in relative movements against the S&P 500 index. After the break, I bring up my 3-D visualization of (sector) seasonality and see if any...
READ MORE
MEMBERS ONLY
(Big) Tech is Back on Track
by Julius de Kempenaer,
Senior Technical Analyst, StockCharts.com
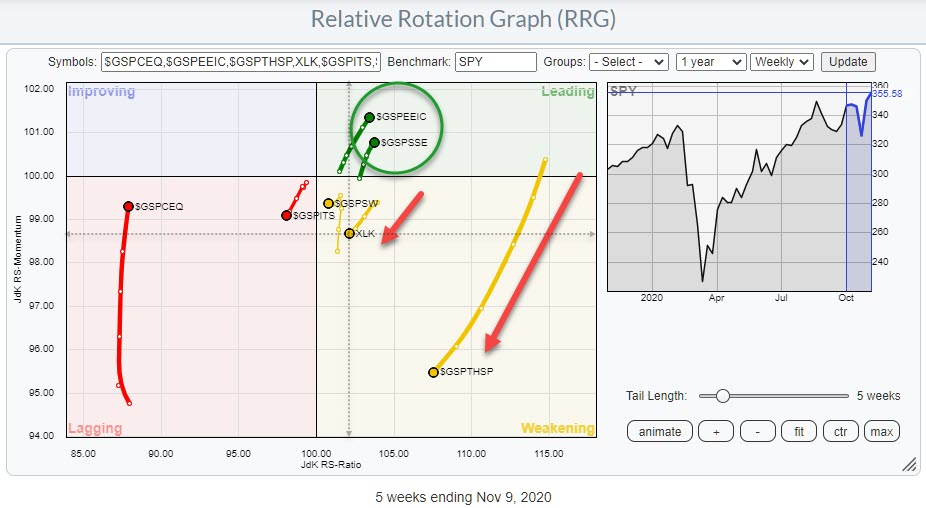
The Relative Rotation Graph for US sectors shows an interesting clustering of sectors close to the benchmark at the start of this week. I have highlighted this cluster in the RRG above.
The chart below zooms in on those three sectors that are more or less overlaid on each other...
READ MORE
MEMBERS ONLY
Breaking the Dow(n)... in Theory
by Julius de Kempenaer,
Senior Technical Analyst, StockCharts.com
The most widely followed Dow Jones index is the Dow Jones Industrials Average. But, in reality, this is only one of three averages that make up the Dow Jones Composite average.
The other two are the Dow Jones Transportation and the Dow Jones Utility averages.
The RRG above shows the...
READ MORE
MEMBERS ONLY
Sector Spotlight: Core Satellite Approach with RRG
by Julius de Kempenaer,
Senior Technical Analyst, StockCharts.com
In this edition of StockCharts TV's Sector Spotlight, I highlight the rotations of last week and zoom in on a few sectors to put things in a slightly longer perspective. After the break, I answer two questions from the mailbag, explaining how you can find the symbols covering...
READ MORE
MEMBERS ONLY
RRG Basket Update: Swapping SEE & INTC for EWC & COST
by Julius de Kempenaer,
Senior Technical Analyst, StockCharts.com
In today's episode of Sector Spotlight, I promised, time permitting, to have at least one change in the RRG L/S basket that I am maintaining in the show and my blogs. Obviously, time did not permit me to cover it during the show, so I am writing...
READ MORE
MEMBERS ONLY
The World is Outperforming the US
by Julius de Kempenaer,
Senior Technical Analyst, StockCharts.com
Relative Rotation Graphs, or RRGs, can help you get a better view of the big picture.
One of the RRGs I often use to get a handle on international developments on stock markets around the world is to pull up the Relative Rotation Graph for international stock market indexes, as...
READ MORE
MEMBERS ONLY
Brazil is Beating the US! (and We're Not Talking About Soccer...)
by Julius de Kempenaer,
Senior Technical Analyst, StockCharts.com
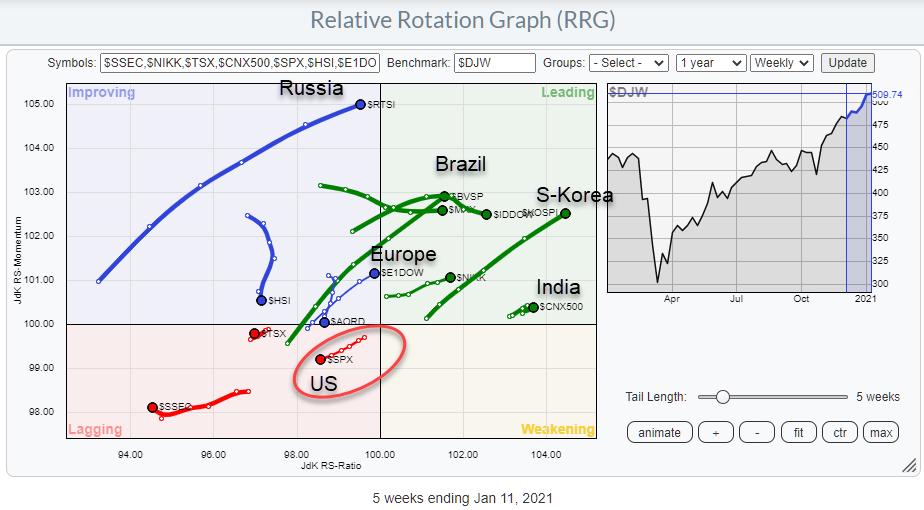
One of the Relative Rotation Graphs that I like to keep an eye, in order to monitor the bigger picture, is the RRG that shows the rotations for international stock market indexes against the DJ Global index, as shown above.
What we see here is a cluster of markets inside...
READ MORE
MEMBERS ONLY
Sector Spotlight: Energy & Financials Beating SPY
by Julius de Kempenaer,
Senior Technical Analyst, StockCharts.com
In this edition of StockCharts TV's Sector Spotlight, I talk you through the recent rotations in asset classes and US sectors, then look at growth vs value rotation, as well as the rotation of the US vis-a-vis international stock markets. After the break, I dive into the current...
READ MORE
MEMBERS ONLY
Value Starts to Accelerate Away from Growth
by Julius de Kempenaer,
Senior Technical Analyst, StockCharts.com
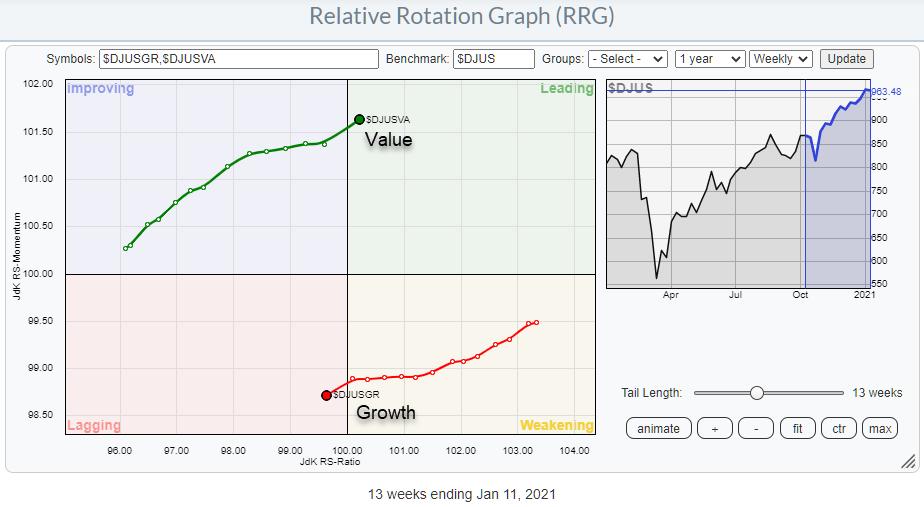
This week, the tails for Growth and Value are crossing over. Value is moving into the leading quadrant while Growth crosses from weakening into lagging.
This rotation has been going on for quite some time already and was picked up by the RRG Lines and the rotation of the tails...
READ MORE
MEMBERS ONLY
CF Industries Confirms Uptrend as it Moves Into Leading Quadrant on RRG
by Julius de Kempenaer,
Senior Technical Analyst, StockCharts.com
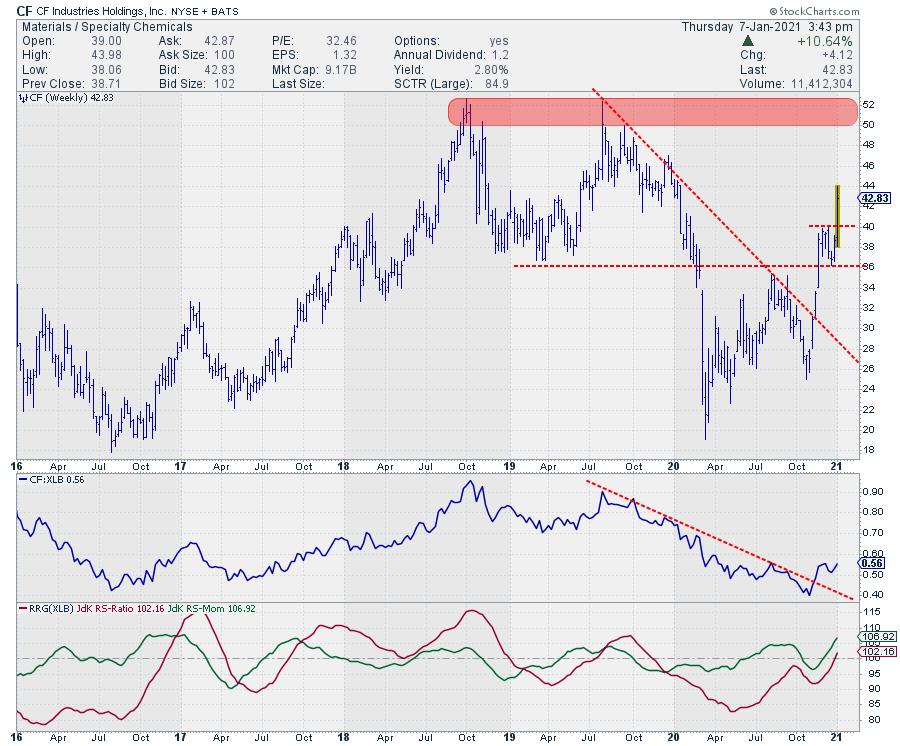
On the weekly RRG, XLB is inside weakening but rotating back towards the leading quadrant. On the daily RRG, XLB is pushing rapidly into leading from improving. This alignment makes the sector very interesting to watch in the coming days/weeks.
It is one of the seven sectors that are...
READ MORE
MEMBERS ONLY
Seasonality is Nice but Reality Rules
by Julius de Kempenaer,
Senior Technical Analyst, StockCharts.com
Happy New Year!!!
Those of you who watch my weekly show Sector Spotlight on StockCharts TV will know that, towards the end of every month, I look at the seasonality for sectors going into the new month and then try to combine that with the actual rotations that are taking...
READ MORE
MEMBERS ONLY
Sector Spotlight: 7 Sectors in Monthly Uptrends
by Julius de Kempenaer,
Senior Technical Analyst, StockCharts.com
In this edition of StockCharts TV's Sector Spotlight, I take a look at the rotations that took place in Asset Classes and Sectors during the last two weeks of December. After the break, I dive into the long-term trends for those asset classes and sectors using monthly charts....
READ MORE
MEMBERS ONLY
Financials En-Route For a Strong Start in 2021
by Julius de Kempenaer,
Senior Technical Analyst, StockCharts.com
My first article for the Chartwatchers newsletter going into the new year... 2021!!
First of all, I wish all readers and watchers of Sector Spotlight a very happy and, above all, healthy new year. That "Healthy" part all of a sudden has gotten a whole new meaning after...
READ MORE
MEMBERS ONLY
Sector Spotlight: Using RRG Top-Down
by Julius de Kempenaer,
Senior Technical Analyst, StockCharts.com
In this edition of StockCharts TV's Sector Spotlight, I work my way down the investment pyramid and show how I use RRG as a tool to get from Asset Allocation all the way down to individual stocks to build a portfolio. You should be able to pick and...
READ MORE
MEMBERS ONLY
Sector Spotlight: How CB3 Uses RRG in Portfolio Management
by Julius de Kempenaer,
Senior Technical Analyst, StockCharts.com
In this edition of StockCharts TV's Sector Spotlight, I interview Charles Brown of CB3 Financial. Charles is an early adopter and long time user of Relative Rotation Graphs, which he actively promotes and uses in the investment process that he uses to manage his client portfolios.
This video...
READ MORE
MEMBERS ONLY
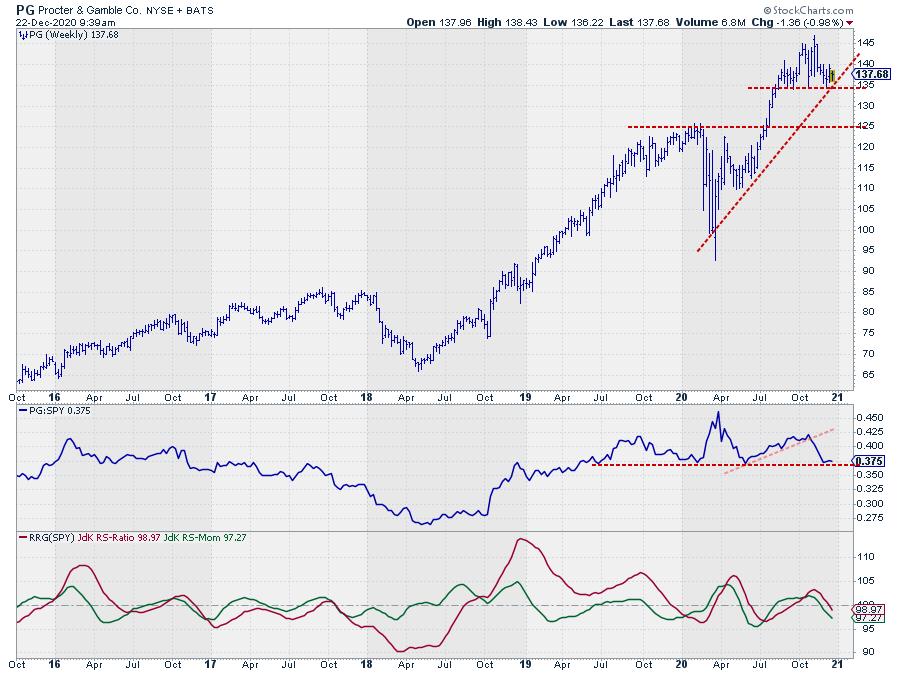
PG is Ready to GO..... !
by Julius de Kempenaer,
Senior Technical Analyst, StockCharts.com
Into the lagging quadrant on the RRG and to the short side of the RRG Long/Short baskets.
Before diving into the PG chart, let's go over the current symbols on both lists. At the moment, both the Long and the Short basket have six names in them....
READ MORE
MEMBERS ONLY
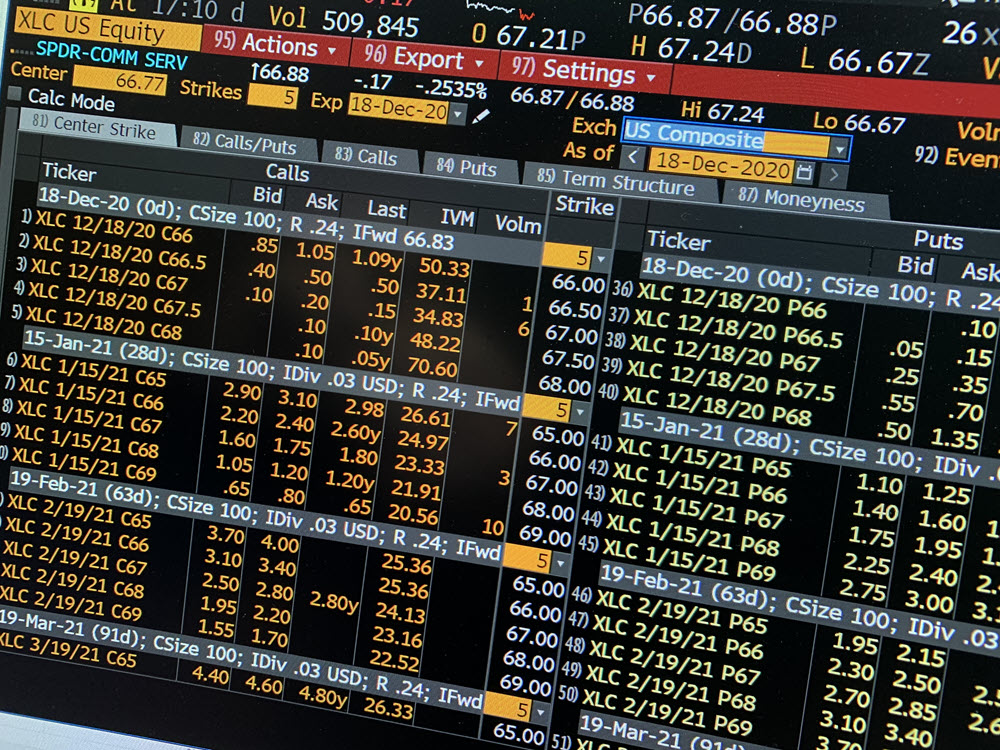
Getting Your Options Right Around Communication Services
by Julius de Kempenaer,
Senior Technical Analyst, StockCharts.com
Over the last weeks, the Communication Services sector continued to improve and recently moved back into the leading quadrant after rotating through weakening and, very briefly, through lagging. This rotation, especially the increase in RRG-Velocity (the distances between the week-to-week observations), make XLC an interesting sector to keep your eyes...
READ MORE
MEMBERS ONLY
It's All About Da Base......
by Julius de Kempenaer,
Senior Technical Analyst, StockCharts.com
With Bitcoin up around 10% and breaking beyond $20k, there can only be one chart today that should not be ignored.
BTC moved back to the forefront of financial markets and press recently. Dave Keller recently wrote about it and sent out this tweet (to the right) today. And I...
READ MORE
MEMBERS ONLY
Sector Spotlight: Performance and Trends in Performance
by Julius de Kempenaer,
Senior Technical Analyst, StockCharts.com
In this edition of StockCharts TV's Sector Spotlight, I review last week's rotations for asset classes and sectors, then answer questions from the mailbag. I explain the difference between outright performance and "trends in performance" and discuss potential entry points using Relative Rotation Graphs....
READ MORE
MEMBERS ONLY
Four RRGs That Give You a Clear Overview of What is Going On in the Markets
by Julius de Kempenaer,
Senior Technical Analyst, StockCharts.com
Asset Classes
Starting at Asset Class level, the first Relative Rotation Graph shows the rotation of various asset classes (ETFs) against VBINX (the benchmark).
The relationship that stands out here is the very clear preference for stocks. It is the only tail that is inside the leading quadrant. As an...
READ MORE
MEMBERS ONLY
MTB is Ready to Break Resistance and Push Into The Leading Quadrant
by Julius de Kempenaer,
Senior Technical Analyst, StockCharts.com
On the weekly Relative Rotation Graph for US sectors, the Financial sector is gradually improving more and more, with the tail having just crossed over into the leading quadrant.
Zooming in on the RRG for the constituents of the Financial sector against XLF, we see a high concentration of banking...
READ MORE
MEMBERS ONLY
Sector Spotlight: Stocks Massively Beating Bonds
by Julius de Kempenaer,
Senior Technical Analyst, StockCharts.com
In this edition of StockCharts TV's Sector Spotlight, I spend a big part of the show going over the (completed) monthly (bar-) charts for November, in order to get a handle on the long-term trends that are in play for both asset classes and sectors. In particular, the...
READ MORE
MEMBERS ONLY
(When) Will we See $40k in Bitcoin?
by Julius de Kempenaer,
Senior Technical Analyst, StockCharts.com
Bitcoin and, more broadly, cryptocurrencies, are back to the forefront of financial markets. A lot of new participants are entering the crypto-space and they are all looking to get a piece of the bitcoin-pie.
So what can we learn from the Bitcoin chart when we want to get an idea...
READ MORE
MEMBERS ONLY
What's with Gold?
by Julius de Kempenaer,
Senior Technical Analyst, StockCharts.com
The Relative Rotation Graph for Commodities shows the tail for precious metals deep inside the lagging quadrant and recently bending towards the left again after a few weeks of picking up relative momentum. This makes precious metals the weakest group in the universe.
Watching such a rotation on the tail...
READ MORE
MEMBERS ONLY
Sector Spotlight: Strong Performance for XLC in December
by Julius de Kempenaer,
Senior Technical Analyst, StockCharts.com
In this edition of Sector Spotlight, I kick off by walking viewers through last week's performances and rotations on the Relative Rotation Graphs for Asset Classes and US sectors. After the break, I put these rotations in a bigger perspective and bring in seasonality for the month of...
READ MORE
MEMBERS ONLY
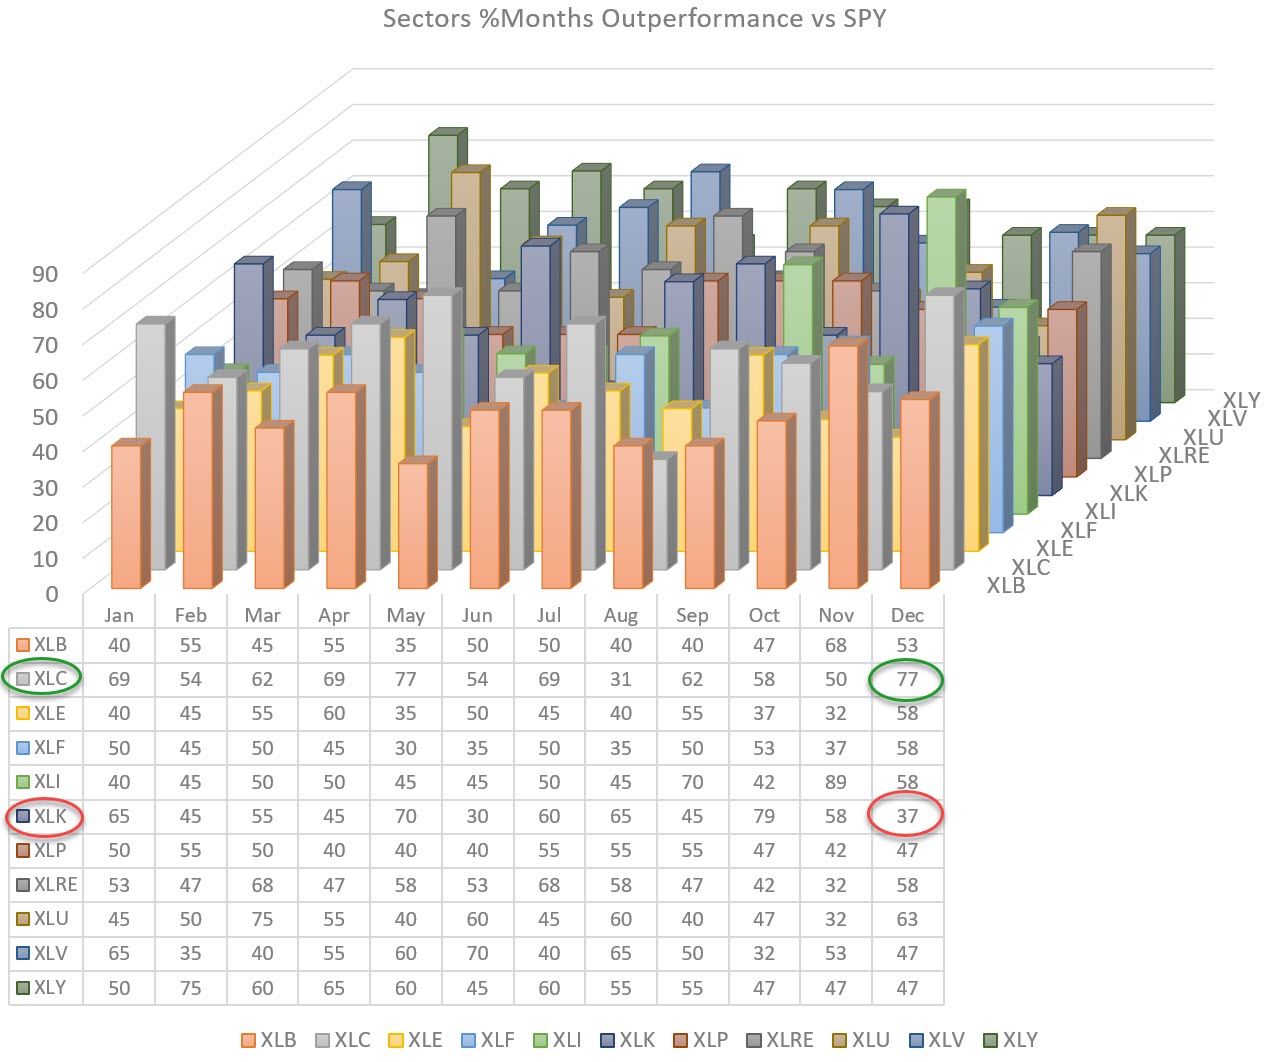
Seasonality Points to a Strong Month of December for XLC
by Julius de Kempenaer,
Senior Technical Analyst, StockCharts.com
The chart above shows the seasonality for all US sectors relative to the S&P 500 index. The numbers in the table are the percentages of time in history (20 years when available) where a sector outperformed the S&P.
For the coming month of December, two sectors...
READ MORE
MEMBERS ONLY
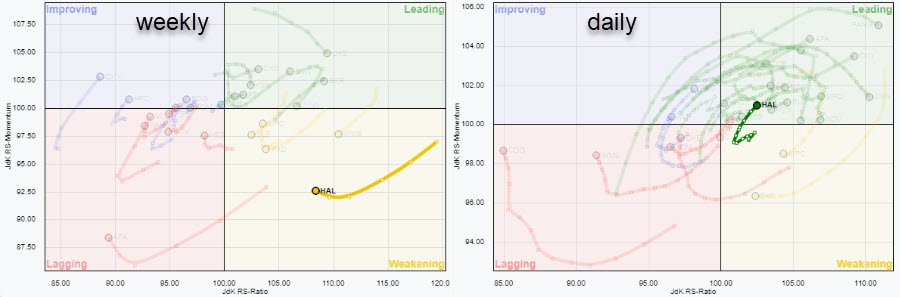
RRG is Picking Up Turnaround in HAL
by Julius de Kempenaer,
Senior Technical Analyst, StockCharts.com
With returns in the Energy sector flying off the charts, I want to track developments in individual stocks within the sector closely. This is particularly true because the rotation of the sector on the weekly Relative Rotation Graph is still not very strong.
The weekly tail on XLE is shown...
READ MORE
MEMBERS ONLY
Sector Spotlight: Equal Weight vs. Cap Weight Rotations
by Julius de Kempenaer,
Senior Technical Analyst, StockCharts.com
In this edition of Sector Spotlight, I walk viewers through the current state of asset class and sector rotations. After that, I zoom in, using the Relative Rotation Graphs of Equal weight and Cap weighted sectors side by side in order to spot differences or anomalies that can help us...
READ MORE
MEMBERS ONLY
Financial Stocks Showing Strength on Relative Rotation Graph as Dow Hits 30k
by Julius de Kempenaer,
Senior Technical Analyst, StockCharts.com
The Financial sector has been picking up a lot of relative strength recently.
On the Relative Rotation Graph for US sectors (against SPY), XLF is on a rotation trail through the improving quadrant and closing in on a cross over into the leading quadrant. Where JdK RS-Momentum was slightly lower...
READ MORE
MEMBERS ONLY
Sometimes You Need to Change Lanes to Stay on the Right Track
by Julius de Kempenaer,
Senior Technical Analyst, StockCharts.com
When I was preparing for last week's episode of Sector Spotlight and writing an article for the RRG Blog on the Growth/Value Rotation, I had to think back to an article that I wrote for this newsletter back in August.
The title for this article was "...
READ MORE
MEMBERS ONLY
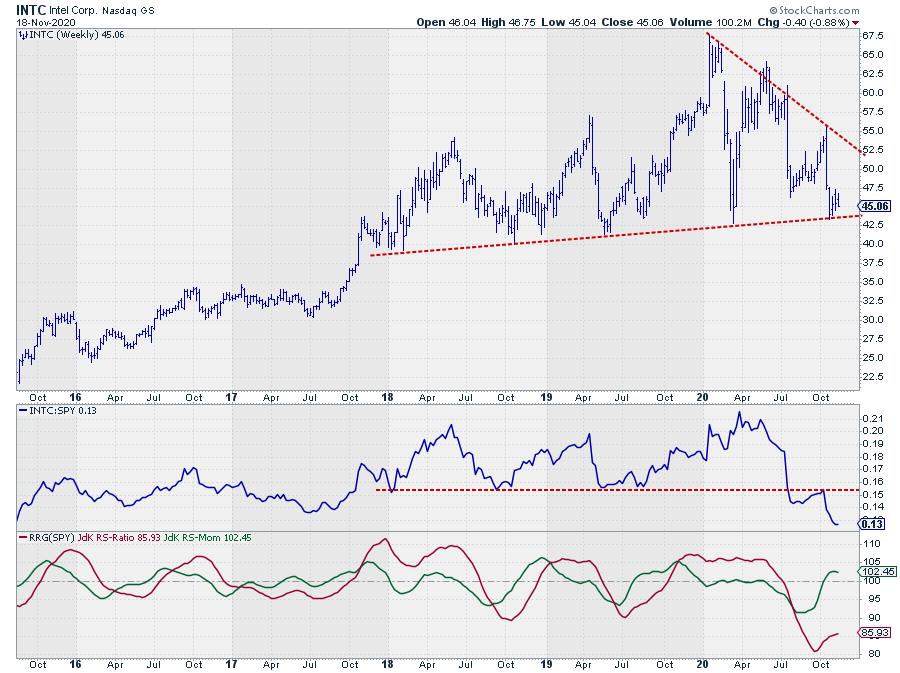
INTC at Risk for a Violent Move Lower
by Julius de Kempenaer,
Senior Technical Analyst, StockCharts.com
On the Relative Rotation Graph for Technology stocks (XLK), the tail on INTC stands out - but not in a positive way.
INTC is positioned inside the improving quadrant after a recovery in relative momentum (JdK RS-Momentum), but recently started to roll over again, while still being the technology stock...
READ MORE
MEMBERS ONLY
Adding FB As a Short to RRG Long/Short Basket Trade Ideas
by Julius de Kempenaer,
Senior Technical Analyst, StockCharts.com
From time to time, I discuss possible long or short positions (stocks, ETFs) based on observations on Relative Rotation Graphs or ideas generated from them.
Currently, the baskets contain five positions each. Below, I will review all positions and come up with a few proposed changes to the mix.
Long...
READ MORE
MEMBERS ONLY
Sector Spotlight: Rotation OUT of Large-Caps
by Julius de Kempenaer,
Senior Technical Analyst, StockCharts.com
In this edition of Sector Spotlight, I look at the performances for asset classes and sectors last week, noticing long tails on those daily RRGs - that indicates some big moves that have taken place. Following the lookback using daily RRGs, I move on to some weekly charts for stocks,...
READ MORE
MEMBERS ONLY
A Closer Look at the Growth to Value Rotation - There is More To It Than Meets the Eye...
by Julius de Kempenaer,
Senior Technical Analyst, StockCharts.com
There is a lot of talk lately regarding the Growth to Value rotation that seems to be going on. And if you look at the surface, that is certainly true, but there is more to it than meets the eye...
The Relative Rotation Graph below visualizes this rotation and shows...
READ MORE
MEMBERS ONLY
Forget about AAPL! What is Happening Under the Hood of Rotation Out of Technology?
by Julius de Kempenaer,
Senior Technical Analyst, StockCharts.com
The flow of money out of the Technology sector is clearly visible on the Relative Rotation Graph for US sectors, and it is an observation that has made by many market commentators recently. What I want to do in this article is look under the hood of the technology sector...
READ MORE