MEMBERS ONLY
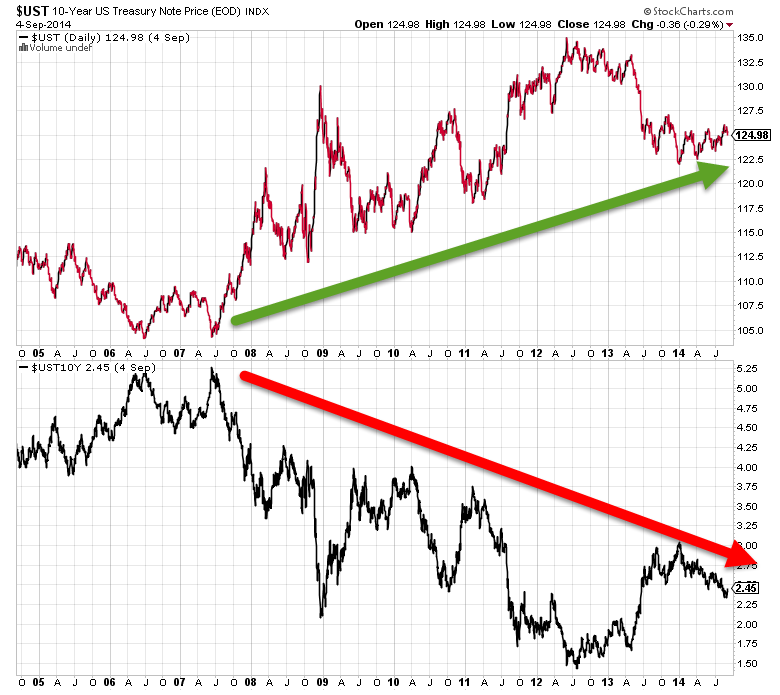
Still RISK ON for Asset Allocation ?
by Julius de Kempenaer,
Senior Technical Analyst, StockCharts.com
Wow...! What a difference a month makes .... I had lunch with Arthur Hill yesterday in Breda (the Netherlands) which is halfway where he lives in Belgium and where I live in the Netherlands (Amsterdam). Obviously the discussion was mainly about the freaky market move we have seen in October. At...
READ MORE
MEMBERS ONLY
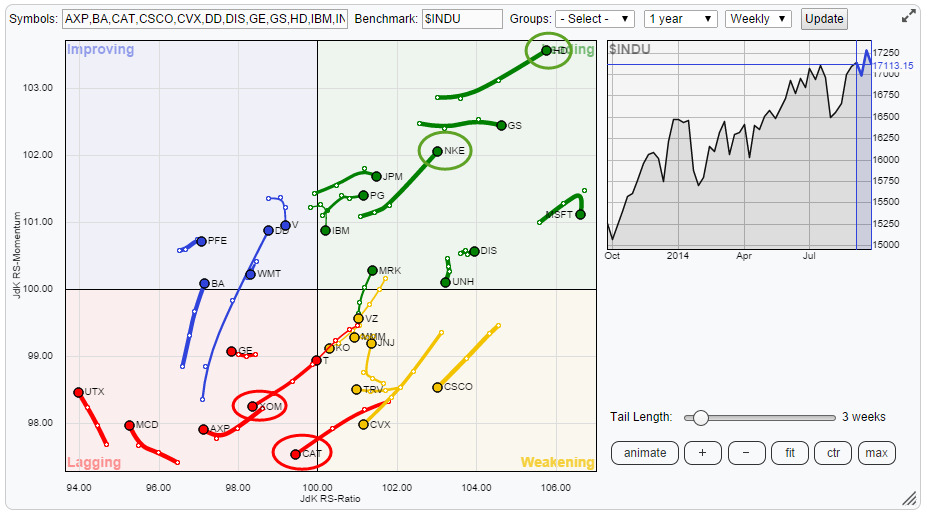
Boeing on final approach for landing at "lagging" runway
by Julius de Kempenaer,
Senior Technical Analyst, StockCharts.com
The Relative Rotation Graph below shows the members of the Dow Jones Industrials index with that same index acting as the benchmark. As all members of the benchmark universe are present on the plot we call this a "closed universe".
Open and Closed RRG-charts
On a RRG...
READ MORE
MEMBERS ONLY
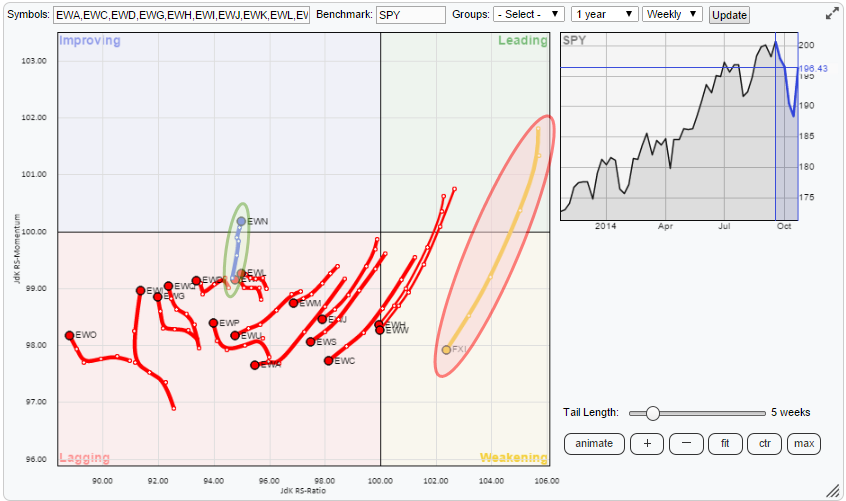
US Equities remain firmly in the lead
by Julius de Kempenaer,
Senior Technical Analyst, StockCharts.com
The landscape for international equities continues to show a rotation out of Emerging Markets into more developed markets. At least that is the big picture. There are a few ways that we can use to approach this equity universe and I will use three different relative rotation graphs in this...
READ MORE
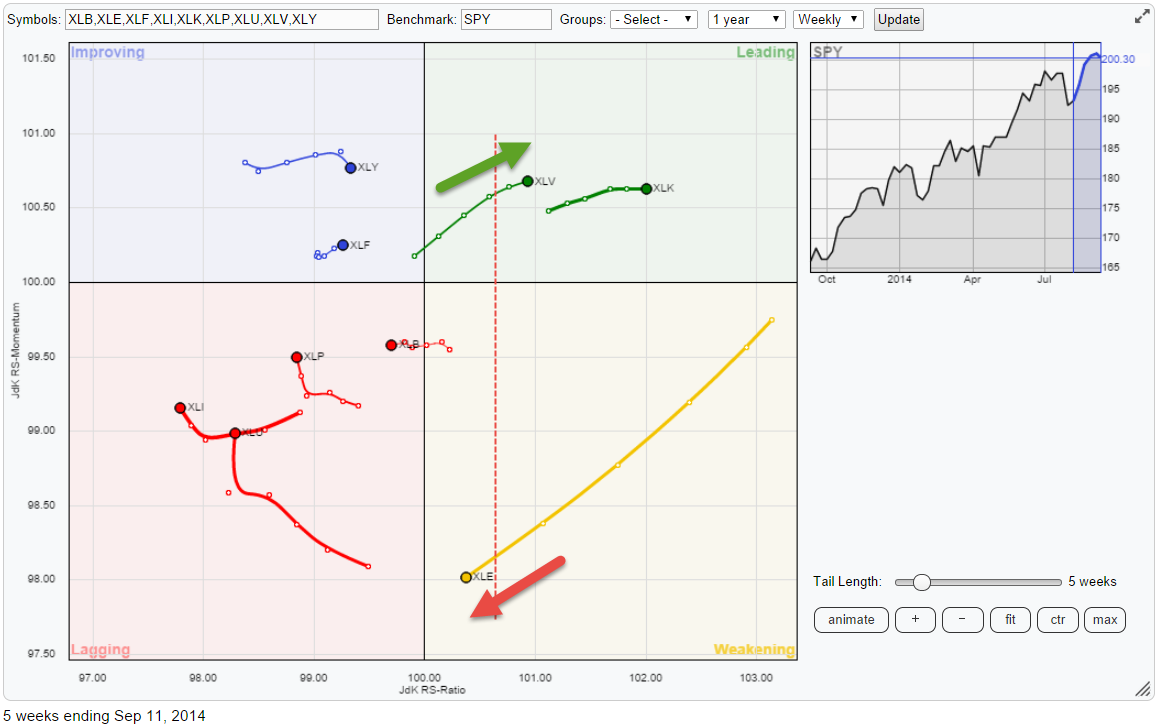
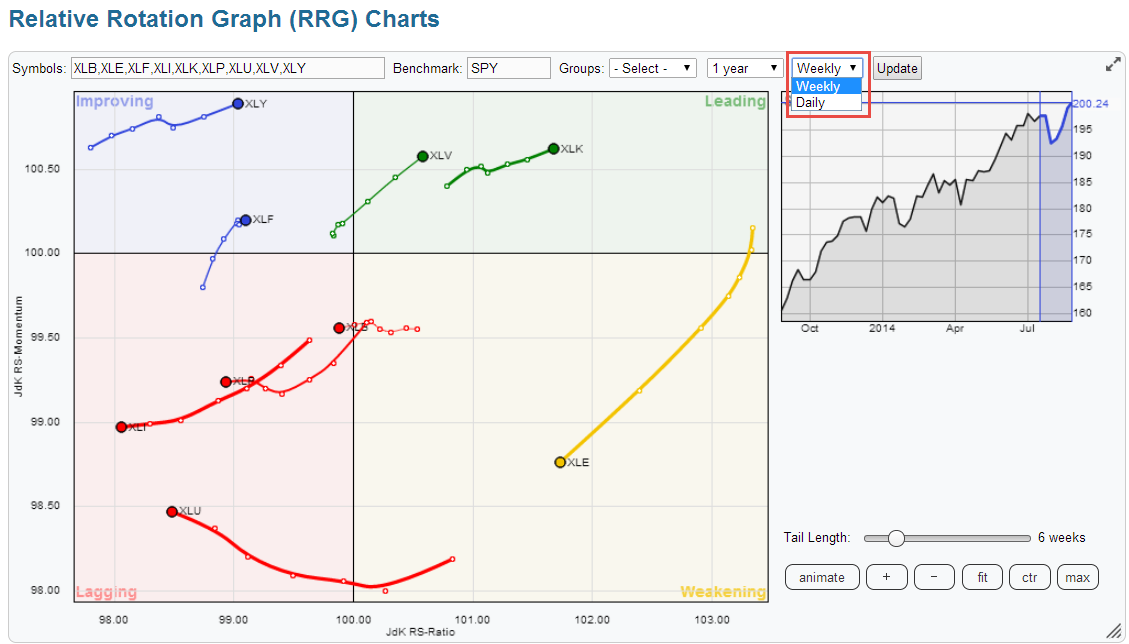
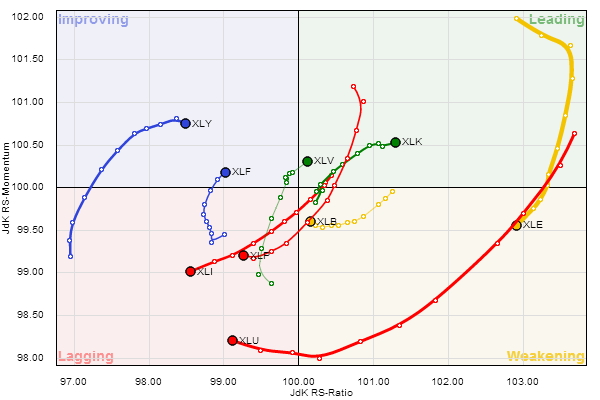
MEMBERS ONLY
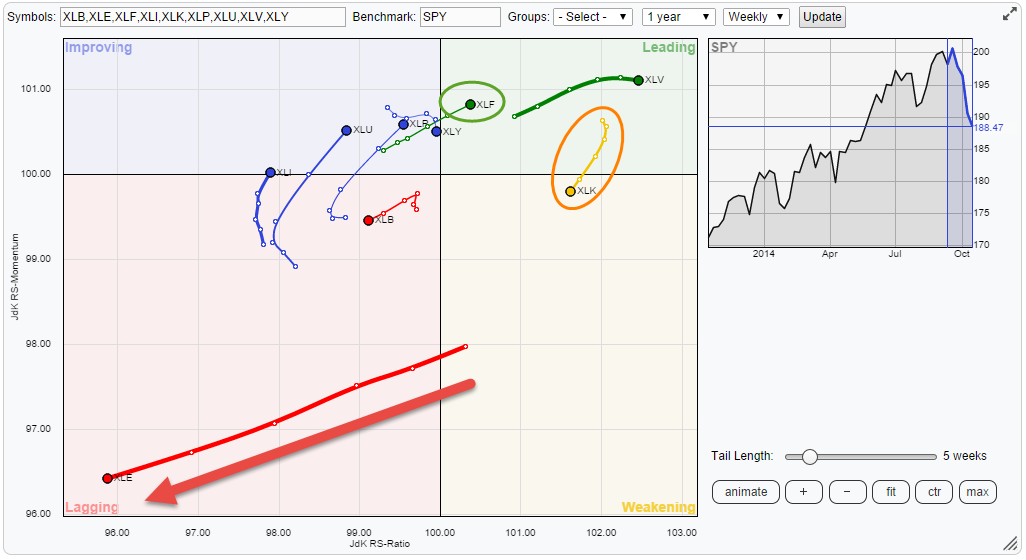
Energy continues weakness but Financials rotating into leading quadrant
by Julius de Kempenaer,
Senior Technical Analyst, StockCharts.com
Printed below is the weekly Relative Rotation Graph(tm) of the nine S&P sector ETFs against SPY. The clear eye-catcher on this picture is the move of XLE (Energy) deep inside the lagging quadrant and still heading deeper into it. The second observation is that the strong...
READ MORE
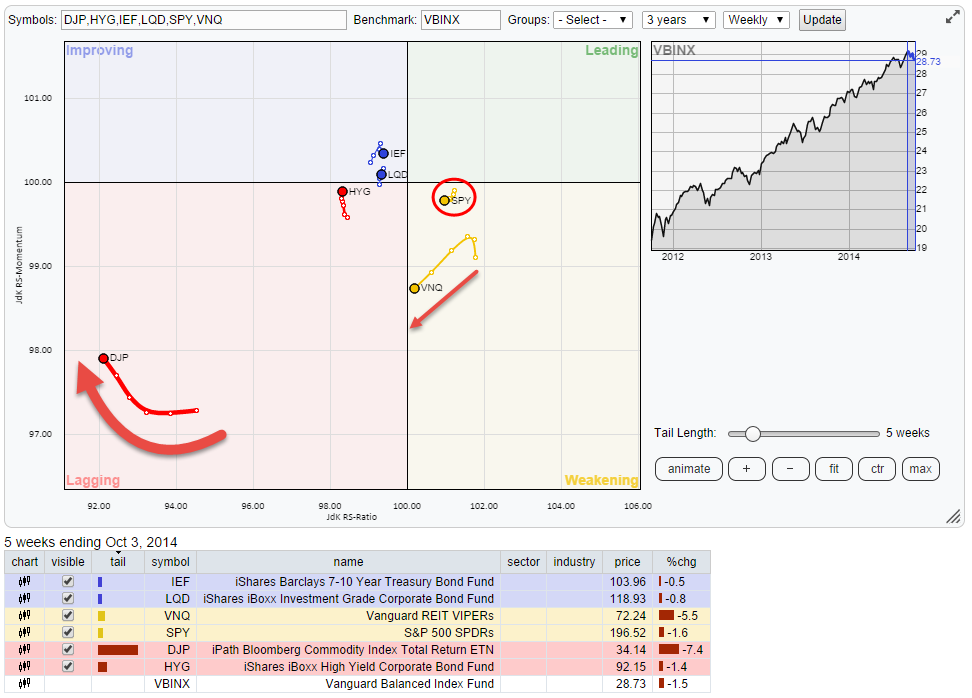
MEMBERS ONLY
Commmmmmodities and Real(ly weak)-Estate
by Julius de Kempenaer,
Senior Technical Analyst, StockCharts.com
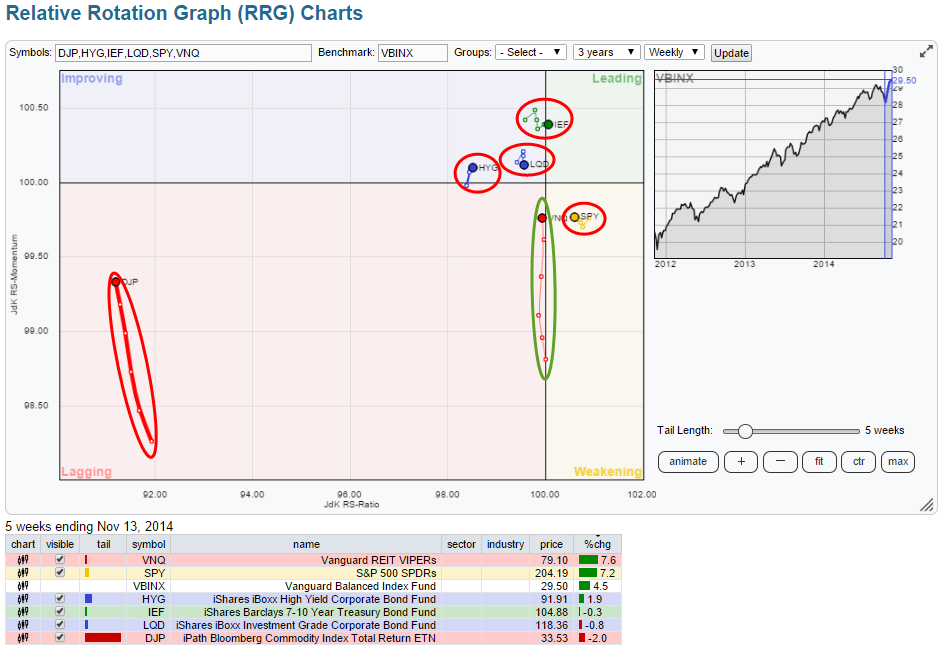
On the Relative Rotation Graph holding a number of, indices representing various, Asset Classes there are two that are standing out and deserve our attention. The first one is Commodities and the second one is Real-Estate. The graph below shows the weekly RRG chart for asset classes with a...
READ MORE
MEMBERS ONLY
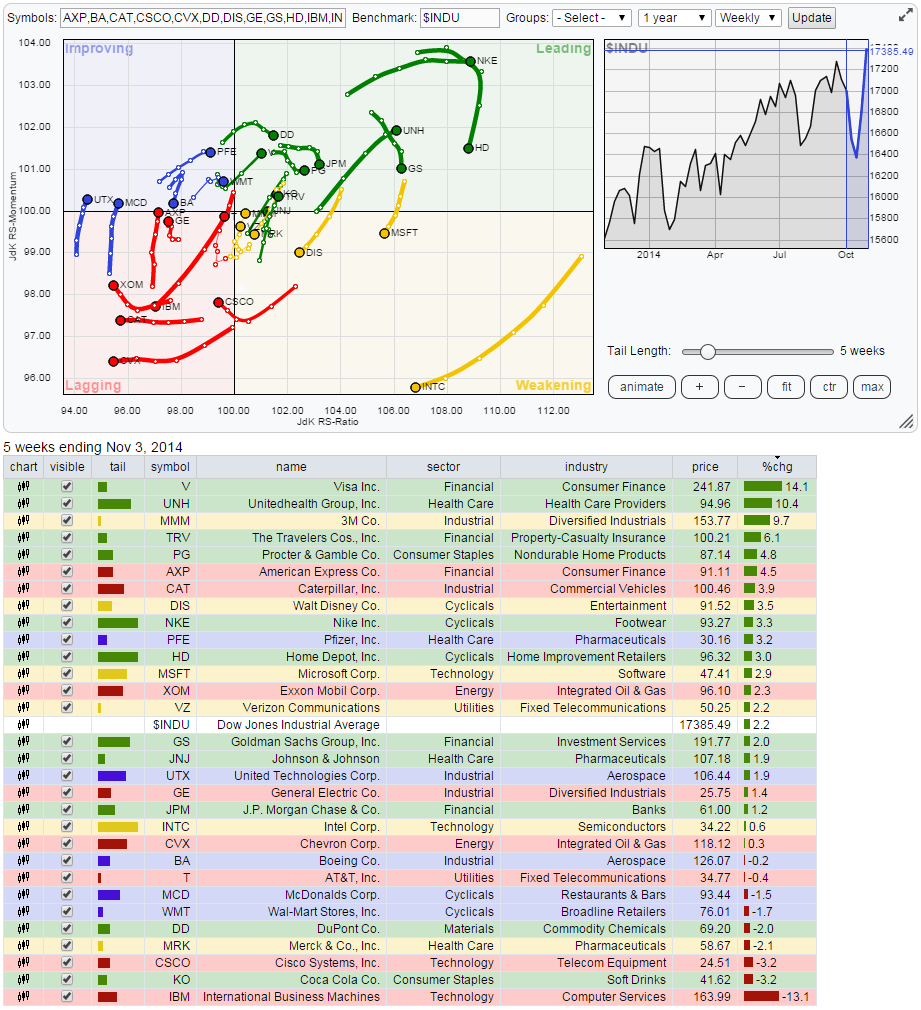
Single stock rotation within $INDU
by Julius de Kempenaer,
Senior Technical Analyst, StockCharts.com
In previous posts I have been looking at asset classes, sectors, countries etc. In this post I am going to throw the 30 constituents of the Dow Jones Industrials index ($INDU) at a Relative Rotation Graph and also look for confirmation between weekly and daily time-frames.
When you open...
READ MORE
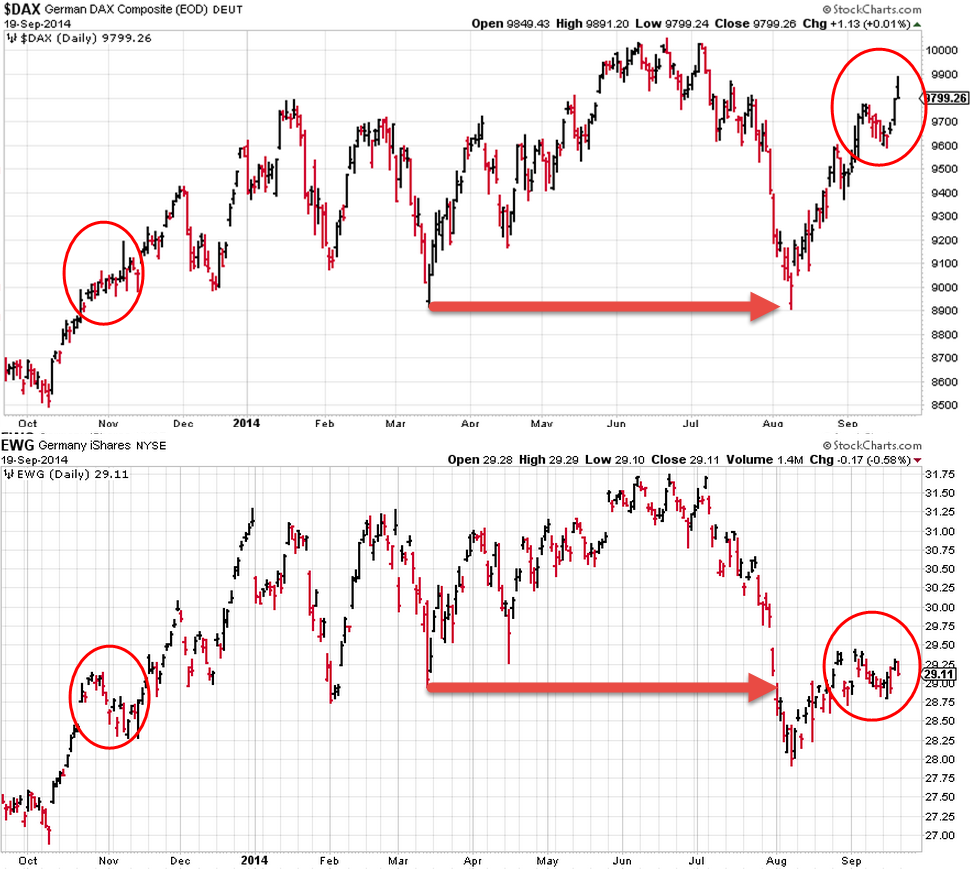
MEMBERS ONLY
International equity market rotation on Relative Rotation Graphs(tm)
by Julius de Kempenaer,
Senior Technical Analyst, StockCharts.com
In a previous article we looked at using Relative Rotation Graphs for analyzing asset class rotation. One of the main caveats that was pointed out in that blog was to be very careful on what ticker symbols to use to construct the RRG with. Especially the mixture of yield series...
READ MORE
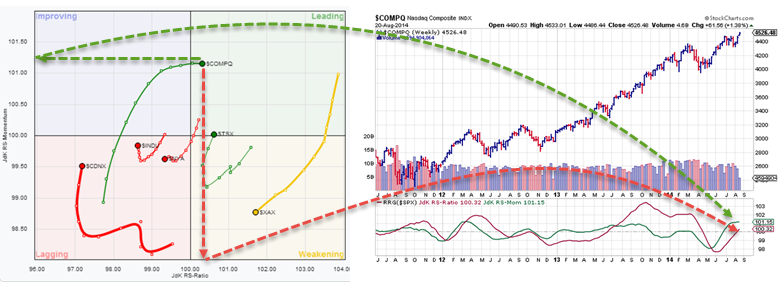
MEMBERS ONLY
Strong relative rotation for Health Care and Technology
by Julius de Kempenaer,
Senior Technical Analyst, StockCharts.com
The Relative Rotation Graph of the nine sector ETFs against the S&P 500 (SPY) is showing some clear and distinct rotations at the moment. Especially the right hand side of the plot where we find the sectors that are (still) in relative up-trends against the broader S&...
READ MORE
MEMBERS ONLY
Using RRG charts for Asset Allocation
by Julius de Kempenaer,
Senior Technical Analyst, StockCharts.com
One of the comments on my last article (daily data now available for RRG charts) mentioned using RRG charts in relation to monitoring different asset classes, which just happened to be the subject of this article that I was already working on when the comment came in.
"Can RRG...
READ MORE
MEMBERS ONLY
DAILY data now available for RRG charts
by Julius de Kempenaer,
Senior Technical Analyst, StockCharts.com
Until now Relative Rotation Graphs on StockCharts.com could only be rendered using weekly data-streams... Not any more! The early adapters and users who check in on RRGs on a daily basis may have seen the new addition already.
When you open up an RRG chart you will notice...
READ MORE
MEMBERS ONLY
Add RRG (Indicator) Lines to Your Price Charts
by Julius de Kempenaer,
Senior Technical Analyst, StockCharts.com
Relative Rotation Graphs, RRGs, are a wonderful tool to get a grip on the bigger picture of markets and the rotational movement of trends in relative strength across various instruments in a universe or a portfolio. However, this is only the beginning. Once you have detected something that could be...
READ MORE
MEMBERS ONLY
Just to get my feet wet, Industrials to Tech rotation working well
by Julius de Kempenaer,
Senior Technical Analyst, StockCharts.com
Accessing the RRG chart tool from the home page will bring up a number of major index as the default universe. The drop down box labelled "pre-defined" groups will show a number of, indeed just like the title says, pre defined groups for use on a Relative...
READ MORE
MEMBERS ONLY
RRG's Road to StockCharts.com
by Julius de Kempenaer,
Senior Technical Analyst, StockCharts.com
Editor's Note: Julius de Kempenaer is the creator of Relative Rotation Graphs ("RRGs"). He will be contributing regular articles to this blog about RRGs and how they can be used to improved your investing results. Welcome Julius!
As of last Saturday 19 July 2014 StockCharts.com...
READ MORE