MEMBERS ONLY
Sector Rotation Breakdown: Spotting Market Leaders Now
by Julius de Kempenaer,
Senior Technical Analyst, StockCharts.com
In this exclusive StockCharts video,Julius analyzes US sector rotation using Relative Rotation Graphs (RRG), starting with the 11 S&P sectors and breaking them into Offensive, Defensive, and Sensitive sectors to uncover unusual market rotations. He then dives into the Financials sector, identifying top stocks with potential for...
READ MORE
MEMBERS ONLY
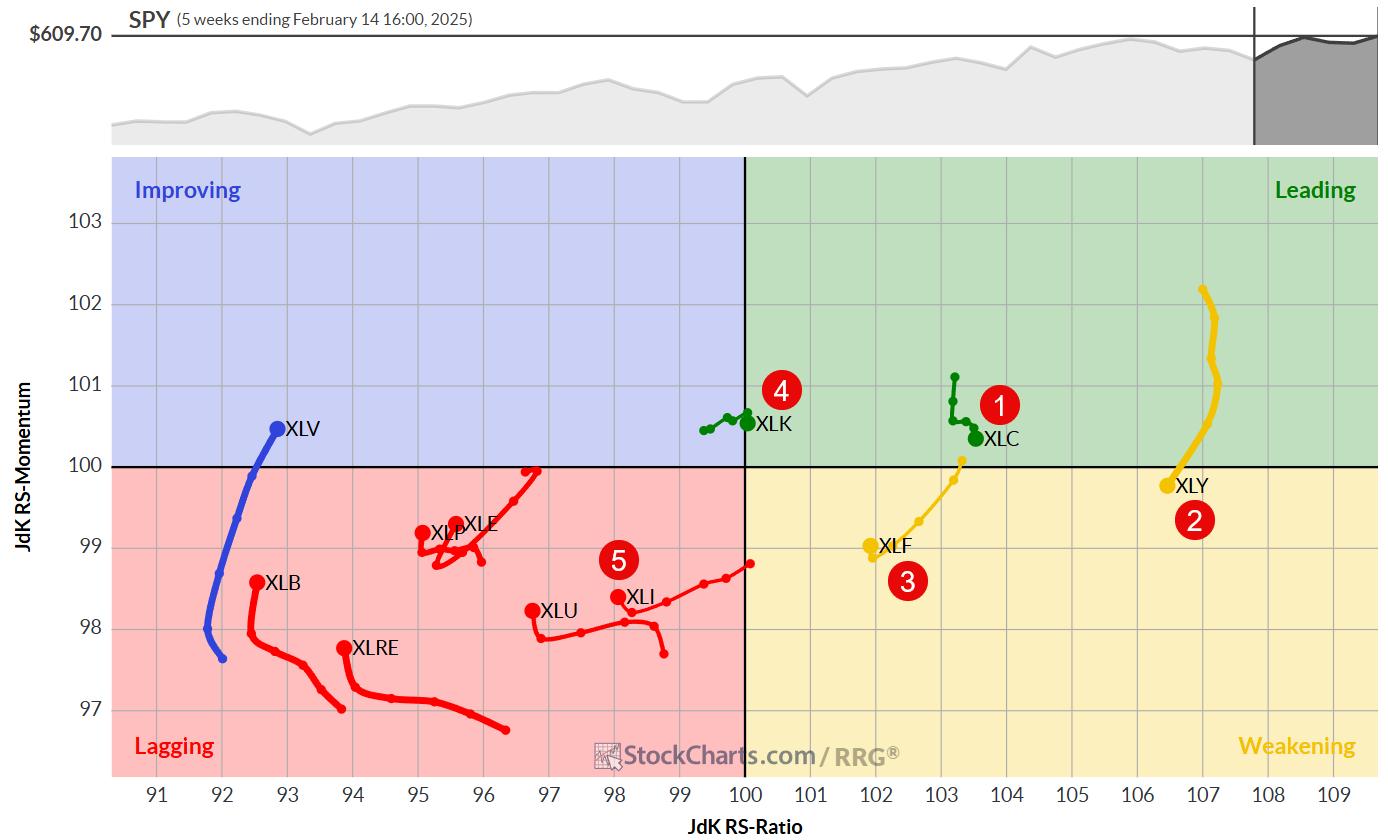
The Best Five Sectors, #10
by Julius de Kempenaer,
Senior Technical Analyst, StockCharts.com
KEY TAKEAWAYS
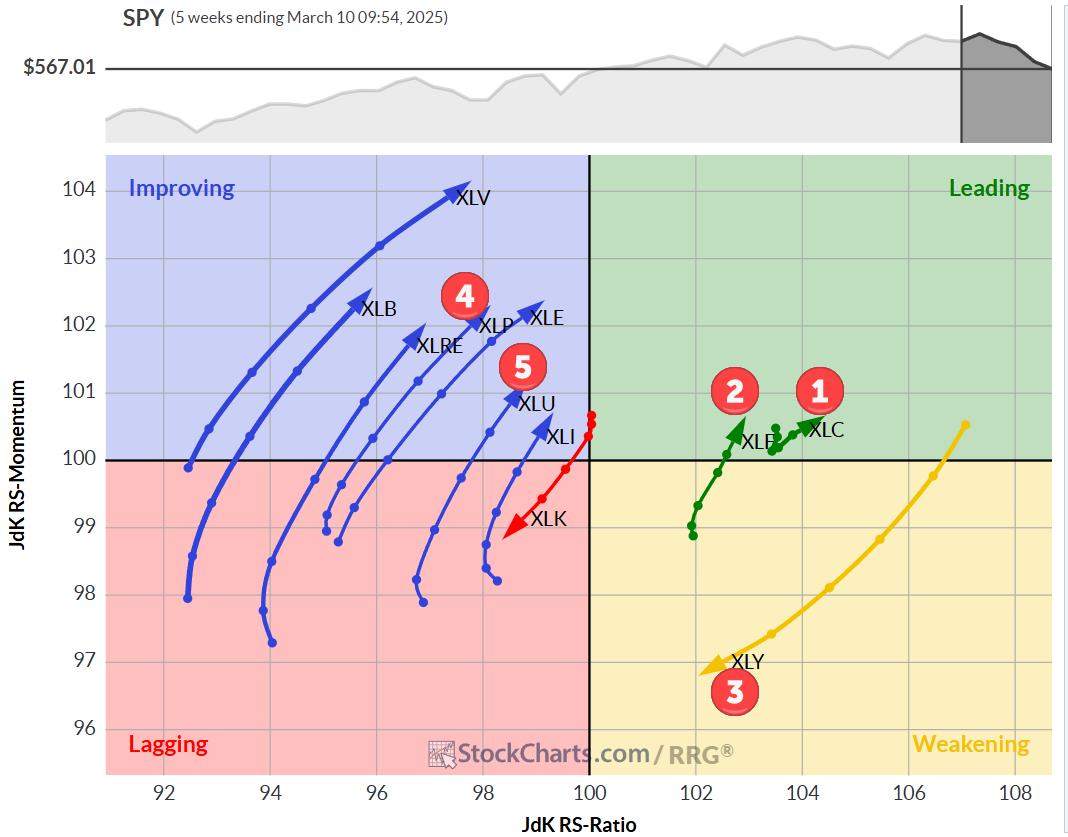
* Communication Services (XLC) maintains top spot, Tech (XLK) plummets
* Shift towards defensive sectors evident in rankings
* Consumer Discretionary (XLY) showing signs of weakness
* Portfolio slightly outperforming SPY benchmark
Sector Shake-Up: Defensive Moves and Tech's Tumble
Last week's market volatility stirred up the sector rankings,...
READ MORE
MEMBERS ONLY
Sector Rotation Warning: More Downside Ahead for US Markets?
by Julius de Kempenaer,
Senior Technical Analyst, StockCharts.com
In this exclusive StockCharts video,Julius analyzes sector rotation in US markets, assessing recent damage and potential downside risks. He examines the Equal Weight RSP vs. Cap-Weighted SPX ratio and the stocks vs. bonds relationship to identify key market trends. Don't miss this deep dive into market rotation...
READ MORE
MEMBERS ONLY
The Best Five Sectors, #9
by Julius de Kempenaer,
Senior Technical Analyst, StockCharts.com
KEY TAKEAWAYS
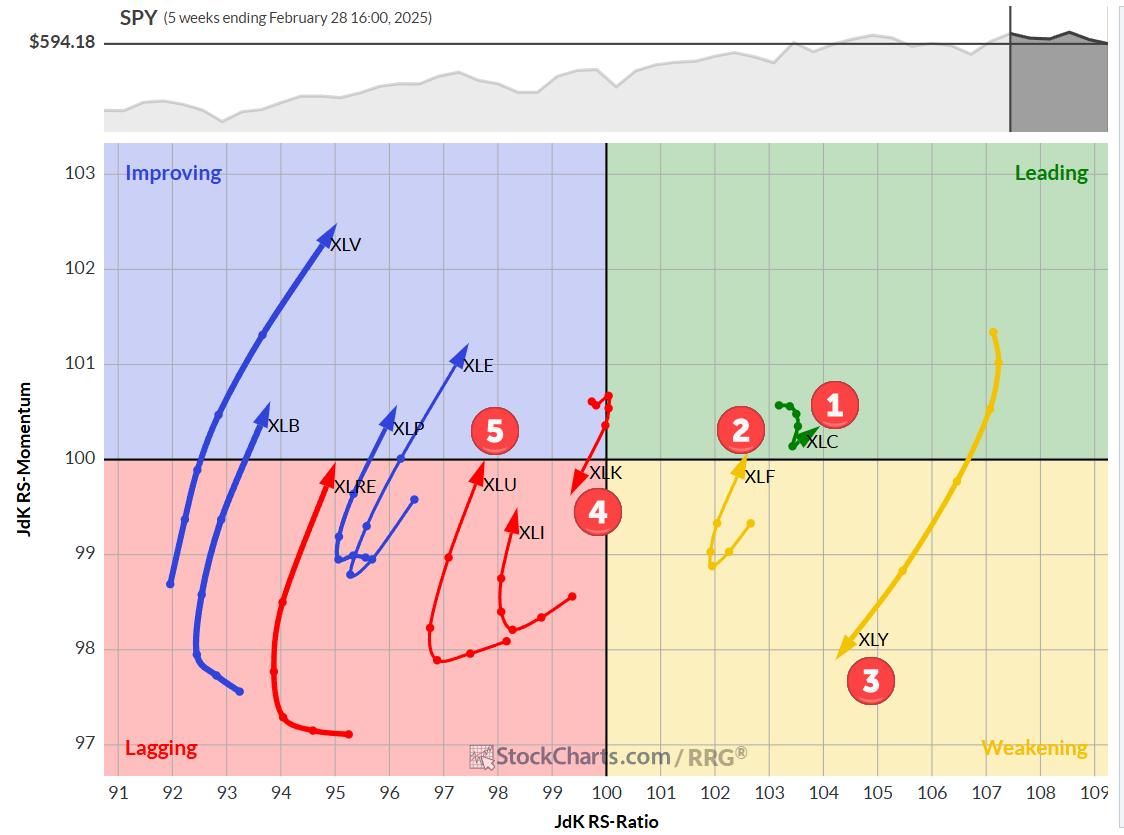
* Communication services maintains top spot in sector ranking.
* Financials moves up to #2, pushing consumer discretionary down to #3.
* Technology and utilities hold steady at #4 and #5 respectively.
* Portfolio performance now on par with benchmark after recent outperformance.
Sector Rotation: Financials Climb as Consumer Discretionary Slips
While...
READ MORE
MEMBERS ONLY
Sector Rotation & Seasonality: What's Driving the Market Now?"
by Julius de Kempenaer,
Senior Technical Analyst, StockCharts.com
In this exclusive StockCharts video,Julius analyzes seasonality for U.S. sectors and aligns it with current sector rotation. He explores how these trends impact the market (SPY) and shares insights on potential movements using RRG analysis. By combining seasonality with sector rotation, he provides a deeper look at market...
READ MORE
MEMBERS ONLY
The Best Five Sectors, #8
by Julius de Kempenaer,
Senior Technical Analyst, StockCharts.com
KEY TAKEAWAYS
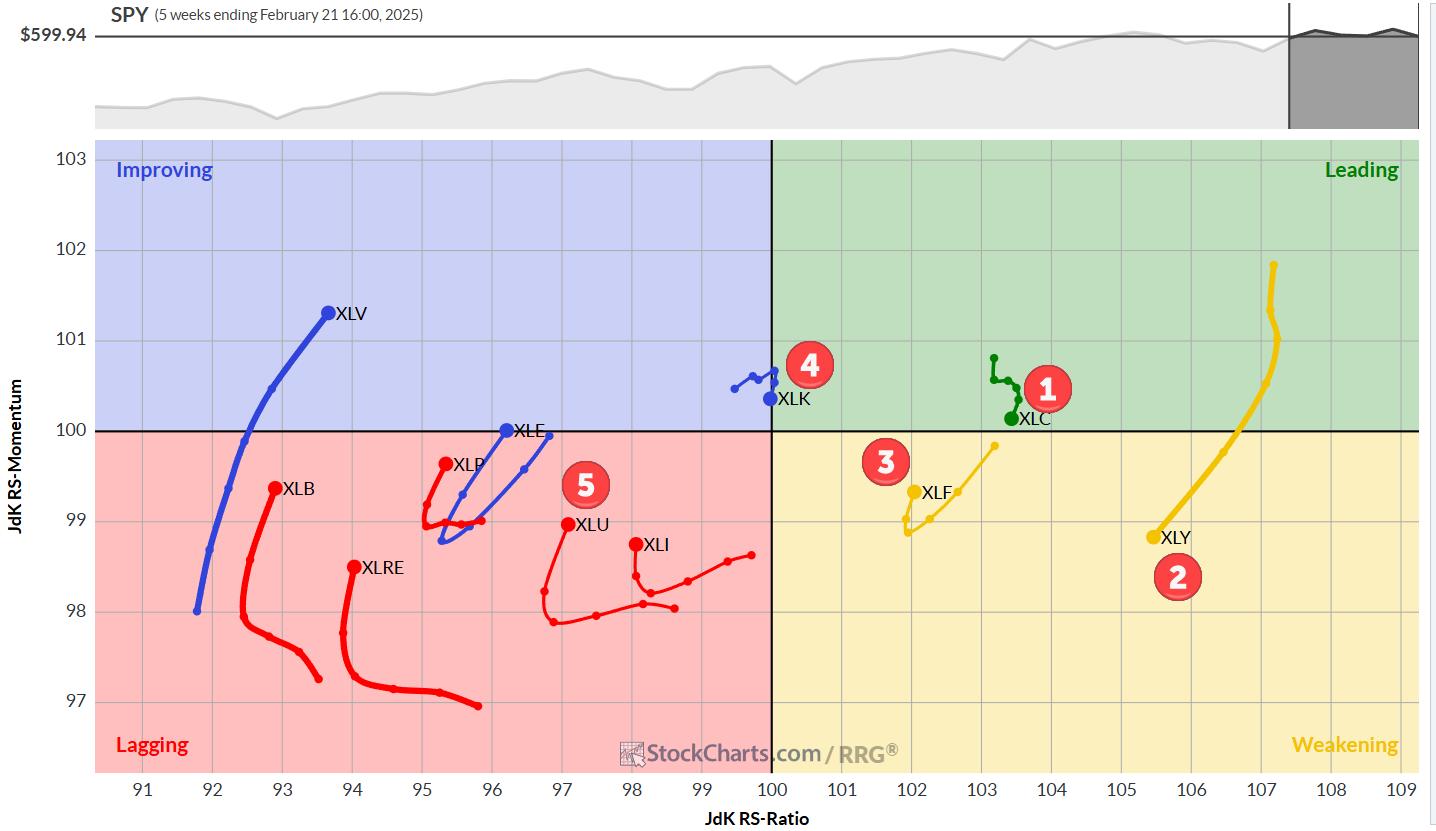
* Utilities entering the top-5
* Industrials dropping out of top-5 portfolio
* Real-Estate and Energy swapping positions in bottom half of the ranking
* Perfomance now 0.3% below SPY since inception.
Utilities enter top 5
Last week's trading, especially the sell-off on Friday, has caused the Utilities sector...
READ MORE
MEMBERS ONLY
Market Rotation and Cap-Weight Dynamics: A Closer Look
by Julius de Kempenaer,
Senior Technical Analyst, StockCharts.com
KEY TAKEAWAYS
* Large cap growth stocks regaining favor as market faces pressure
* Cap-weighted sectors outperforming equal-weighted counterparts
* S&P 500 struggling to break above 610, suggesting potential trading range
* Exceptions in mega-cap dominated sectors (Communication Services, Technology, Consumer Discretionary)
With the market selling off into the close today, it&...
READ MORE
MEMBERS ONLY
The Best Five Sectors, #7
by Julius de Kempenaer,
Senior Technical Analyst, StockCharts.com
KEY TAKEAWAYS
* Communication services (XLC) claims the top spot, pushing consumer discretionary (XLY) to second place
* Technology (XLK) shows strength, moving up to fourth and displacing industrials (XLI)
* Industrials displaying weakness, at risk of dropping out of the top five
* RRG portfolio outperforming SPY benchmark by 69 basis points
Shifting...
READ MORE
MEMBERS ONLY
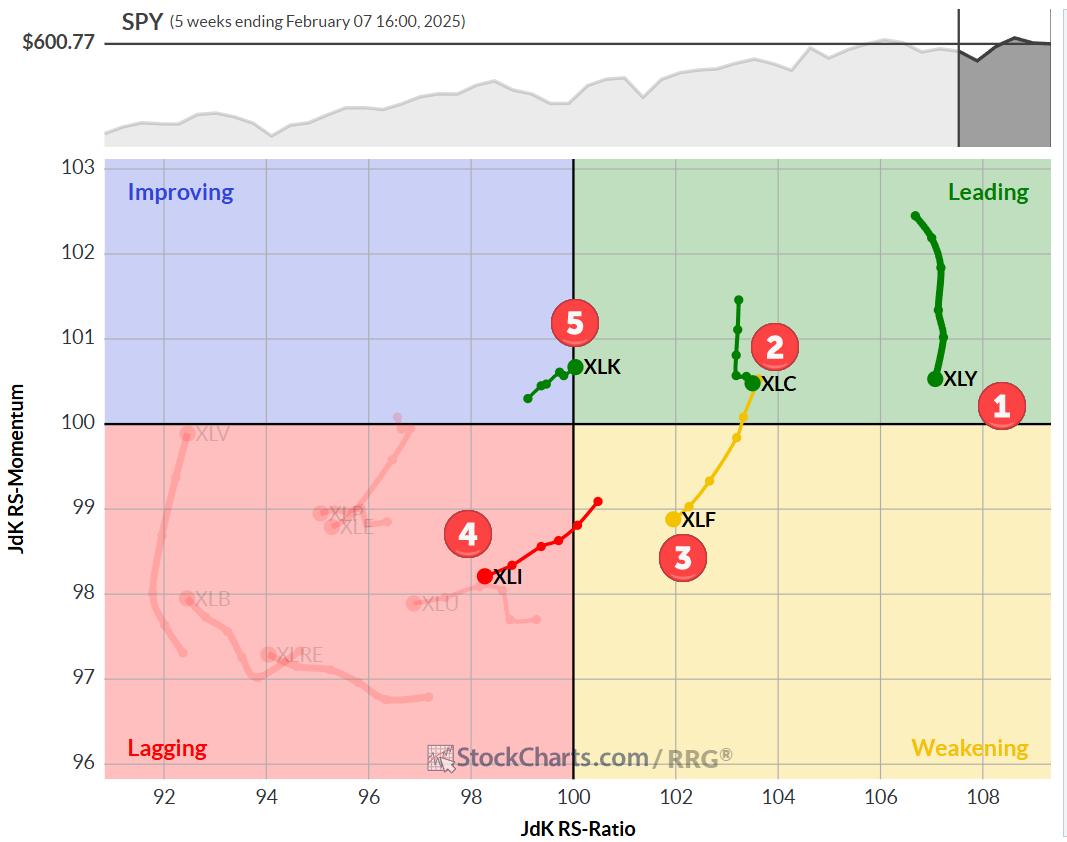
The Best Five Sectors, #6
by Julius de Kempenaer,
Senior Technical Analyst, StockCharts.com
KEY TAKEAWAYS
* Top-5 remains unchanged
* Healthcare and Staples jump to higher positions
* Price and Relative trends remain strong for XLC and XLF
No Changes In Top-5
At the end of the week ending 2/7, there were no changes in the top-5, but there have been some significant shifts in...
READ MORE
MEMBERS ONLY
Watch For These Seasonality Patterns in 2025
by Julius de Kempenaer,
Senior Technical Analyst, StockCharts.com
In this exclusive StockCharts video,Julius shares a new approach to seasonality by using a more granular, data-set constructed UDI (User Defined Index) for every sector. Using the UDI functionality on StockCharts.com allows Julius to plot the seasonal patterns for each sector forward to the end of 2025 and...
READ MORE
MEMBERS ONLY
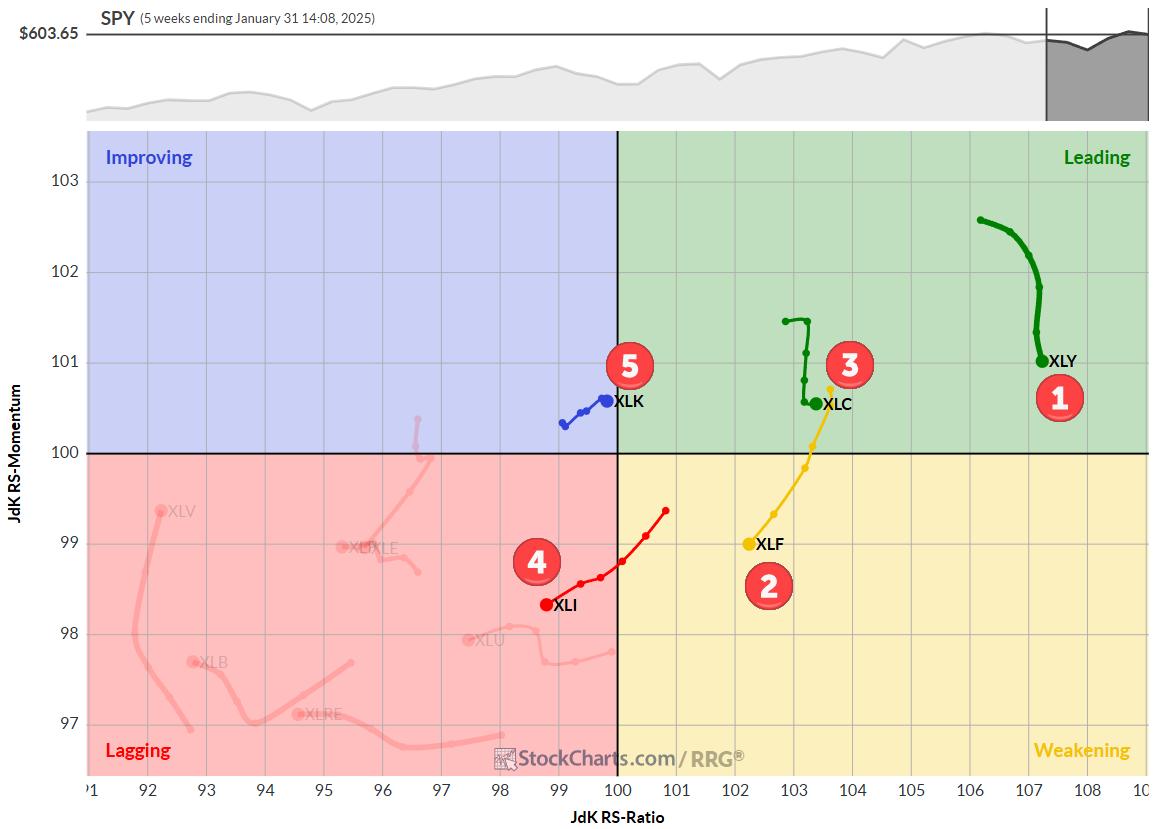
The Best Five Sectors, #5
by Julius de Kempenaer,
Senior Technical Analyst, StockCharts.com
KEY TAKEAWAYS
* Technology (XLK) re-enters top 5 sectors, displacing Energy (XLE)
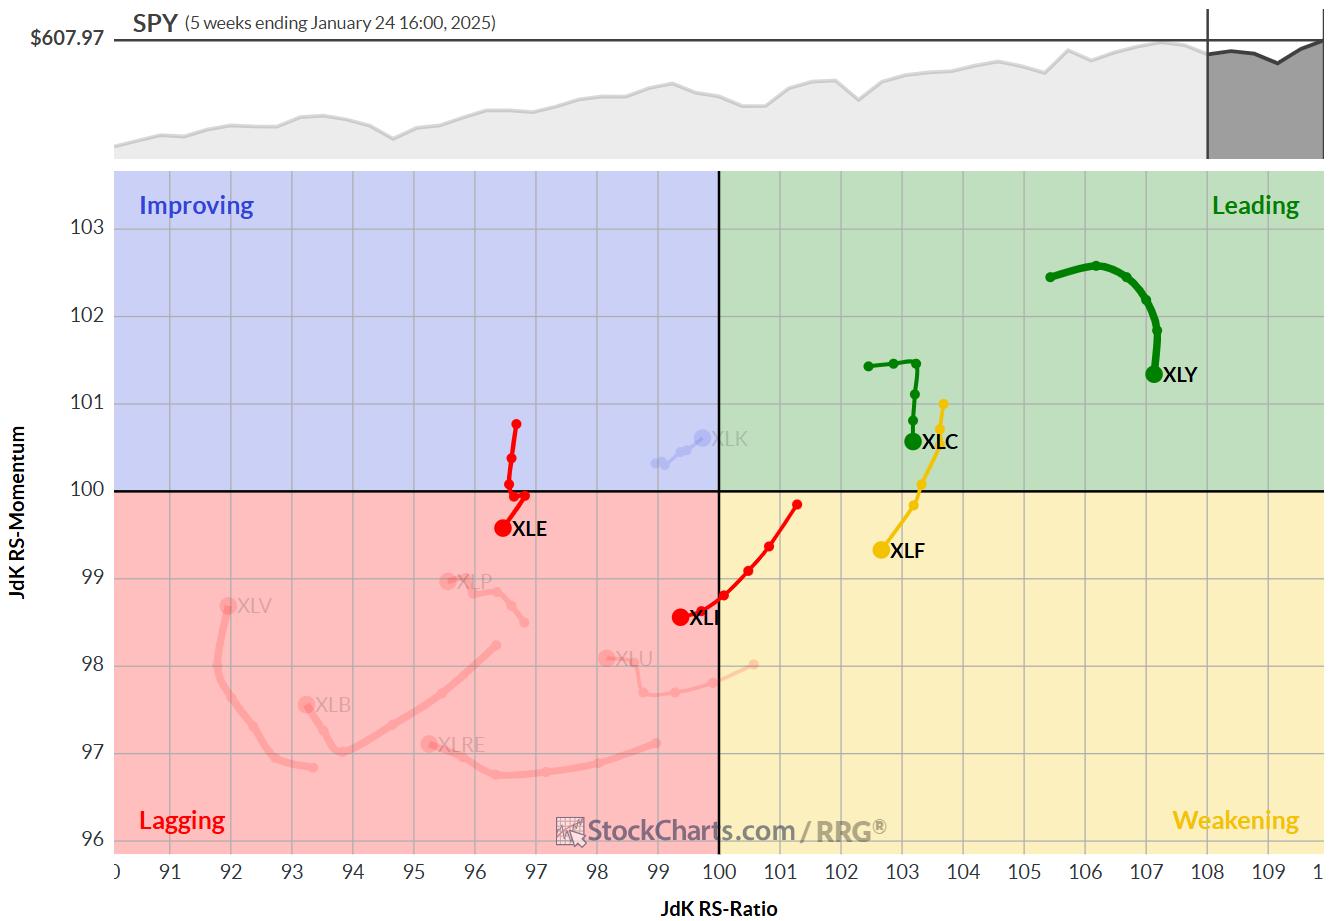
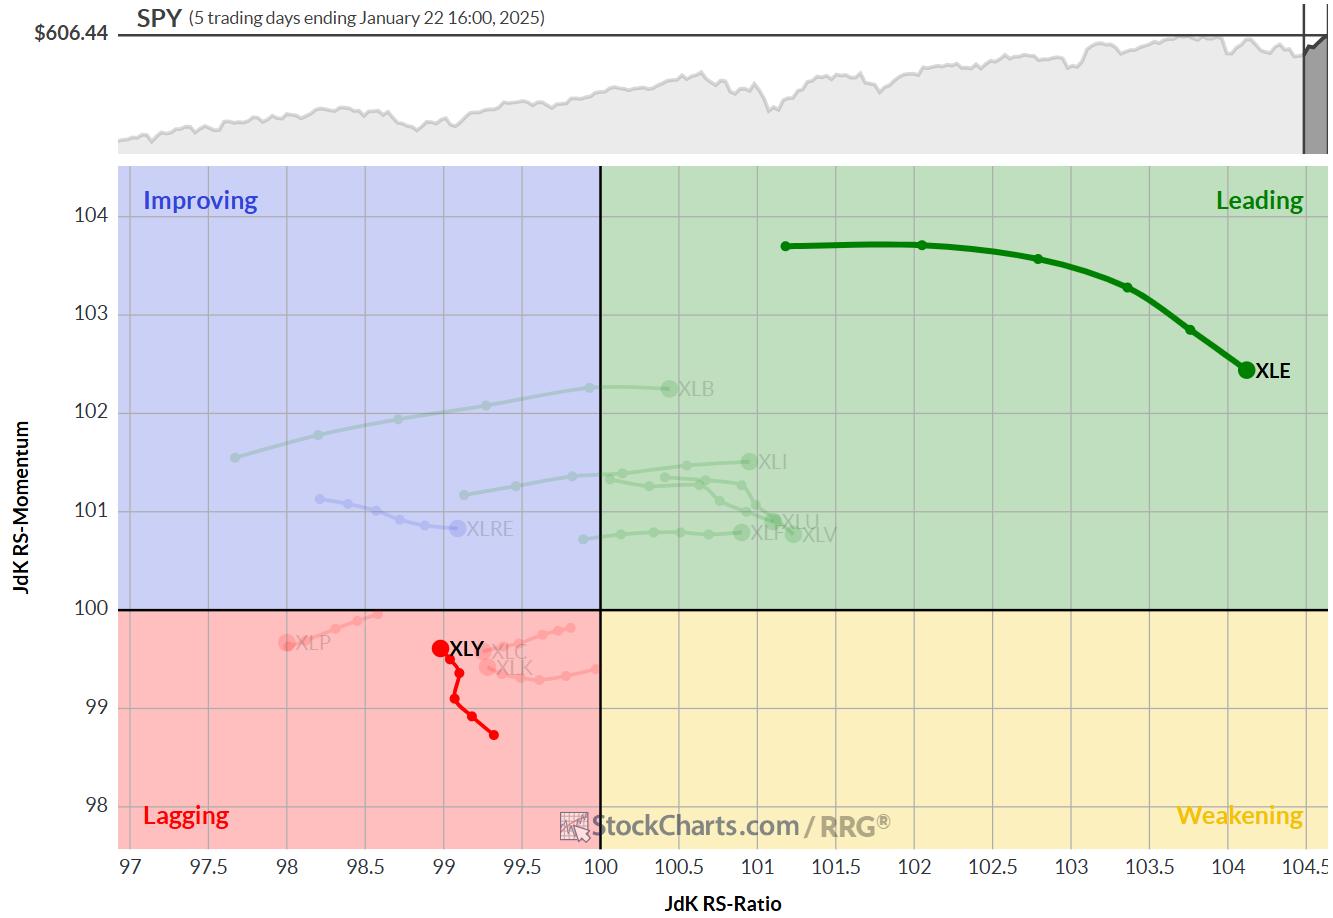
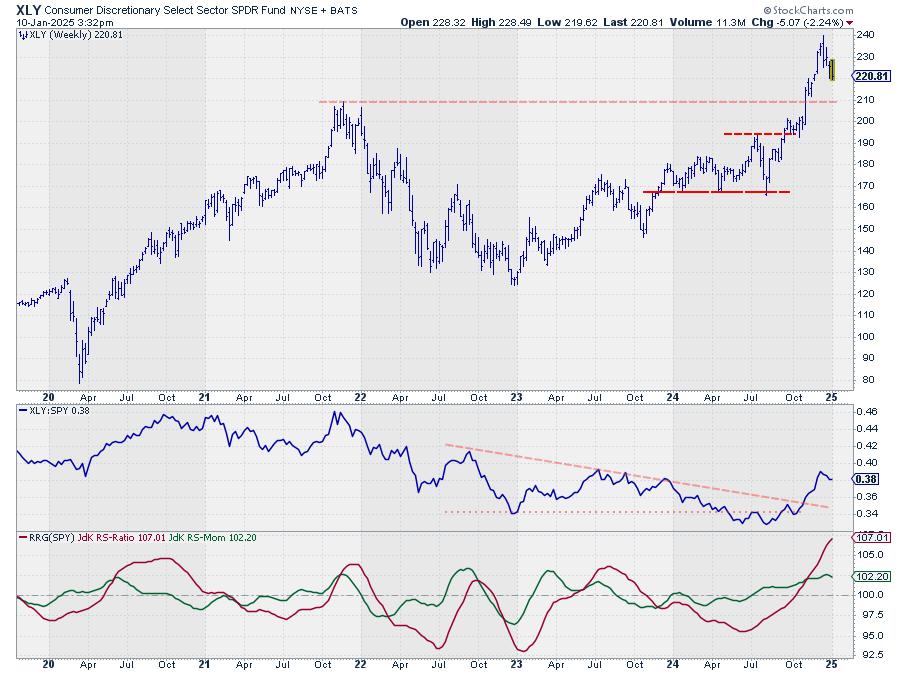
* Consumer Discretionary (XLY) maintains #1 position
* Weekly and daily RRGs show supportive trends for leading sectors XLY and XLC
* Top-5 portfolio outperforms S&P 500 by nearly 50 basis points
Technology Moves Back into Top-5
As we wrap...
READ MORE
MEMBERS ONLY
The Best Five Sectors, #4
by Julius de Kempenaer,
Senior Technical Analyst, StockCharts.com
KEY TAKEAWAYS
* No changes in top-5 sectors
* XLC showing strong break from consolidation flag
* XLE remains just barely above XLK as a result of strong daily RRG
No changes in the top-5
At the end of this week, there were no changes in the ranking of the top-5 sectors.
1....
READ MORE
MEMBERS ONLY
Energy Picks Up and Consumer Discretionary Continues to Lead
by Julius de Kempenaer,
Senior Technical Analyst, StockCharts.com
KEY TAKEAWAYS
* Short term strength drags enery sector up
* Long term strength keeps consumer discretionary on top
* Massive upside potential ready to get unlocked in EOG
I have been traveling in the US since 1/15 and attended the CMTA Mid-Winter retreat in Tampa, FL 1/16-1/17 and then...
READ MORE
MEMBERS ONLY
The Best Five Sectors, #3
by Julius de Kempenaer,
Senior Technical Analyst, StockCharts.com
KEY TAKEAWAYS
* Energy replaces Technology in top-5
* Financials rise to #2 position pushing XLC down to #3
* Top-5 portfolio out-performs SPY 0.52%
* A closer look at the (equal) weighting scheme
Energy Replaces Technology
At the end of this week, 1/17/2024, the Technology sector dropped out of the...
READ MORE
MEMBERS ONLY
Stocks UNDER PRESSURE! Which Sector is Leading Now?
by Julius de Kempenaer,
Senior Technical Analyst, StockCharts.com
In this exclusive StockCharts video,Julius takes a look at asset class rotation on Relative Rotation Graphs. He then addresses the 6 sectors that are NOT in the "best five sectors" for this week. To conclude, he dives into the Technology sector to find some of the best...
READ MORE
MEMBERS ONLY
The Best Five Sectors, #2
by Julius de Kempenaer,
Senior Technical Analyst, StockCharts.com
KEY TAKEAWAYS
* The best five sectors remain unchanged.
* XLC and XLF are both starting to show weakness.
* XLI is holding above support, while XLK remains within rising channel.
The composition of the top five sectors remains unchanged this week, despite an interrupted trading week. This stability comes against a backdrop...
READ MORE
MEMBERS ONLY
THIS is the BEST Market Sector Right Now!
by Julius de Kempenaer,
Senior Technical Analyst, StockCharts.com
In this exclusive StockCharts video,Julius takes a look at what he recently called "The Best Five Sectors" on a relative rotation graph side-by-side with their price charts. He then takes an in-depth at Consumer Discretionary, and shares some interesting stocks within, including AMZN, ULTA, and more.
This...
READ MORE
MEMBERS ONLY
The Best Five Sectors, #1
by Julius de Kempenaer,
Senior Technical Analyst, StockCharts.com
HAPPY NEW YEAR!!!
Ever since the introduction of RRG back in 2011, many people have asked me questions like: "What is the track record for RRG" or "What are the trading rules for RRG"?
My answers have always been, and will continue to be, "There...
READ MORE
MEMBERS ONLY
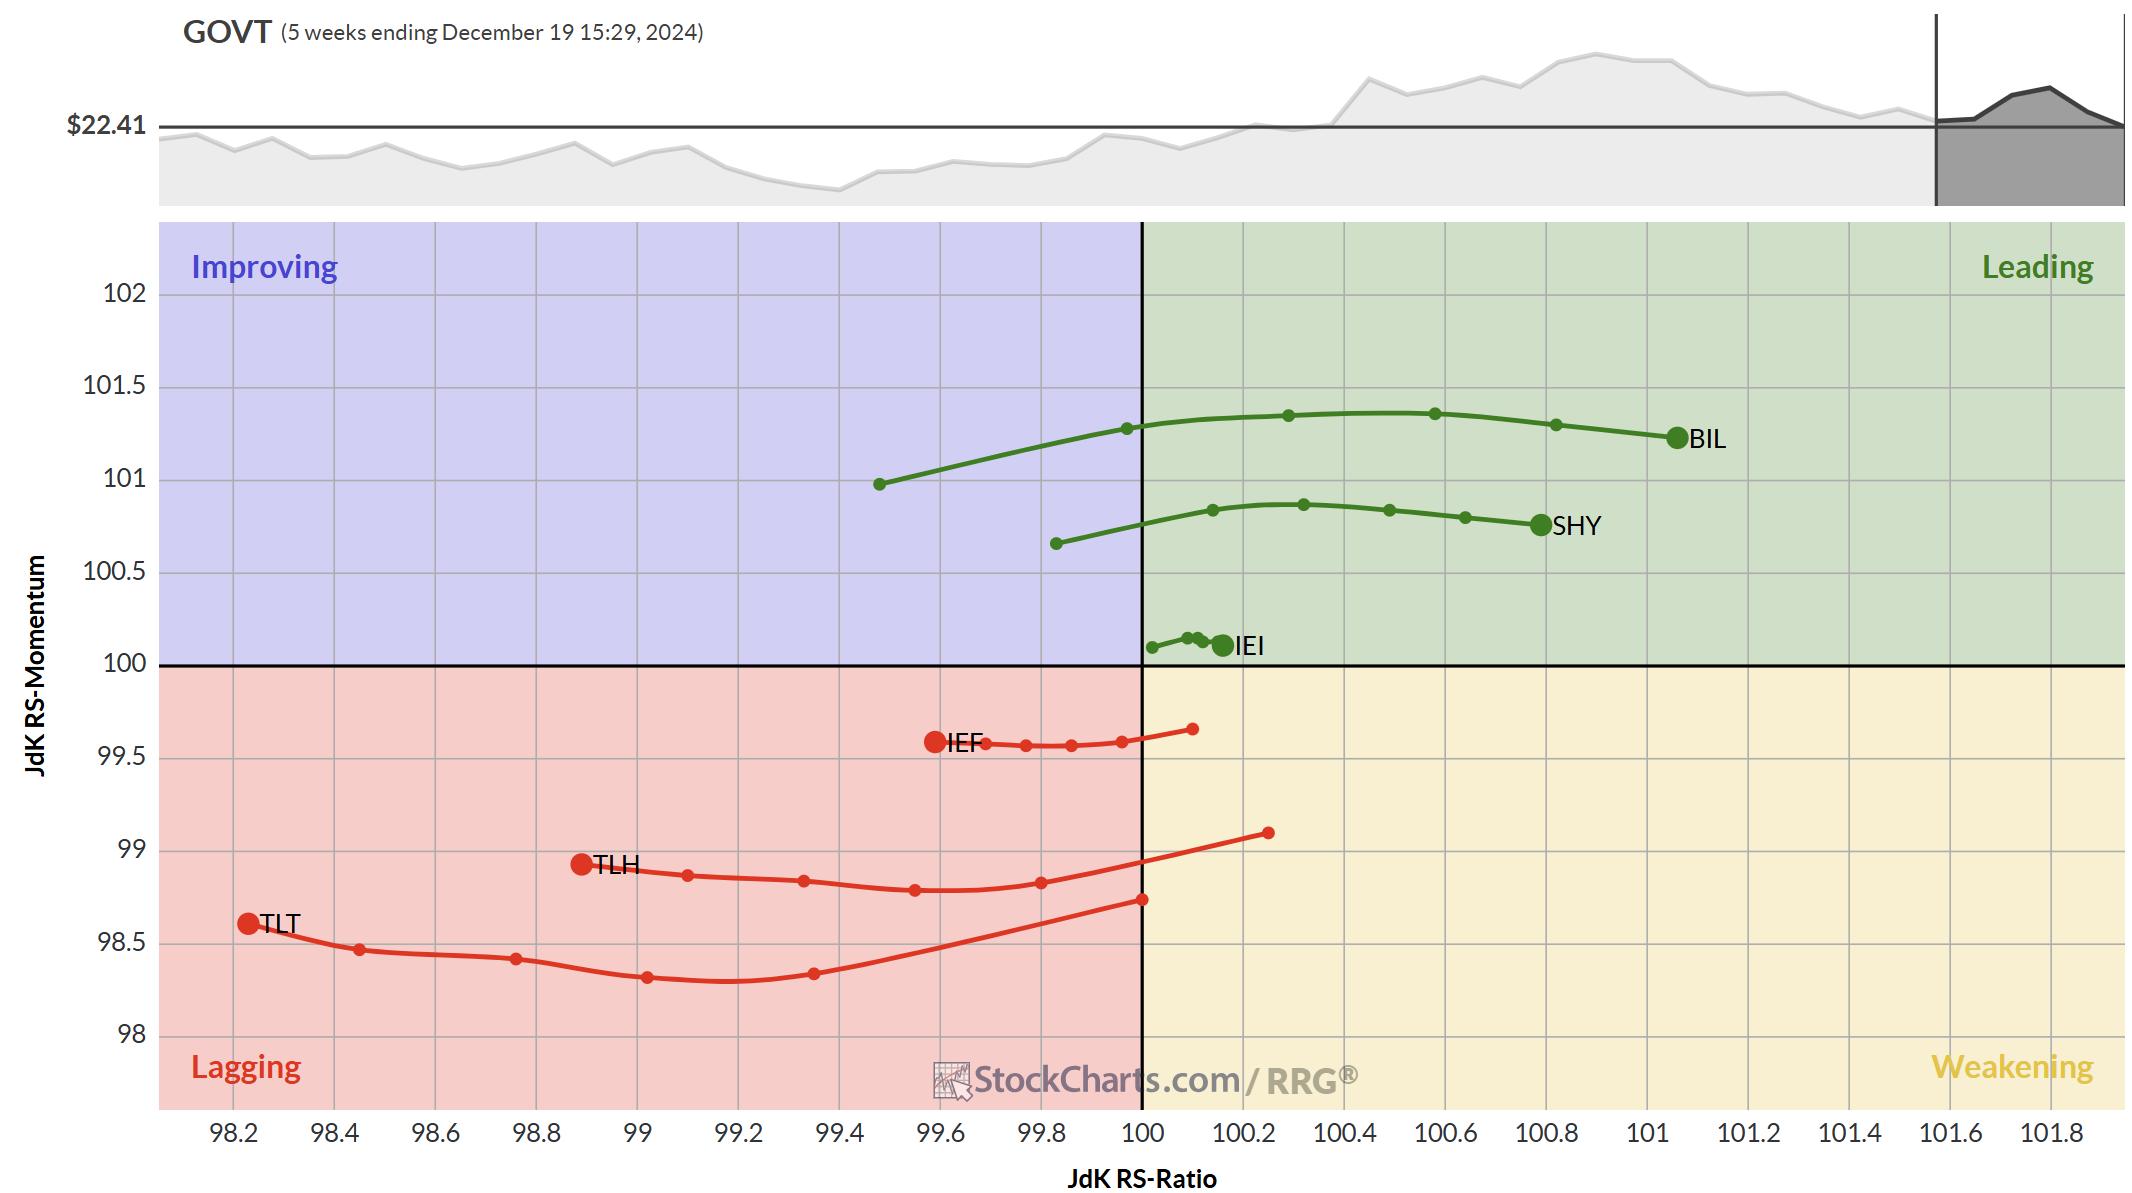
Three RRGs to Keep You on Track
by Julius de Kempenaer,
Senior Technical Analyst, StockCharts.com
KEY TAKEAWAYS
* Track the Yield curve moving back to normal on RRG
* USD showing massive strength against all currencies
* Stock market drop not affecting sector rotation (yet)
The Yield Curve
The RRG above shows the rotations of the various maturities on the US-Yield Curve.
What we see at the moment...
READ MORE
MEMBERS ONLY
Top Techniques for Finding Strength in Sectors
by Julius de Kempenaer,
Senior Technical Analyst, StockCharts.com
In this exclusive StockCharts video,Julius gives a quick update on sector rotation, then examines the strength uncovered in Consumer Discretionary. He analyzes names like TSLA, AMZN, and LULU; some are in full swing uptrends, but there are also a few names that are on the verge of turning around...
READ MORE
MEMBERS ONLY
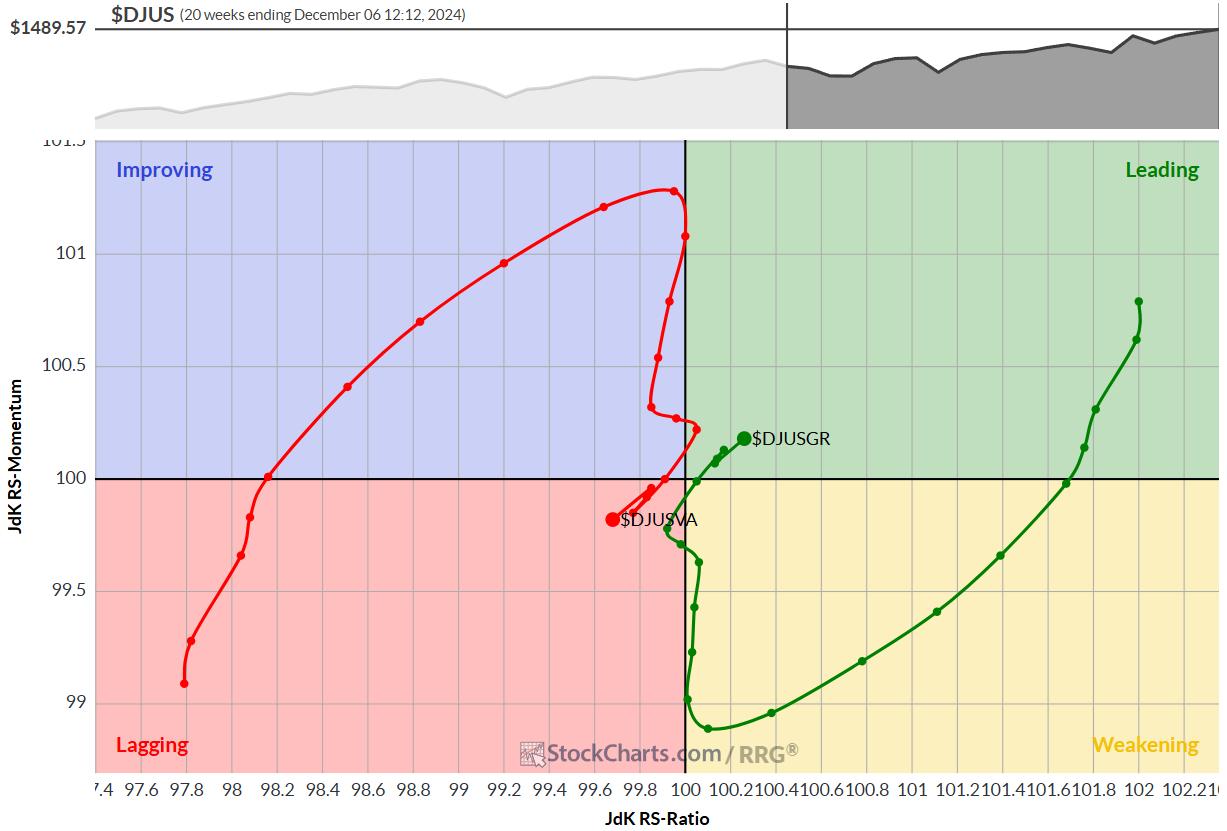
Stay Away from Large-Cap Value Stocks
by Julius de Kempenaer,
Senior Technical Analyst, StockCharts.com
KEY TAKEAWAYS
* Growth stocks are regaining leadership over value.
* Small and mid-cap growth sectors are leading the charge.
* Large-cap value is currently the weakest market segment.
Growth vs. Value Rotation: The Pendulum Swings Again
Relative Rotation Graphs (RRG) are not just good tools to use in analyzing sector rotation; they&...
READ MORE
MEMBERS ONLY
Financials Primed to Beat Tech in December!
by Julius de Kempenaer,
Senior Technical Analyst, StockCharts.com
In this exclusive video,Julius analyzes the completed monthly charts for November and assesses the long-term trends for all sectors. What we can expect for the coming month of December based on seasonality? With the technology sector under pressure, an interesting opportunity appears to be arising in Financials.
This video...
READ MORE
MEMBERS ONLY
Can the S&P 500 Rally Without Tech?
by Julius de Kempenaer,
Senior Technical Analyst, StockCharts.com
In this video from StockCharts TV,Julius takes a deep dive into US sector rotation, breaking it down into offensive, defensive and cyclical sectors. He first looks at the relative rotations that are shaping up inside the group, assessing each sector's price chart in combination with the rotation...
READ MORE
MEMBERS ONLY
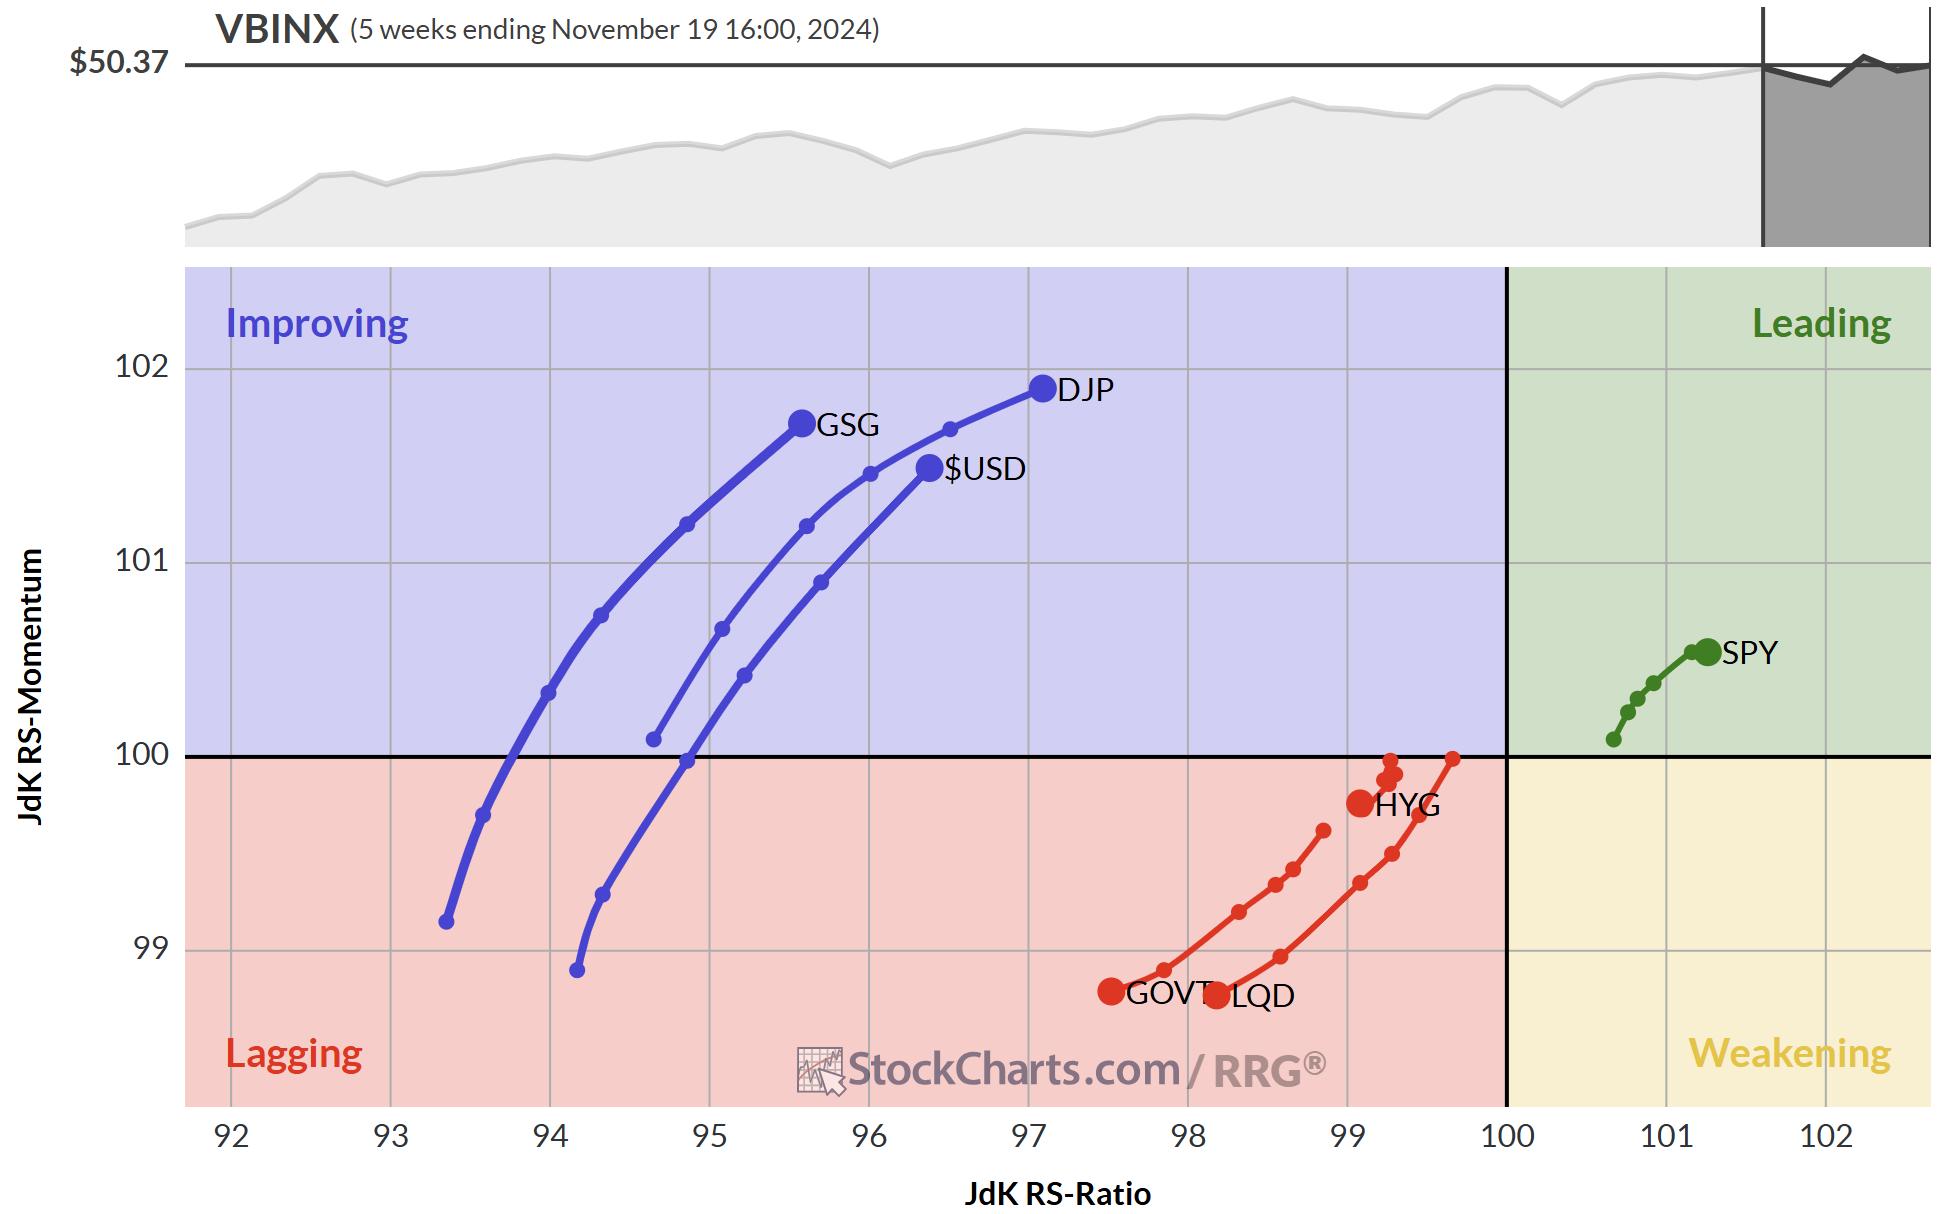
Is the USD Setting Up for a Perfect Rally?
by Julius de Kempenaer,
Senior Technical Analyst, StockCharts.com
KEY TAKEAWAYS
* Despite a lot of turmoil, SPY continues to show strong rotations on both weekly and daily RRGs.
* Rising yields have not damaged the stock rally yet.
* Stock/Bond ratio remains strongly in favor of stocks.
After the election, things have hardly settled in the world. New developments in...
READ MORE
MEMBERS ONLY
MUST SEE Updates to RRG Charts on StockCharts!
by Julius de Kempenaer,
Senior Technical Analyst, StockCharts.com
In this video from StockCharts TV,Julius pulls the curtain back on the updated Relative Rotation Graphs that are now available on the StockCharts website. He demonstrates a myriad of new features, including alignment of the intraday time frames with SharpCharts/ACP, zoom and position control with your mouse, and...
READ MORE
MEMBERS ONLY
Three Sectors Leading SPY Back to Offense
by Julius de Kempenaer,
Senior Technical Analyst, StockCharts.com
KEY TAKEAWAYS
* The market came out of defensive mode after the election.
* Old resistance at 585 is now support for SPY.
* XLC, XLY, and XLF are all showing strength.
First of all, for those of you looking for a new video this week, I have intentionally skipped it because I...
READ MORE
MEMBERS ONLY
S&P 500 Under Pressure, Can Strong Seasonality Save It?
by Julius de Kempenaer,
Senior Technical Analyst, StockCharts.com
In this video from StockCharts TV,Julius begins by looking back at the completed monthly bars for October to assess the long term trends in the 11 S&P sectors. He follows that up with an updated view for SPY in coming weeks. After that, Julius looks forward using...
READ MORE
MEMBERS ONLY
Market Rotation Fueled by Large-Cap Growth (Again)
by Julius de Kempenaer,
Senior Technical Analyst, StockCharts.com
KEY TAKEAWAYS
* Large-cap stocks are pushing the market higher.
* Large-cap growth is the only segment driving the market.
* AAPL, TSLA, NVDA, and AMD are having trouble pushing higher.
Following the recent market fluctuations, with a sharp decline and a subsequent rally, it's crucial to examine these movements'...
READ MORE
MEMBERS ONLY
The US is Not the Only Stock Market in the World
by Julius de Kempenaer,
Senior Technical Analyst, StockCharts.com
KEY TAKEAWAYS
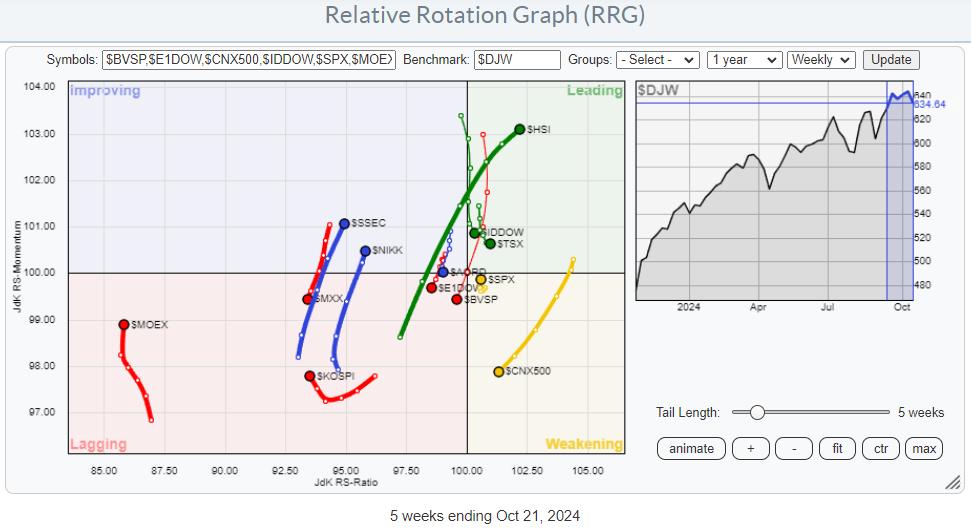
* Asian stock markets showing strong relative trends.
* Meanwhile, India, Mexico, and Brazil are nosediving.
* Overall, the US is stull beating Europe.
The global stock market is a big place, and it extends far beyond the borders of the United States. While the US market is undeniably the largest...
READ MORE
MEMBERS ONLY
DISCOVER the Top Consumer Discretionary Stocks
by Julius de Kempenaer,
Senior Technical Analyst, StockCharts.com
In this video from StockCharts TV,Julius begins by looking back at the completed monthly bars for October to assess the long term trends in the 11 S&P sectors. He follows that up with an updated view for SPY in coming weeks. After that, Julius looks forward using...
READ MORE
MEMBERS ONLY
Using RRG To Find Best Three Stocks inside the DJ Industrials Index
by Julius de Kempenaer,
Senior Technical Analyst, StockCharts.com
KEY TAKEAWAYS
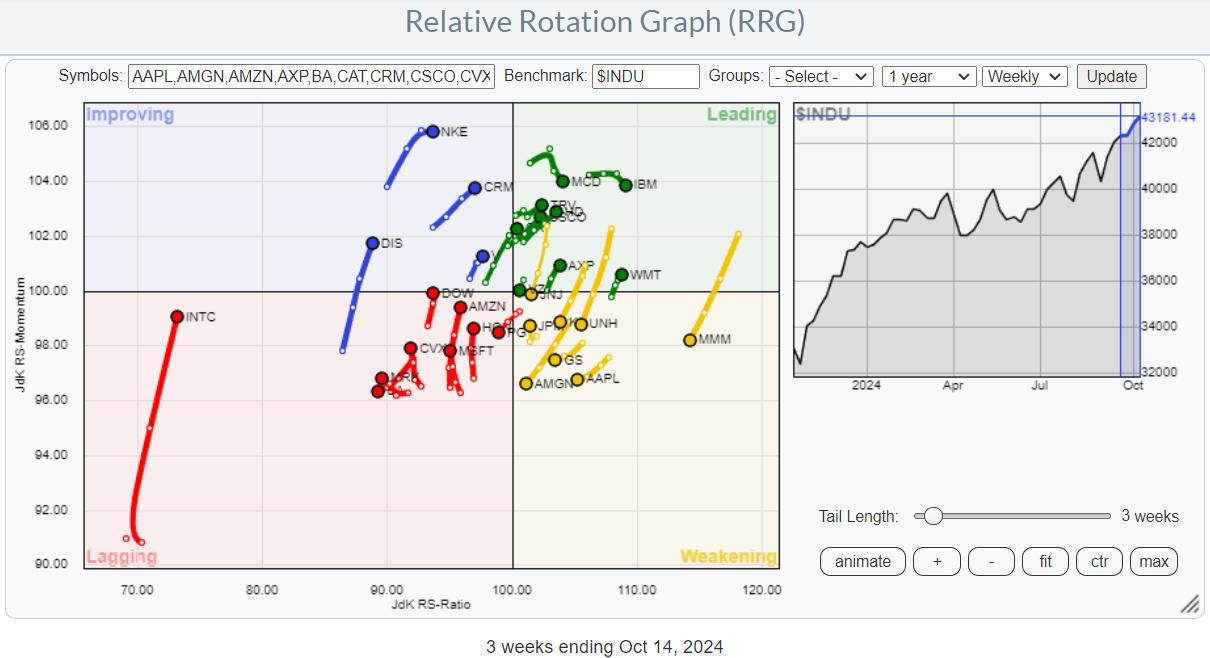
* Sector Rotation Model and current sector rotation are not supporting broad market strength.
* Plotting the members of $INDU on a Relative Rotation Graph helps find the best names in that universe.
* TRV, WMT, and AXP are still strong, but now have too much risk for new positions.
* CAT,...
READ MORE
MEMBERS ONLY
Sector Rotation is Giving Conflicting Stories!
by Julius de Kempenaer,
Senior Technical Analyst, StockCharts.com
In this video from StockCharts TV,Julius dives in to the sector rotation model, trying to find any alignment between theoretical and real-life rotations of sectors in combination with the economic cycle. The positions of the various sectors and the economic indicators that are part of this model are not...
READ MORE
MEMBERS ONLY
It's Large-Cap Growth Stocks (Mag 7) Once Again
by Julius de Kempenaer,
Senior Technical Analyst, StockCharts.com
KEY TAKEAWAYS
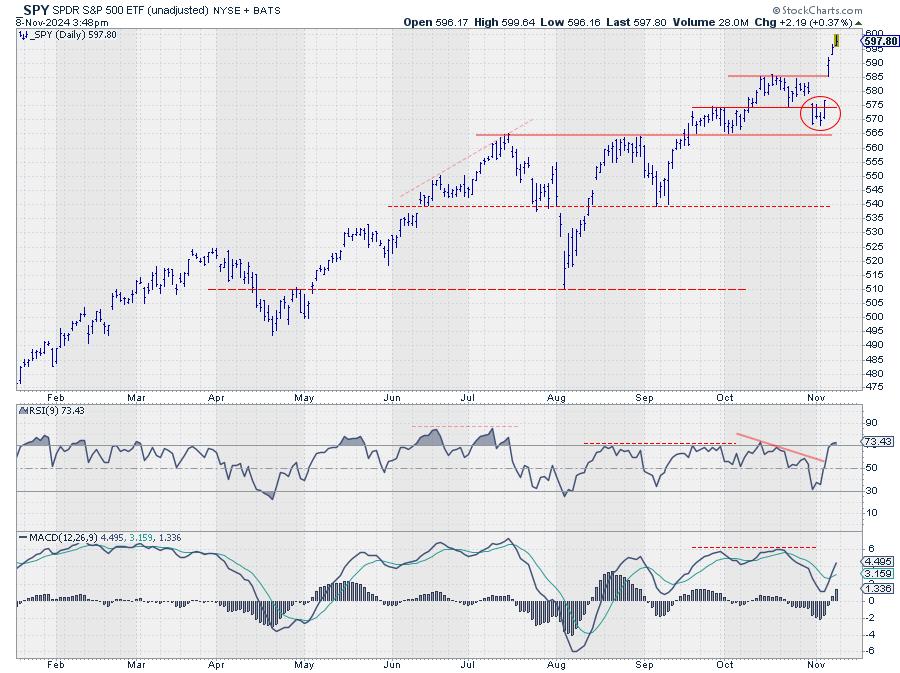
* SPY is starting to resolve its negative divergence with RSI.
* Large-cap growth is coming back into favor.
* Magnificent 7 stocks provided 2.9% of the S&P 50's 6.8% performance over the past five weeks.
Where is the Recent Performance in the S&...
READ MORE
MEMBERS ONLY
Why This S&P Support Level is SO IMPORTANT
by Julius de Kempenaer,
Senior Technical Analyst, StockCharts.com
In this video from StockCharts TV,Julius presents a few conflicting rotations and signals that continue to warrant caution while the S&P 500 keeps hovering just above support. With the negative divergences between price and MACD/RSI remaining intact, SPY should not break 565. Julius looks at rotations...
READ MORE
MEMBERS ONLY
Will Technology Drive S&P Higher in October?
by Julius de Kempenaer,
Senior Technical Analyst, StockCharts.com
In this video from StockCharts TV,Julius explores the October seasonal outlook for the S&P 500 and various sectors. Seasonality suggests a potential rise in the S&P 500, fueled by strength in technology, but there are still concerns about the ongoing negative divergence between price and...
READ MORE
MEMBERS ONLY
US Sectors Soar to New Highs!
by Julius de Kempenaer,
Senior Technical Analyst, StockCharts.com
In this video from StockCharts TV,Julius takes a detailed look at the monthly charts for all US sectors and the S&P 500. With many sectors breaking to new highs, he highlights how the long-term uptrend for the S&P 500 remains intact. Julius also examines the...
READ MORE
MEMBERS ONLY
Opportunities in Industrials and Materials
by Julius de Kempenaer,
Senior Technical Analyst, StockCharts.com
KEY TAKEAWAYS
* Negative divergence remains a distracting factor
* Defensive rotation still present
* Industrials and Materials on positive track toward leading RRG quadrant
Despite a backdrop of conflicting market signals, there are still sectors within the S&P 500 that are showing promising movements and potential opportunities for investors. Today,...
READ MORE
MEMBERS ONLY
Why the Stock Market is SO Confusing Right Now
by Julius de Kempenaer,
Senior Technical Analyst, StockCharts.com
In this video from StockCharts TV,Julius assesses current rotations in asset classes and US sectors using Relative Rotation Graphs, finding a lot of contradictory behavior. Taking a step back, he focuses on the weekly timeframe to find some more meaningful trends and shy away from day-to-day noise. He then...
READ MORE
MEMBERS ONLY
A Sector Rotation Dilemma ...
by Julius de Kempenaer,
Senior Technical Analyst, StockCharts.com
KEY TAKEAWAYS
* Sector Rotation remains defensive
* S&P chart showing resemblence to late 2021
* Negative divergences still in play
First of all, I apologize for my absence this week. I caught something that looked like Covid, and felt like Covid, but it did not identify (pun intended) as Covid....
READ MORE
MEMBERS ONLY
A Déjà Vu in The Consumer Staples Sector Sends a Strong Warning Signal
by Julius de Kempenaer,
Senior Technical Analyst, StockCharts.com
KEY TAKEAWAYS
* Tech bounce is judged as recovery within downtrend.
* XLP, XLF, and XLV are positioned for outperformance in coming weeks.
* The XLP chart is showing interesting characteristics which we have seen before
Tech Rallies, But Remains Inside the Lagging Quadrant
A quick look at the Relative Rotation Graph for...
READ MORE