MEMBERS ONLY
Why Stock Outperformance Might be ENDING!
by Julius de Kempenaer,
Senior Technical Analyst, StockCharts.com
In this video from StockCharts TV,Julius takes a look at rotations in an asset allocation RRG. He compares fixed-income-related asset classes, commodities, the US dollar, Bitcoin and stocks to a balanced portfolio of 60% stocks/40% bonds. The long-lasting outperformance of stocks seems to be coming to an end....
READ MORE
MEMBERS ONLY
Why the S&P 500 Going Sideways is the Best Case Scenario
by Julius de Kempenaer,
Senior Technical Analyst, StockCharts.com
In this video from StockCharts TV,Julius evaluates the completed monthly charts for August, noting the strength of defensive sectors. He then analyzes a monthly RRG and seeks alignment for the observations from the price charts. Could "sideways" be the most positive scenario for the S&P...
READ MORE
MEMBERS ONLY
NVDA is Not the Only Semiconductor Stock Out There
by Julius de Kempenaer,
Senior Technical Analyst, StockCharts.com
KEY TAKEAWAYS
* SPY is pushing against resistance.
* The technology sector is out of favor, and semiconductors are a drag for it.
* NVDA is big, but it is not the only semiconductor stock.
It's All Still Relative
The weekly Relative Rotation Graph, as it looks toward the close of...
READ MORE
MEMBERS ONLY
Weak September Rotation - What Does it Mean for Sectors?
by Julius de Kempenaer,
Senior Technical Analyst, StockCharts.com
In this video from StockCharts TV,Julius addresses the expected sector rotation for the upcoming month of September which is traditionally the weakest month of the year. But what does it mean for sectors and how are current sector rotations shaping up on the Relative Rotation Graphs? Breaking down the...
READ MORE
MEMBERS ONLY
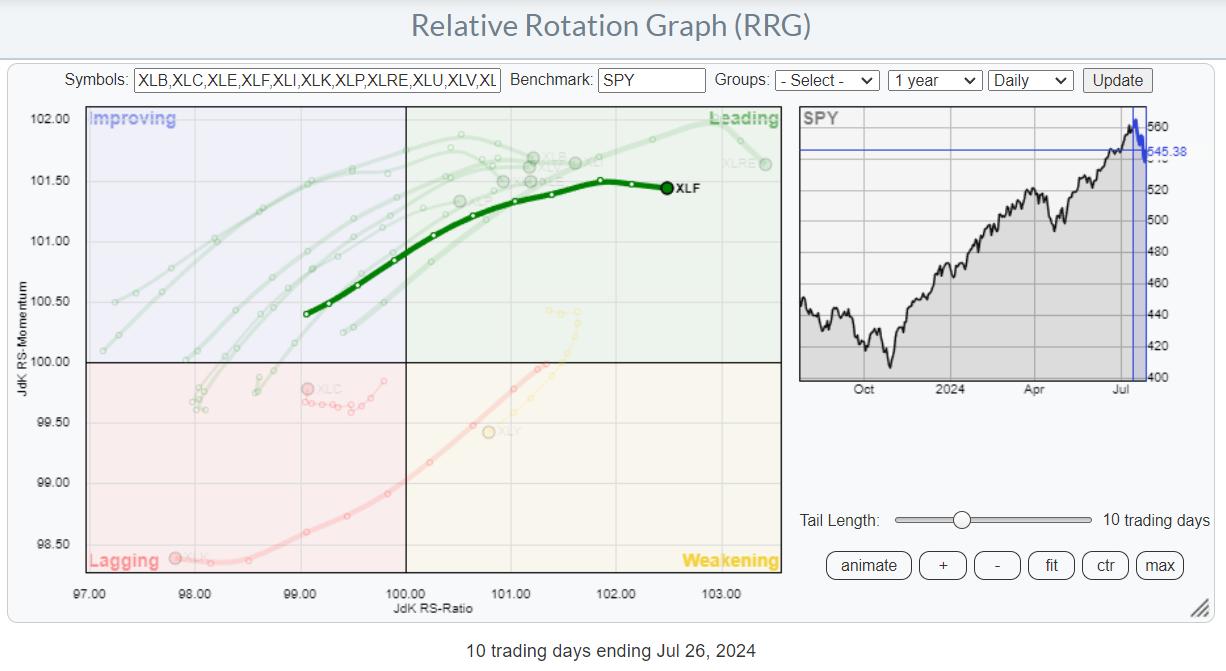
RRG-Velocity Jumping on XLF Tail
by Julius de Kempenaer,
Senior Technical Analyst, StockCharts.com
KEY TAKEAWAYS
* Sector rotation out of technology
* All other sectors are picking up relative strength
* Real-Estate, Utilities, and Financials showing strong rotations
On the weekly Relative Rotation Graph, the rotation still favors almost every sector over Technology. I discussed the opposite rotations between weekly and daily RRGs in last week&...
READ MORE
MEMBERS ONLY
What Does This Mean for the S&P 500 Rally?
by Julius de Kempenaer,
Senior Technical Analyst, StockCharts.com
In this video from StockCharts TV,Julius looks at the conflicting rotations in both asset classes and equity sectors. The weekly rotations differ significantly from their daily counterparts. What does it mean for the current rally in the S&P 500, and what does it mean for the relationship...
READ MORE
MEMBERS ONLY
Strength Off the Lows, But Concerns Remain
by Julius de Kempenaer,
Senior Technical Analyst, StockCharts.com
KEY TAKEAWAYS
* Rotation to large-cap growth is back
* And so is the narrow foundation/breadth supporting this rally
* Weekly and daily $SPX charts need to get in line
Stronger than Expected
The recent rally out of the August 5th low is definitely stronger than I had anticipated. I was watching...
READ MORE
MEMBERS ONLY
CRITICAL Week Ahead for S&P 500
by Julius de Kempenaer,
Senior Technical Analyst, StockCharts.com
In this video from StockCharts TV,Julius assesses various rotations using Relative Rotation Graphs, starting at asset class level and then moving to sectors. Julius zooms in on the industries of two sectors to get an idea of where pockets of out-performance may exist in the current market. He then...
READ MORE
MEMBERS ONLY
It's Been a Long Time Mr Bear, Where Have You Been?
by Julius de Kempenaer,
Senior Technical Analyst, StockCharts.com
KEY TAKEAWAYS
* Some real damage for the markets
* Equal weight sector rotation paints a more realistic picture
* The BIG ROTATION into small caps has come to a halt
And then ..... all of a sudden..... things are heating up. Lots of (downside) market action in the past week.
Let's...
READ MORE
MEMBERS ONLY
Flying Financials. Will It Be Enough?
by Julius de Kempenaer,
Senior Technical Analyst, StockCharts.com
KEY TAKEAWAYS
* Strong Sector Rotation Out Of Technology
* Financials and Real Estate Lead
* Stock/Bond Ratio Triggers Sell Signal
Flying Financials
In the recent sector rotation, basically OUT of technology and INTO anything else, Financials and Real-Estate led the relative move.
On the RRG above, I have highlighted the (daily)...
READ MORE
MEMBERS ONLY
Can Small and Mid-Caps Save the Market?
by Julius de Kempenaer,
Senior Technical Analyst, StockCharts.com
In this video from StockCharts TV,Julius takes a look at the markets through the lens of the "market factors" panel you can find on your StockCharts dashboard. Starting from the RRG, he then moves to the individual charts for these factors and notes a low correlation for...
READ MORE
MEMBERS ONLY
Will This Sector Rotation Be the Start of Something Bigger?
by Julius de Kempenaer,
Senior Technical Analyst, StockCharts.com
KEY TAKEAWAYS
* Technology is rotating out of favor
* Market Capitalization is a two-edged sword
* Negative divergences on Technology and S&P 500 charts are executing
Strong Rotations on Daily RRG
This daily RRG shows the sector rotation over the last five days. With only one more trading day to...
READ MORE
MEMBERS ONLY
Why Stocks are STILL the BEST Investment
by Julius de Kempenaer,
Senior Technical Analyst, StockCharts.com
In this video from StockCharts TV,Julius looks at the markets from an asset allocation perspective using various RRGs. Stocks are (still) beating bonds, while commodities are rotating out of favor and the USD is losing steam. BTC is jumping higher off support, and the Yield Curve is steepening against...
READ MORE
MEMBERS ONLY
Market Foundation Showing CRACKS!
by Julius de Kempenaer,
Senior Technical Analyst, StockCharts.com
In this video from StockCharts TV,Julius continues to look at the narrowing market breadth and puts things into (another) perspective. The conclusion remains the same: it's a Risk-ON market, but the Risk is BIG.
This video was originally broadcast on July 9, 2024. Click anywhere on the...
READ MORE
MEMBERS ONLY
Unmasking Market Moves: Why Focusing on Individual Stocks Beats Indexes in 2024
by Julius de Kempenaer,
Senior Technical Analyst, StockCharts.com
KEY TAKEAWAYS
* Today, we're looking at market breadth from a different perspective
* In this article, we'll plot major US stockmarket indices on a Relative Rotation Graph
* Even inside the NYFANG index, the base is narrow
There's been much chatter and mentions of weak or...
READ MORE
MEMBERS ONLY
Market Breadth is Narrowing - Should You Be Worried?
by Julius de Kempenaer,
Senior Technical Analyst, StockCharts.com
In this video from StockCharts TV,Julius assesses the long-term trends as they are playing out on the monthly S&P 500 sector charts. He takes a look into the future using the expected seasonal trends for the month of July. Markets are still going higher, but the path...
READ MORE
MEMBERS ONLY
Large-Cap Growth Threatens the S&P Rally
by Julius de Kempenaer,
Senior Technical Analyst, StockCharts.com
In this video from StockCharts TV,Julius takes a look at rotation among growth/value and size segments, followed by a look at current sector rotation. He detects an intraday sector rotation he has never seen before, which could be the prelude for a larger move.
This video was originally...
READ MORE
MEMBERS ONLY
Price Pays... But For How Long?
by Julius de Kempenaer,
Senior Technical Analyst, StockCharts.com
KEY TAKEAWAYS
* The number of new 52-week highs is declining
* The percentages of stocks trading above 200-,50-, and 20-day Exp Moving Averages are declining
* Despiote narrowing breadth, the S&P continues higher
While the S&P 500 continues to move higher, the number of stocks participating to...
READ MORE
MEMBERS ONLY
Market Stumbles Near The Edge of a CLIFF
by Julius de Kempenaer,
Senior Technical Analyst, StockCharts.com
In this video from StockCharts TV,Julius shares a rare RRG rotational pattern that he's never seen before! He then follows up with a breakdown of the current sector rotation into offensive, defensive, and sensitive, and finds that only one sector is on a positive relative trajectory... which...
READ MORE
MEMBERS ONLY
Sector Rotation Model Flashes WARNING Signals
by Julius de Kempenaer,
Senior Technical Analyst, StockCharts.com
In this video from StockCharts TV,Julius examines the theoretical sector rotation model and aligns it with current state of sector rotation on Relative Rotation Graphs, and the phase of the economy. He makes some interesting observations and highlights some flashing warning signals.
Check out Julius' Macroeconomic Variables/Metrics...
READ MORE
MEMBERS ONLY
Only One Pocket of Strength Left in US Stock Market
by Julius de Kempenaer,
Senior Technical Analyst, StockCharts.com
KEY TAKEAWAYS
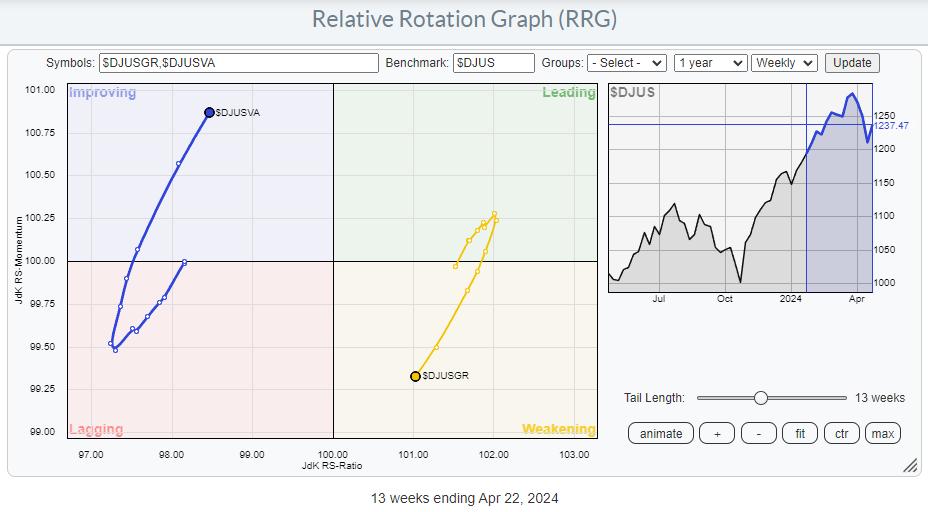
* Only Large-Cap Growth is on a positive RRG-Heading
* No segment, except LC Growth, has managed to take out its late March high
* $DJUSGL setting up for negative divergences
Breaking Down Into Growth / Value
Using Relative Rotation Graphs to help break down the US stock market into various segments...
READ MORE
MEMBERS ONLY
These SURPRISING Sectors are Showing Strength
by Julius de Kempenaer,
Senior Technical Analyst, StockCharts.com
In this video from StockCharts TV,Julius uses the S&P 500 Sector Indexes to assess the long term price trends on the completed monthly charts for May, then discusses the long-term relative trends on a monthly RRG. Julius highlights the continued relative strength for Technology, Communication Services and...
READ MORE
MEMBERS ONLY
What Happens to GOOGL When This Negative Divergence Executes
by Julius de Kempenaer,
Senior Technical Analyst, StockCharts.com
In this video from StockCharts TV,Julius takes a look at the differences in rotation between cap-weighted and equal-weighted sectors and sees a warning signal for GOOGL. He also examines the Communications Sector vs. the Equal-Weighted ETF.
This video was originally broadcast on May 28, 2024. Click anywhere on the...
READ MORE
MEMBERS ONLY
Surge in TSLA and Strong AMZN Not Enough
by Julius de Kempenaer,
Senior Technical Analyst, StockCharts.com
KEY TAKEAWAYS
* Defensive sector rotation remains a concern.
* AMZN & TSLA are both strong, but XLY remains in relative downtrend.
* Large Cap Growth is the only segment on a strong RRG-Heading.
Concerns Remain
My concerns about current market developments, which I voiced in last week's article, are still...
READ MORE
MEMBERS ONLY
S&P 500 Breakout: Here to STAY or Heading for a FALL?
by Julius de Kempenaer,
Senior Technical Analyst, StockCharts.com
In this video from StockCharts TV,Julius assesses the quality of the breakout in the S&P 500, using sector rotation on Relative Rotation Graphs, the volume pattern in the S&P 500 and the relationship between stocks and bonds.
This video was originally broadcast on May 20,...
READ MORE
MEMBERS ONLY
Is This the Magic Upward Break Everybody Was Waiting For?
by Julius de Kempenaer,
Senior Technical Analyst, StockCharts.com
KEY TAKEAWAYS
* Sector rotation still pointing to defense
* Upward break in SPY not supported by volume
* Asset class rotation starting to rotate in favor of bonds
No Confirmation In Volume
This week, the S&P 500 is breaking out above its previous high, undeniably a bullish sign. After the...
READ MORE
MEMBERS ONLY
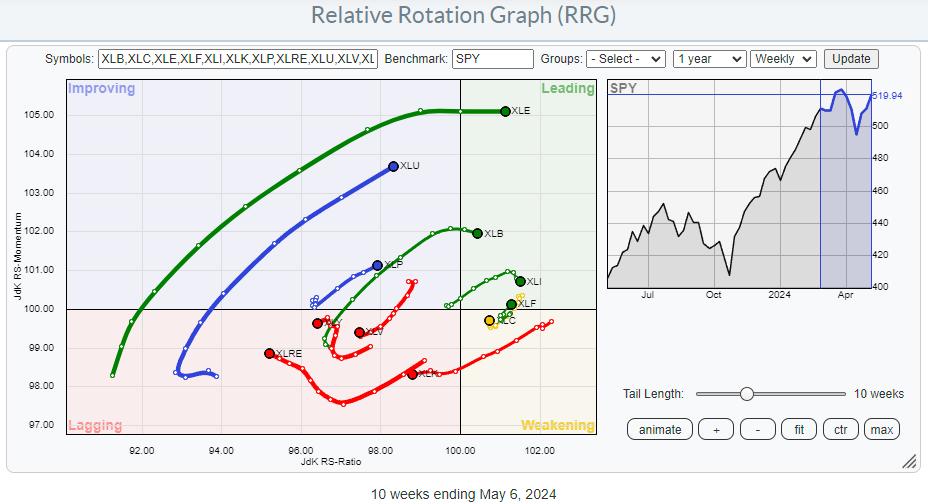
These Three Strong Financial Stocks Look Ready To Surge Higher
by Julius de Kempenaer,
Senior Technical Analyst, StockCharts.com
KEY TAKEAWAYS
* XLF on strong RRG-Heading, rotating back into leading quadrant
* XLF price approaching overhead resistance after short setback
* Three major financial stocks ready for upward breaks to lead the sector higher
The Relative Rotation Graph for US sectors shows long tails for XLE and XLU. Both are on a...
READ MORE
MEMBERS ONLY
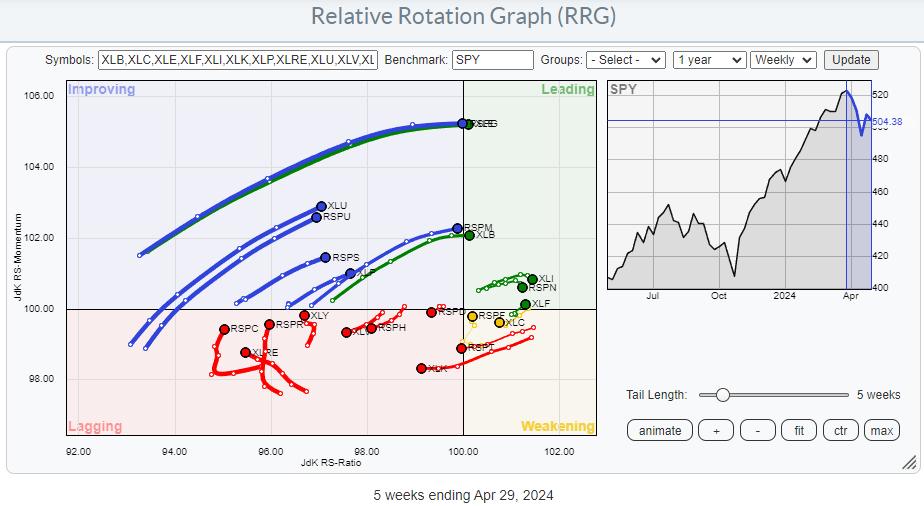
Diverging Tails on This Relative Rotation Graph Unveil Trading Opportunities
by Julius de Kempenaer,
Senior Technical Analyst, StockCharts.com
KEY TAKEAWAYS
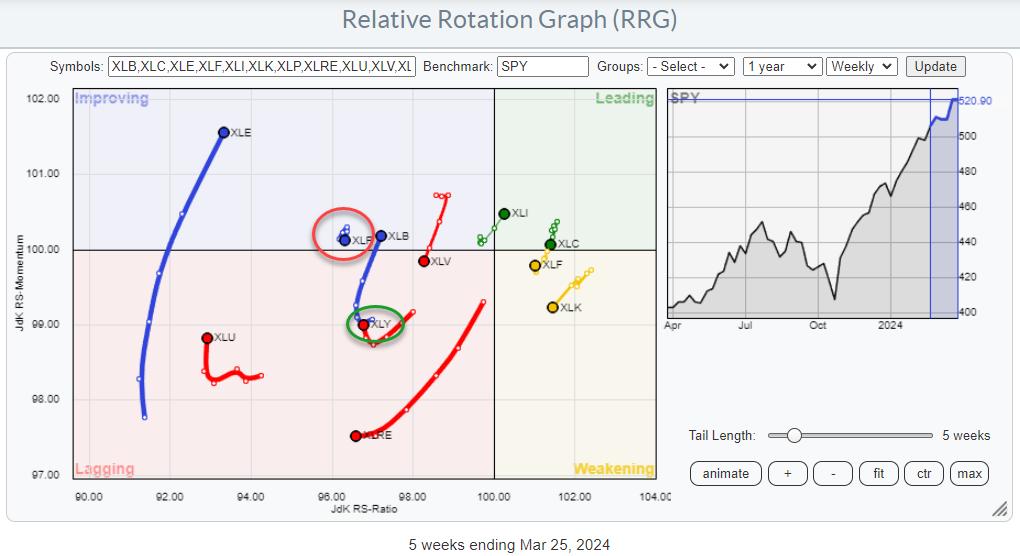
* Comparing equal-weighted and cap-weighted sectors on a Relative Rotation Graph can offer interesting insights
* When the trajectory of the tails and their position on the chart differ significantly, further investigation is warranted
* At the moment, two sectors are showing such divergences
All on the Same Track... or?
The...
READ MORE
MEMBERS ONLY
10% Downside Risk For Stocks as Value Takes The Lead
by Julius de Kempenaer,
Senior Technical Analyst, StockCharts.com
KEY TAKEAWAYS
* Value stocks are taking over the lead from Growth
* When Value beats Growth, the S&P 500 usually does not do too well
* The strength of Value is surfacing across all size segments of the market
* Important support areas for SPY at 480 and 460
Value Taking...
READ MORE
MEMBERS ONLY
RRG Indicates That Non-Mega Cap Technology Stocks are Improving
by Julius de Kempenaer,
Senior Technical Analyst, StockCharts.com
KEY TAKEAWAYS
* The energy sector remains on a very strong rotational path
* A completed top formation in Healthcare opens up significant downside risk
* Smaller Technology stocks are taking over from mega-cap names
A Sector Rotation Summary
A quick assessment of current sector rotation on the weekly Relative Rotation Graph:
XLB:...
READ MORE
MEMBERS ONLY
Energy is on Fire
by Julius de Kempenaer,
Senior Technical Analyst, StockCharts.com
KEY TAKEAWAYS
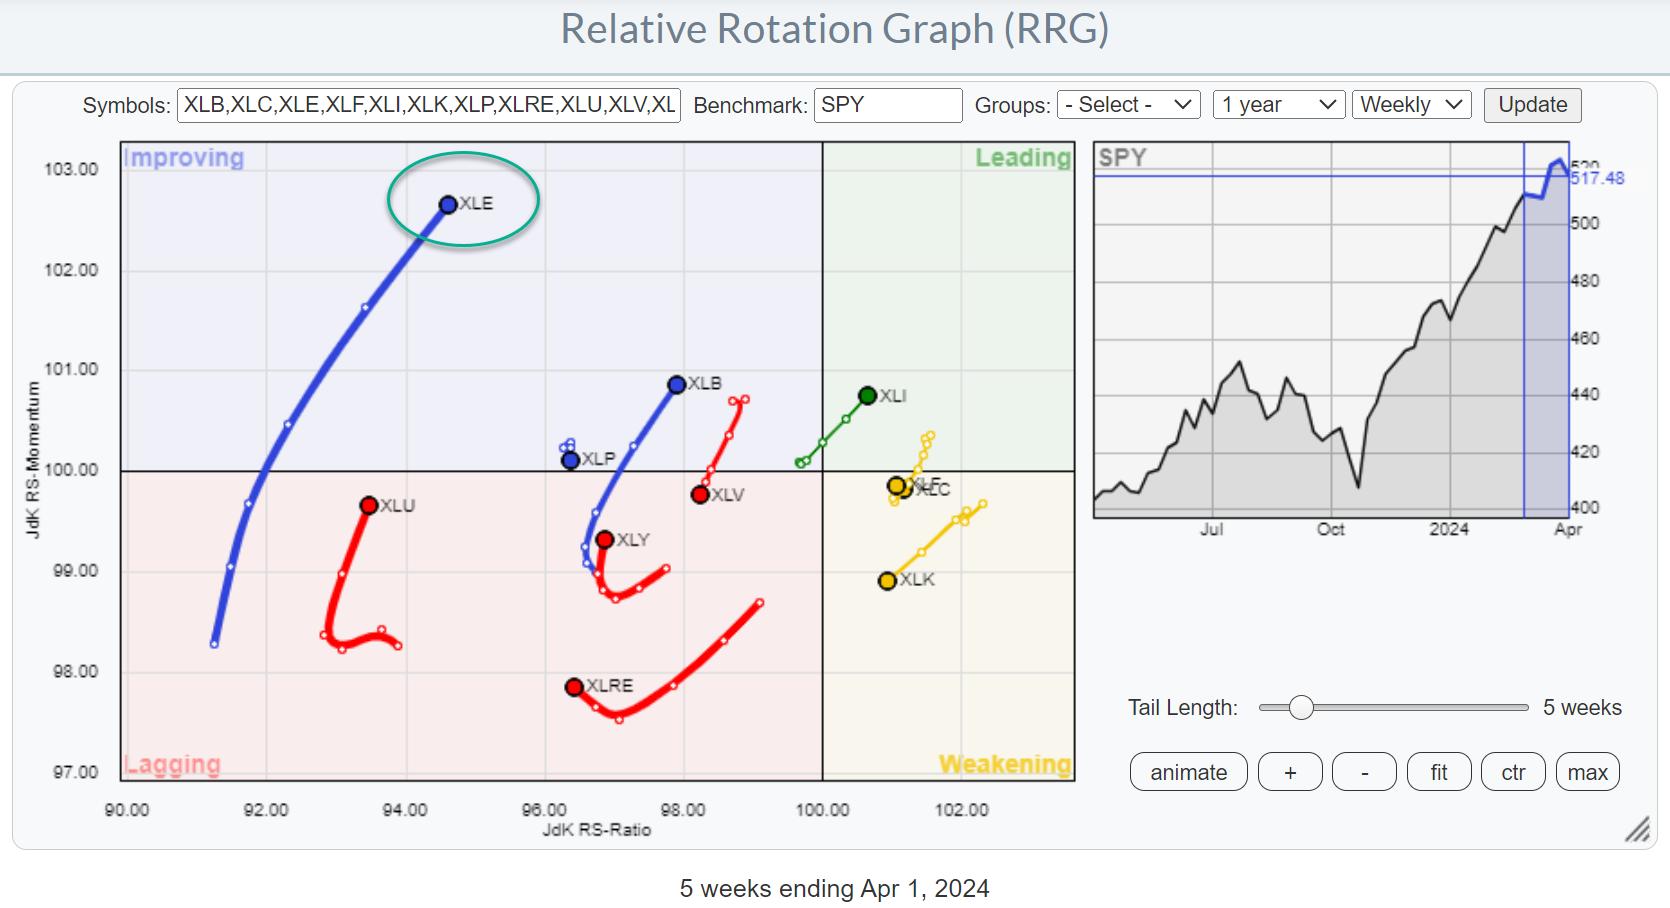
* Energy sector is breaking higher on price chart
* XLE's RRG tail is continuing to pick up steam
* The exploration & production industry is leading inside the energy sector
Strong Rotation on the Weekly RRG
For a few weeks now, the improvement in the energy sector (XLE)...
READ MORE
MEMBERS ONLY
When These Levels Break, The S&P 500 is Going to Explode Higher
by Julius de Kempenaer,
Senior Technical Analyst, StockCharts.com
KEY TAKEAWAYS
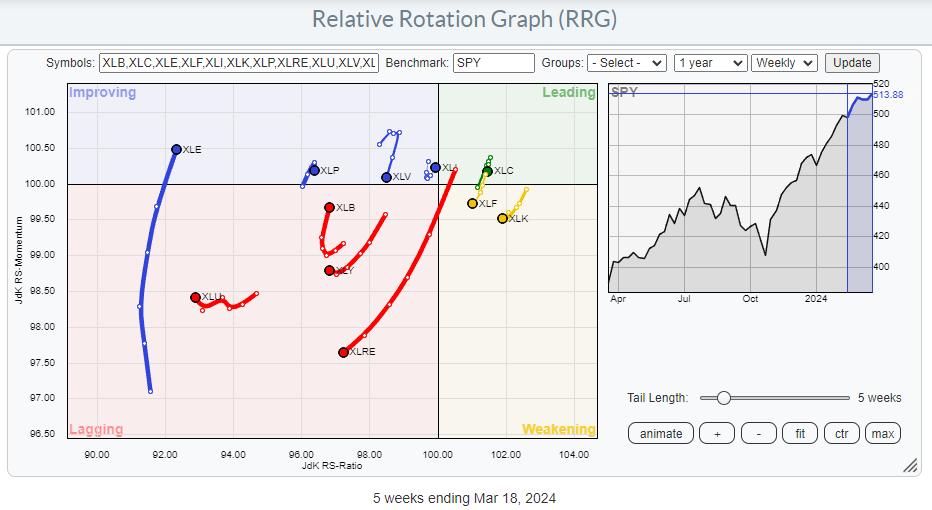
* Consumer Discretionary Beating Staples
* Sectors Pushing Against Major Resistance Levels
Summary
The Relative Rotation Graph for US Sectors for this week mainly shows a continuation of the rotations as they were underway last week.
XLB: This is moving from lagging into improving at a strong RRG-Heading, underscoring the...
READ MORE
MEMBERS ONLY
Energy: A Long-Term Turnaround in Relative Strength is Brewing
by Julius de Kempenaer,
Senior Technical Analyst, StockCharts.com
KEY TAKEAWAYS
* Energy sector showing relative strength in three timeframes
* The sector is nearing a heavy resistance area
* A long-term turnaround in relative strength appears to be underway
Energy Improving in Three Time Frames
Watching the sector rotation at the start of this week shows a continued improvement for the...
READ MORE
MEMBERS ONLY
Clear Split in NY FANG+ Universe Offers Pair Trading Opportunities
by Julius de Kempenaer,
Senior Technical Analyst, StockCharts.com
KEY TAKEAWAYS
* NYFANG+ Index at elevated levels in strong uptrend.
* New long positions are exposed to high risk.
* I found a pair trading opportunity within the NYFANG universe to avoid directional market risk.
It is no secret that the NYFANG+ Index is still in in incredible up-run after bottoming out...
READ MORE
MEMBERS ONLY
Sector Spotlight: Dominant Trend for Stocks Still UP
by Julius de Kempenaer,
Senior Technical Analyst, StockCharts.com
On this episode of StockCharts TV's Sector Spotlight, I separate the 11 sectors in the S&P 500 into Offensive, Defensive, and Sensitive, assessing their group rotational patterns to see if there is any alignment with the current technical condition of the S&P 500. After...
READ MORE
MEMBERS ONLY
SPY Uptrend Intact, But Mixed Sector Rotation Signals Hesitation
by Julius de Kempenaer,
Senior Technical Analyst, StockCharts.com
KEY TAKEAWAYS
* Looking at Risk ON / OFF through BETA
* RRG shows mixed rotations
* SPY Uptrend intact with limited downside risk
BETA
One of the Risk ON/OFF metrics I like to keep an eye on is BETA.
From Investopedia:
—systematic risk—
I have updated my spreadsheet with last year'...
READ MORE
MEMBERS ONLY
Sector Spotlight: EASY SCAN! Find Growth Names in Small-Caps
by Julius de Kempenaer,
Senior Technical Analyst, StockCharts.com
On this episode of StockCharts TV's Sector Spotlight, I start with an assessment of the daily and weekly charts for SPY, trying to put recent developments into perspective. Then, I go over various Relative Rotation Graphs slicing the market down into various-size segments, as well as growth and...
READ MORE
MEMBERS ONLY
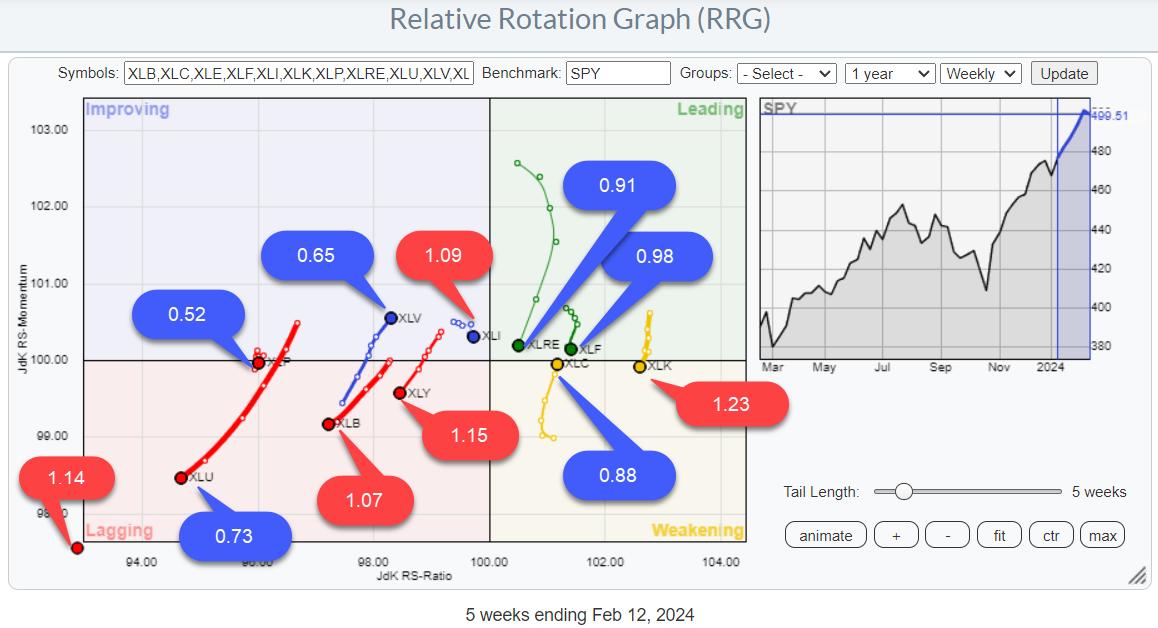
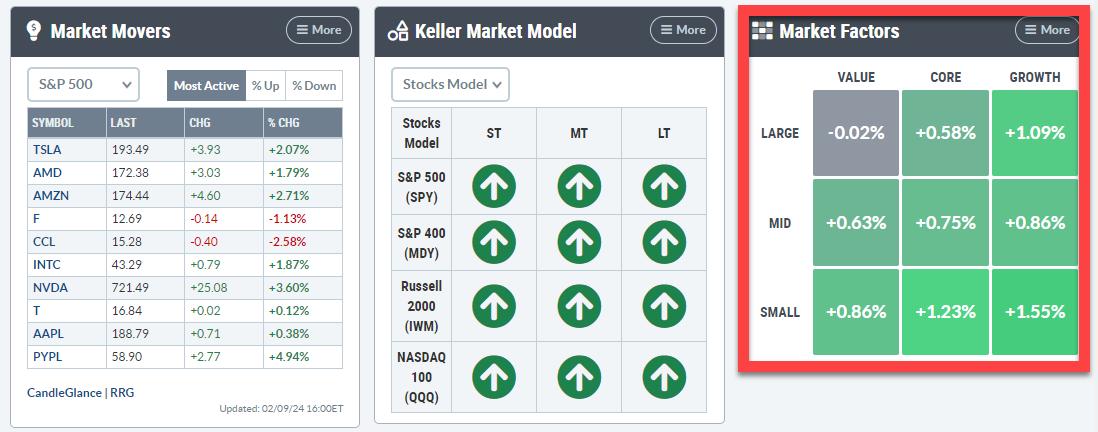
Visualizing the Market Factors Panel on RRG
by Julius de Kempenaer,
Senior Technical Analyst, StockCharts.com
KEY TAKEAWAYS
* Bring the New Market Factors Panel to a Relative Rotation Graph
* Same approach using different index family shows a different image
With the release of the new Panels feature on the StockCharts dashboard, there are a lot of ways that users of RRG charts can take advantage! Let&...
READ MORE
MEMBERS ONLY
Sector Spotlight: Stocks vs. Bonds -- Monthly Trends Revealed!
by Julius de Kempenaer,
Senior Technical Analyst, StockCharts.com
On this episode of StockCharts TV's Sector Spotlight, I review the monthly charts for January 2024, in combination with the Relative Rotation on the Monthly RRGs for asset classes and sectors. At asset class level, the preference for stocks over bonds remains clearly visible. Looking at the monthly...
READ MORE
MEMBERS ONLY
Discretionary vs. Discretionary, a Fierce Battle Under the Hood
by Julius de Kempenaer,
Senior Technical Analyst, StockCharts.com
KEY TAKEAWAYS
* Not all is what it looks like inside the Consumer Discretionary Sector
* Using Cap-weighted vs. Equal-Weighted Sectors on RRG reveals underlying differences
* Mega-cap Stocks are dragging XLY down
* Using a Simple Scan Leads to four interesting charts
Cap-Weighted vs. Equal-Weighted
Sometimes, you need to look a little further....
READ MORE