MEMBERS ONLY
Sector Spotlight: Energy & Tech's Opposite Seasonal Rotations
by Julius de Kempenaer,
Senior Technical Analyst, StockCharts.com
In this episode of StockCharts TV's Sector Spotlight, on this last day of July, I look at the expected seasonal patterns for the coming month of August and examine whether the current sector rotation, as seen on the Relative Rotation Graphs for any of the sectors, lines up...
READ MORE
MEMBERS ONLY
Surging Trucks Are Driving The Industrials Sector Higher
by Julius de Kempenaer,
Senior Technical Analyst, StockCharts.com
KEY TAKEAWAYS
* Industrials sector XLI broke to new highs and is on a strong rotational path on the Relative Rotation Graph
* Within the sector the groups "Commercial Vehicles & Trucks" and "Trucking" stand out
* These groups are taking over from Airlines and Construction which have been...
READ MORE
MEMBERS ONLY
Sector Spotlight: Sector Rotation Says Bull Market in Full Swing
by Julius de Kempenaer,
Senior Technical Analyst, StockCharts.com
In this episode of StockCharts TV's Sector Spotlight, using the sector rotation model, I make an assessment of the current economic phase and how that aligns with the current sector rotation and alignment of four macroeconomic indicators. Along the way, I also show you where you can find...
READ MORE
MEMBERS ONLY
Sector Spotlight: Latest Drop in US Dollar Sending Markets Higher
by Julius de Kempenaer,
Senior Technical Analyst, StockCharts.com
In this episode of StockCharts TV's Sector Spotlight, I address the recent drop in the US dollar and its effect on the US stock market. The asset class segment is then followed by a look at current sector rotation and the increasing number of stocks in the S&...
READ MORE
MEMBERS ONLY
Sector Spotlight Special: The Impact of Using Different Benchmarks for RRG!
by Julius de Kempenaer,
Senior Technical Analyst, StockCharts.com
In this special episode of StockCharts TV's Sector Spotlight, I address the impact of using different benchmarks on Relative Rotation Graphs and the opportunities for investors to adapt the use of RRGs in different circumstances.
This video was originally broadcast on July 15, 2023. Click anywhere on the...
READ MORE
MEMBERS ONLY
Low Vol-to-High Beta Stock Rotation is Surging
by Julius de Kempenaer,
Senior Technical Analyst, StockCharts.com
KEY TAKEAWAYS
* High BETA vs Low Vol Comparison as an alternative Risk ON/OFF metric
* SPHB:SPLV showing strength for High BETA stocks in all three time frames (M,W,D)
* Preference for High BETA confirms current sector rotation out of defensive sectors
In this week's episode of...
READ MORE
MEMBERS ONLY
What The HECK?! Can an Inverted Yield Curve Really Be Bullish?
by Julius de Kempenaer,
Senior Technical Analyst, StockCharts.com
In this episode of StockCharts TV'sThe Final Bar, guest host Julius de Kempenaer talks to Todd Gordon of TradingAnalysis.com. They cover a broad spectrum of topics, ranging from the big macro picture, to growth value rotation, to the current strength in the consumer discretionary. In the 3-in-3...
READ MORE
MEMBERS ONLY
Sector Spotlight: Sector Rotation Out of Defensive into Offensive
by Julius de Kempenaer,
Senior Technical Analyst, StockCharts.com
In this episode of StockCharts TV's Sector Spotlight, I go over the current status of asset class rotation, noting the ongoing strength for stocks vis-a-vis other asset classes. After that, he moves to sector rotation and uses the breakdown of the sector universe into offensive, defensive, and sensitive...
READ MORE
MEMBERS ONLY
Sector Spotlight: Two Sectors Hitting New All-Time Closing High
by Julius de Kempenaer,
Senior Technical Analyst, StockCharts.com
In this episode of StockCharts TV's Sector Spotlight, I assess the monthly charts following the end of June. Bond-related asset classes remain vulnerable, while commodities are struggling to remain afloat. The stock/bond ratio is now sending a very clear signal. In US sectors, all eyes are on...
READ MORE
MEMBERS ONLY
Small-Cap Value Stocks Unexpected Driver for Market
by Julius de Kempenaer,
Senior Technical Analyst, StockCharts.com
KEY TAKEAWAYS
* Rotation continues in favor of growth
* Large Cap Segments Generally Beating Value
* Small-Cap Value Stocks Stand Out
Growth, Value, Size
It has been a while since I addressed the rotations of Growth vs. Value and their different size variations. The RRG above shows these rotations on the weekly...
READ MORE
MEMBERS ONLY
Sector Spotlight: Stocks Lining Up for a Strong July
by Julius de Kempenaer,
Senior Technical Analyst, StockCharts.com
In this episode of StockCharts TV's Sector Spotlight, I look ahead to the month of July and what we can expect based on 20 years of seasonal performance. I then align that information with the current rotations for the various sectors in order to find interesting opportunities on...
READ MORE
MEMBERS ONLY
Sector Spotlight: Bonds Surrender to Strong US Stock Market
by Julius de Kempenaer,
Senior Technical Analyst, StockCharts.com
In this episode of StockCharts TV's Sector Spotlight, I take a look at Asset Class rotations, highlighting the current strength of US stocks in comparison to Bonds. In the Sector Rotation segment, I address the differences between cap-weighted and equal-weighted sectors and find some interesting stocks inside the...
READ MORE
MEMBERS ONLY
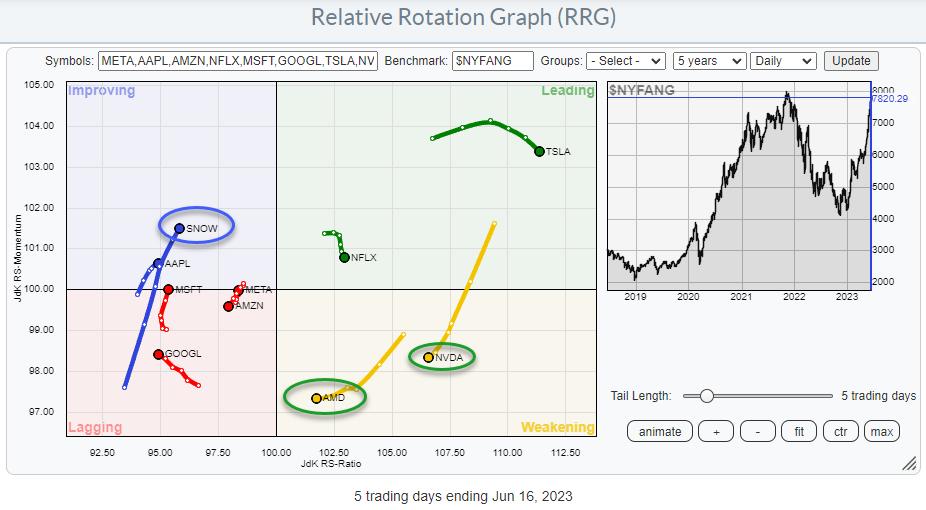
Is There Big Tech Trouble in FANG(sta's) Paradise?
by Julius de Kempenaer,
Senior Technical Analyst, StockCharts.com
Near-Term Rotations
The Relative Rotation Graph above shows the stock rotation inside the NYFANG index.
Semiconductor stocks AMD and NVDA have been the leaders over the past weeks/months, but they are now rolling over into weakening and heading toward the lagging quadrant. TSLA and NFLX are still inside the...
READ MORE
MEMBERS ONLY
Sector Spotlight: Remarkably Strong Sector Rotation Out of Defense
by Julius de Kempenaer,
Senior Technical Analyst, StockCharts.com
In this episode of StockCharts TV's Sector Spotlight, I present an in-depth assessment of the current state of rotation in asset classes and sectors, and also share some background on where the split into three groups -- offensive, defensive, and sensitive -- is coming from. Spoiler alert: The...
READ MORE
MEMBERS ONLY
Sector Spotlight: May Was NOT a Good Month for Stocks
by Julius de Kempenaer,
Senior Technical Analyst, StockCharts.com
In this episode of StockCharts TV's Sector Spotlight, wrapping up the month of May, I look back at developments in May for Asset Classes and Sectors. Using Monthly Relative Rotation Graphs and monthly charts, I talk you through the good and the not-so-good parts of the markets, starting...
READ MORE
MEMBERS ONLY
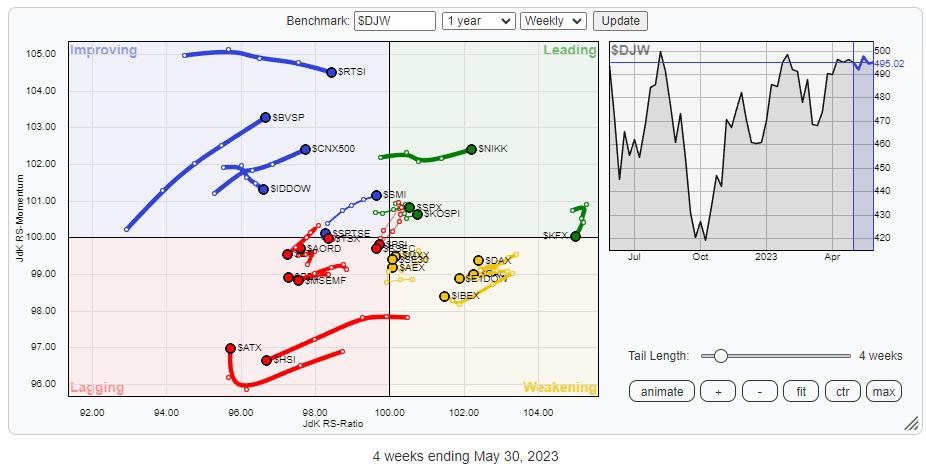
How To Benefit From a Big Rotation in Asian Markets
by Julius de Kempenaer,
Senior Technical Analyst, StockCharts.com
It's been a while since we discussed international stock markets.
Above is the Relative Rotation Graph that shows the rotation for a group of international stock market indices against $DJW, The Dow Jones Global Index. Looking at this, chart I see two big(ger) rotations that are probably...
READ MORE
MEMBERS ONLY
Sector Spotlight: Will Tech Take a Seasonal Break in June?
by Julius de Kempenaer,
Senior Technical Analyst, StockCharts.com
In this episode of StockCharts TV's Sector Spotlight, wrapping up the month of May, I dive into the seasonal characteristics of the markets. I start with a quick look back at seasonal rotation during the current month, then assess the seasonal expectation for the S&P 500...
READ MORE
MEMBERS ONLY
Sector Spotlight: Big Bases in Technology Support SPY
by Julius de Kempenaer,
Senior Technical Analyst, StockCharts.com
In this episode of StockCharts TV's Sector Spotlight, I look at sector rotation while breaking down the universe into offensive, defensive, and sensitive sectors. I then zoom in on the groups that make up the technology sector and some of the stocks in them, where I find a...
READ MORE
MEMBERS ONLY
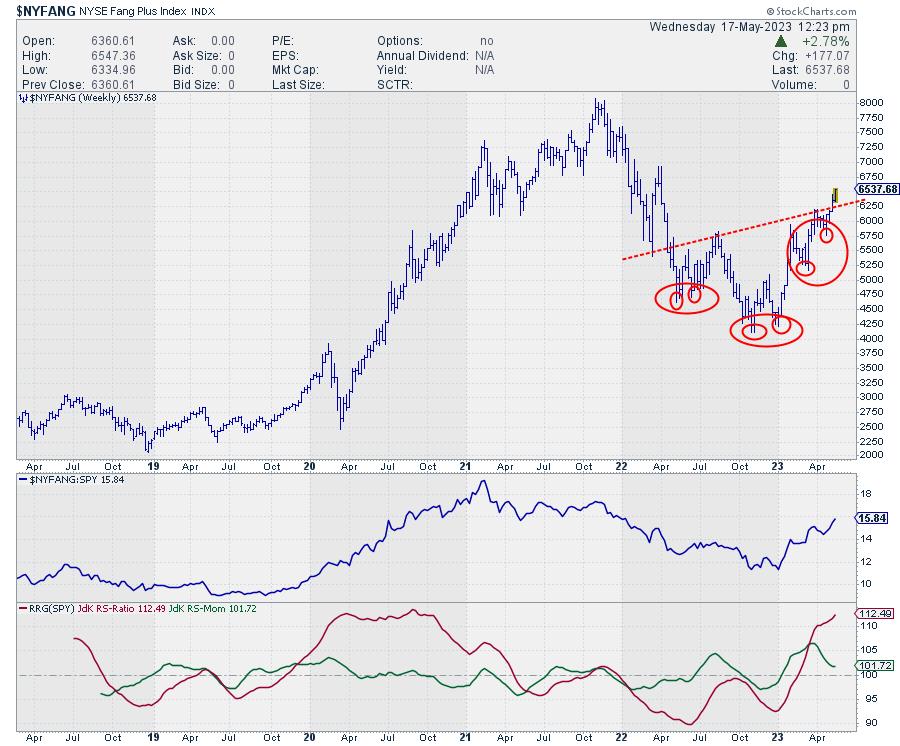
Superior NYFANG+ Performance Leaves S&P 500 in the dust
by Julius de Kempenaer,
Senior Technical Analyst, StockCharts.com
The NYSE FANG+ index $NYFANG holds ten of the largest stocks in the US.
1. Alphabet - GOOGL
2. Snowflake - SNOW
3. META Platforms - META
4. NVIDIA Corp - NVDA
5. Amazon - AMZN
6. Microsoft - MSFT
7. Advanced Micro Devices - AMD
8. Apple - AAPL...
READ MORE
MEMBERS ONLY
Sector Spotlight: GOOGL and Double Benchmark RRGs
by Julius de Kempenaer,
Senior Technical Analyst, StockCharts.com
In this week's edition of StockCharts TV's Sector Spotlight, I take a look at developments on asset class level and more specifically, the USD and BTC. I then compare current cap-weighted sector rotation with its equal-weight equivalent to find some interesting differences. Finally, I re-introduce the...
READ MORE
MEMBERS ONLY
Sector Spotlight: Sensitive Sectors Showing Strength
by Julius de Kempenaer,
Senior Technical Analyst, StockCharts.com
After looking at the Sector Rotation Model, Seasonality, and Monthly charts in recent episodes, it is time for an assessment of current market rotation again. In this week's edition of StockCharts TV's Sector Spotlight, I take a look at the rotations for asset classes on weekly...
READ MORE
MEMBERS ONLY
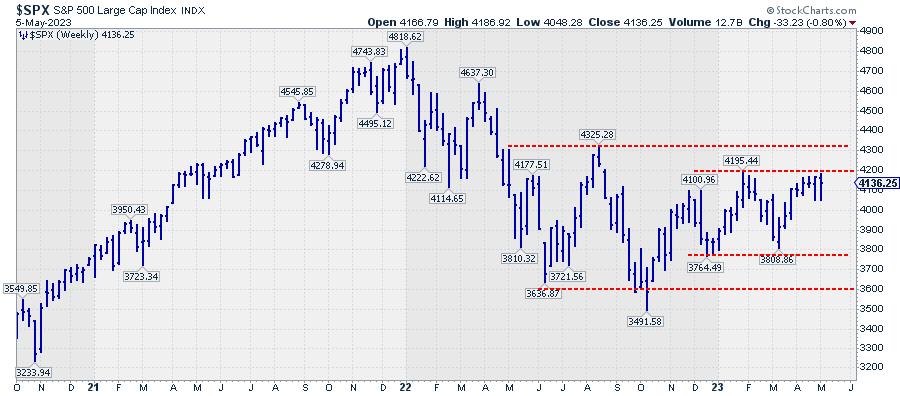
Market Holds Up Well as Money Rotates Out of Offensive Sectors
by Julius de Kempenaer,
Senior Technical Analyst, StockCharts.com
While the S&P 500 struggles to push beyond its overhead resistance in the area around 4200, money is rotating out of offensive sectors into defensive AND sensitive.
On the weekly chart, two trading ranges are starting to emerge. The first one is the more narrow one, between roughly...
READ MORE
MEMBERS ONLY
Sector Spotlight: Strong Seasonal Sector Rotation
by Julius de Kempenaer,
Senior Technical Analyst, StockCharts.com
This a packed episode of StockCharts TV's Sector Spotlight; as you'll notice from the different setup, Julius recorded IN the studio at the StockCharts.com headquarters! With the show on hiatus last and this week being the first Tuesday of the month, Julius covers both the...
READ MORE
MEMBERS ONLY
The Birth of Ralph Acampora's Brainchild; ARGoN
by Julius de Kempenaer,
Senior Technical Analyst, StockCharts.com
This journey started back in October 2022. After three years of no traveling and four years not having been to the US, it was finally possible to have an in-person event again, or at least partially.
StockCharts.com has been hosting its bi-annual conference, "ChartCon," since 2011. My...
READ MORE
MEMBERS ONLY
Sector Spotlight: Sector Rotation Suggests Market Ready to Move
by Julius de Kempenaer,
Senior Technical Analyst, StockCharts.com
On this episode of StockCharts TV's Sector Spotlight, I evaluate the current state of the Sector Rotation Model. Each quarter, I take the elements of the Model, as described by Sam Stovall, and use the charts of four macroeconomic indicators and the monthly RRG to determine where the...
READ MORE
MEMBERS ONLY
Sector Spotlight: Surge in Oil Revives Rotation to Energy Stocks
by Julius de Kempenaer,
Senior Technical Analyst, StockCharts.com
On this episode of StockCharts TV's Sector Spotlight, I put the spotlight on Energy, starting off with a look at the rotation of various commodity groups and a focus on the group of Energy-related commodities. Following this assessment, I move to the Energy sector and the stocks inside...
READ MORE
MEMBERS ONLY
Sensitive Sectors are Holding the Keys to Unlock Upside Potential
by Julius de Kempenaer,
Senior Technical Analyst, StockCharts.com
The daily RRG for US sectors is showing an interesting picture. Out of all eleven sectors, only four are on a negative trajectory.
Industrials is inside the lagging quadrant at a very short tail, and more or less in a static position, which means that the sector is in a...
READ MORE
MEMBERS ONLY
Sector Spotlight: Bonds & Financials Crucial for Promising S&P 500
by Julius de Kempenaer,
Senior Technical Analyst, StockCharts.com
The first Tuesday of the month means monthly charts in this episode of StockCharts TV's Sector Spotlight. I start with an overview of long-term trends in asset classes, including a look at the USD and BTC and the relationship between stocks and bonds. I then move on to...
READ MORE
MEMBERS ONLY
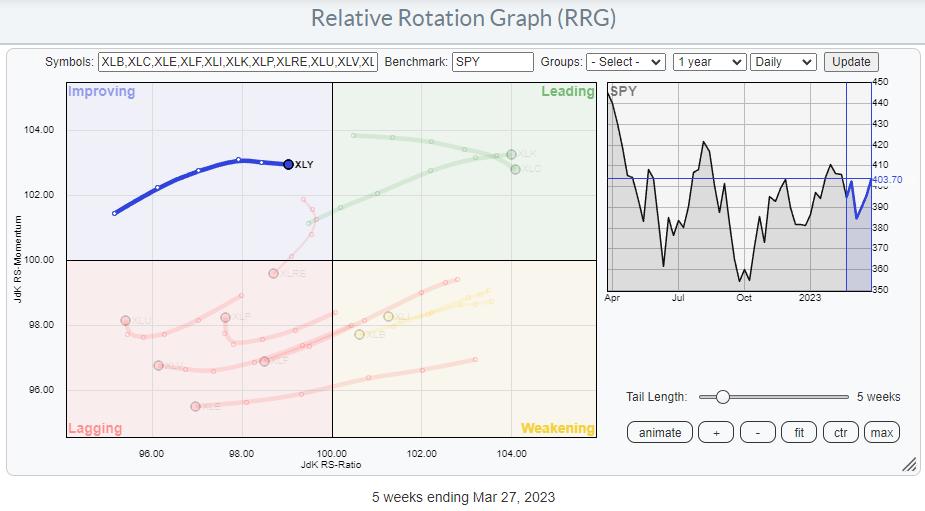
When You See Amazon Turning Around, Beautiful Things Start to Happen
by Julius de Kempenaer,
Senior Technical Analyst, StockCharts.com
On the weekly RRG, the tail for XLY, Consumer Discretionary, is inside the improving quadrant and heading at an RRG-Heading of roughly 90 degrees. Not ideal; somewhere between 0-90 is stronger, as it indicates that the trend is still picking up speed, but not wrong either.
With only two sectors...
READ MORE
MEMBERS ONLY
Sector Spotlight: Stocks Entering Year's Strongest Month
by Julius de Kempenaer,
Senior Technical Analyst, StockCharts.com
In this episode of StockCharts TV's Sector Spotlight, for this last Tuesday of the month, I take a look at seasonality as the S&P 500 enters the (historically speaking) strongest month of the year. Two sectors are showing meaningful odds for out-performance in April, and one...
READ MORE
MEMBERS ONLY
Sector Spotlight: When Stocks are Not Marked Down on Bad News
by Julius de Kempenaer,
Senior Technical Analyst, StockCharts.com
In this episode of StockCharts TV's Sector Spotlight, I talk you through my assessment of what's going on in terms of sector rotation and how that connects with my observations of the S&P 500 chart. Following that assessment of current market behavior, I then...
READ MORE
MEMBERS ONLY
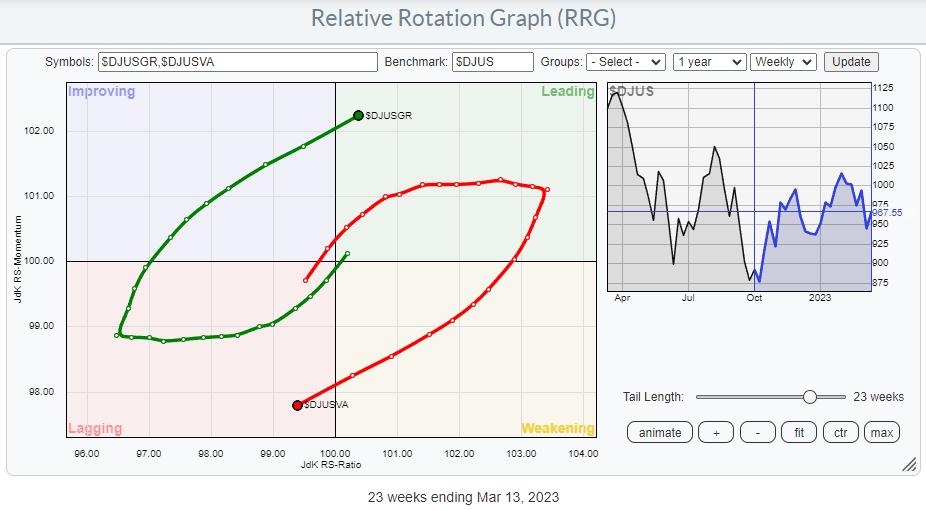
Fearless Rotation Back to Growth Stocks Unfolding Now
by Julius de Kempenaer,
Senior Technical Analyst, StockCharts.com
Since late 2021, value stocks have been dominating Growth. The $DJUSGR:$SJUSVA ratio rode the way down together with $SPX. I highlighted this development in a few articles back in 2022.
At the moment, that situation seems to be reversing. The Relative Rotation Graph above shows the Growth Value rotation...
READ MORE
MEMBERS ONLY
Sector Spotlight: Watch How Technology Sector Leads on RRG
by Julius de Kempenaer,
Senior Technical Analyst, StockCharts.com
In this episode of StockCharts TV's Sector Spotlight, after two episodes looking at longer term trends, first in seasonality and then in price trends on the monthly charts, I talk you through what's happening in current rotations for asset classes and sectors. We look at the...
READ MORE
MEMBERS ONLY
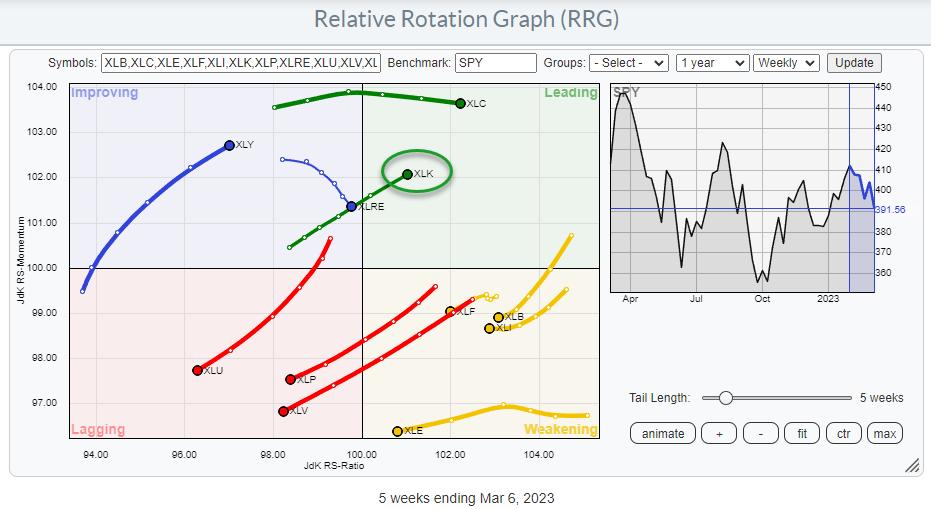
SPY Dips But Tech Is Now Back On Track
by Julius de Kempenaer,
Senior Technical Analyst, StockCharts.com
Right now, it seems the most enticing tail on the relative rotation graph for US sectors is that of XLK, the technology sector. XLK has been in a strong RRG heading for a few weeks already, crossing over into the leading quadrant last week, and has continued to push further...
READ MORE
MEMBERS ONLY
Sector Spotlight: Strong Rotation to High Beta Sectors
by Julius de Kempenaer,
Senior Technical Analyst, StockCharts.com
In this episode of StockCharts TV's Sector Spotlight, for this first Tuesday of the month, I take a look at the completed monthly charts for February for both Asset Classes and Stock sectors. While evaluating last month's performance for the individual sectors, I include the February...
READ MORE
MEMBERS ONLY
Sector Spotlight: Market Entering Period of Strong Seasonality
by Julius de Kempenaer,
Senior Technical Analyst, StockCharts.com
In this episode of StockCharts TV's Sector Spotlight, I assess the current state of sector rotation, highlighting the ongoing rotation out of defense in favor of more offensive and economically-sensitive sectors. As it is the last Tuesday of the month, seasonality make ups a big part of the...
READ MORE
MEMBERS ONLY
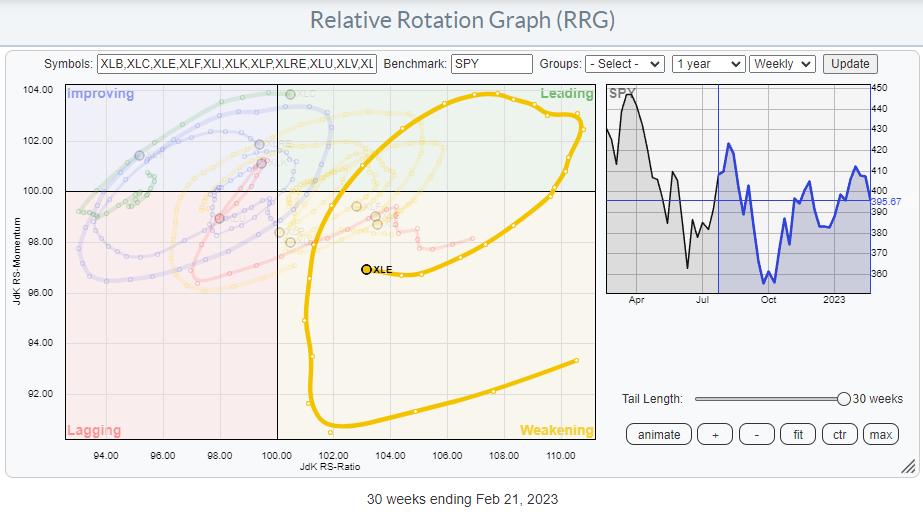
Looks Like a Major Shift in Leadership in the Energy Sector
by Julius de Kempenaer,
Senior Technical Analyst, StockCharts.com
The Energy Sector Seems to be Coming Back to Life
On the Relative Rotation Graph (RRG), a long tail is visible starting in July 2022, traveling from weakening back up towards and into leading in October 2022. After another rotation through the leading quadrant, the tail for XLE crossed into...
READ MORE
MEMBERS ONLY
Ongoing Sector Rotation Out Of Defense Into Technology
by Julius de Kempenaer,
Senior Technical Analyst, StockCharts.com
The Relative Rotation Graph for US sectors continues to show a shift out of defensive sectors into more offensive and economically sensitive ones.
The improvement for XLC (communication services, XLY (consumer discretionary), and XLK (technology) continues and is visible inside the improving quadrant. All three tails are travelling at a...
READ MORE
MEMBERS ONLY
Sector Spotlight: This Sector is On Fire
by Julius de Kempenaer,
Senior Technical Analyst, StockCharts.com
In this episode of StockCharts TV's Sector Spotlight, I look at the current state of sector rotation, highlighting the most important rotations from a positive as well as a negative perspective. After that, I zoom in on the Communication Services sector and highlight seven individual stocks; four worth...
READ MORE
MEMBERS ONLY
Sector Spotlight: Some Valentine Love for the Tech Sector
by Julius de Kempenaer,
Senior Technical Analyst, StockCharts.com
In this episode of StockCharts TV's Sector Spotlight, for this first week of February, I address high level asset-class rotation, then step into sectors. From the sector level, I use Relative Rotation Graphs, in combination with the scan engine, to drill down into industries and individual stocks.
This...
READ MORE