MEMBERS ONLY
Sector Spotlight: Stocks Rally, But Monthly Trend Remains Down
by Julius de Kempenaer,
Senior Technical Analyst, StockCharts.com
It's the 150th episode of StockCharts TV's Sector Spotlight! This week, I tackle the long-term trends in asset classes and sectors, looking at the monthly Relative Rotation Graphs and the monthly price charts. Despite the recent rally in stocks and the strong recovery for most...
READ MORE
MEMBERS ONLY
Strong Rotation to Value Stocks
by Julius de Kempenaer,
Senior Technical Analyst, StockCharts.com
Over the last 13 weeks, a notable shift from growth to value stocks has taken place. After a rotation from leading, through weakening, into lagging between April and mid-October, the tail for value stocks has re-entered the leading quadrant at a strong RRG-Heading.
Generally, value stocks are...
READ MORE
MEMBERS ONLY
SPY Rally While Technology and Discretionary Remain On Negative RRG-Heading
by Julius de Kempenaer,
Senior Technical Analyst, StockCharts.com
I don't like it when parts of a puzzle don't match. You just don't get a clear picture.
As participants in the markets, we are trying to solve the puzzle of the markets every day/week/month, and at the start of every new...
READ MORE
MEMBERS ONLY
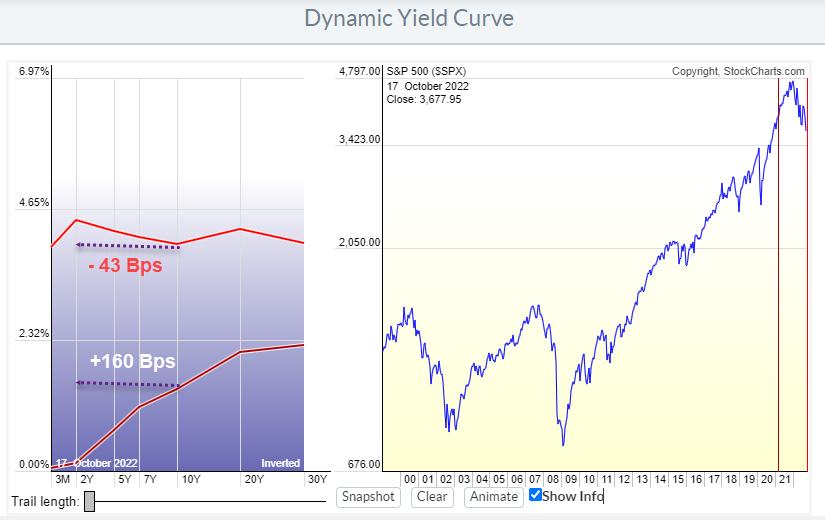
Sector Spotlight: Inverted Yield Curve Looms Over Stock Market
by Julius de Kempenaer,
Senior Technical Analyst, StockCharts.com
After one week of hiatus, I'm back with a new episode of StockCharts TV's Sector Spotlight. I'll be catching up with a refresher on asset class rotation, as well as sector rotation. In the AC segment, I point to the still-inverted yield curve...
READ MORE
MEMBERS ONLY
About That Yield Curve Inversion
by Julius de Kempenaer,
Senior Technical Analyst, StockCharts.com
In March 2021, lending money to the US Government for ten years would give you a return of around 1.7%/ann over the next 10 years. Lending money to the government for 2 years at the same time would give you roughly 0.1%/ann for the next 2...
READ MORE
MEMBERS ONLY
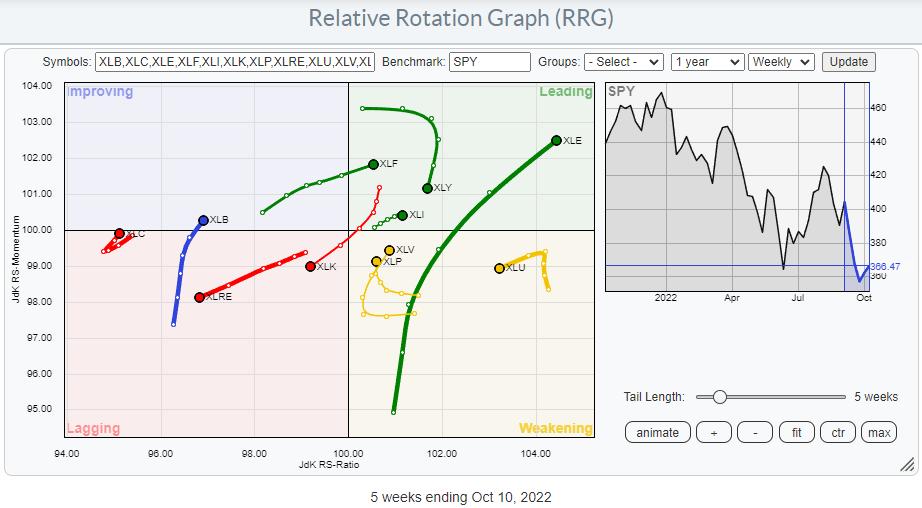
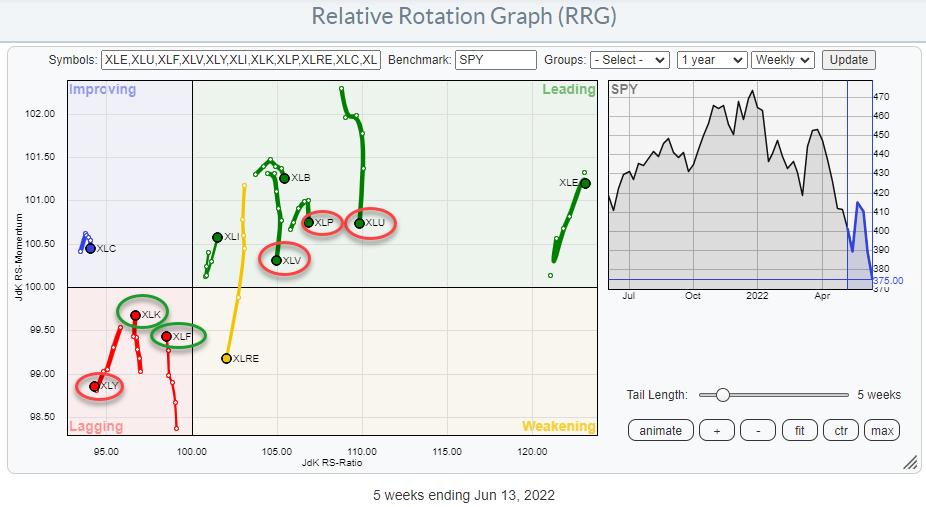
Strong Sector Rotation To Financials, But Will It Be Enough to Turn the Market Back Up?
by Julius de Kempenaer,
Senior Technical Analyst, StockCharts.com
On the weekly Relative Rotation Graph, the tail for XLF has just crossed over into the leading quadrant while keeping up its rising relative momentum. This makes the financials sector one of the leading sectors in the market at the moment.
In the past week, XLF picked up 2.62%...
READ MORE
MEMBERS ONLY
Sector Spotlight: Stocks and Bonds Both Breaking Major Support Levels
by Julius de Kempenaer,
Senior Technical Analyst, StockCharts.com
In this week's edition of StockCharts TV's Sector Spotlight, for the first show of October, I address long-term trends using monthly charts. In line with the longer-term perspective of this show, I start both the asset class and the sector rotation segments with a...
READ MORE
MEMBERS ONLY
Sector Spotlight: Sector Rotation Back in Line
by Julius de Kempenaer,
Senior Technical Analyst, StockCharts.com
In this week's edition of StockCharts TV's Sector Spotlight, I review the current rotations for asset classes, where we find continuing strength for the US dollar and fixed-income-related asset classes, while stocks are rotating back to the lagging quadrant. As it is the last...
READ MORE
MEMBERS ONLY
Stocks Sinking Faster Than Dollar Can Rise -- Time to Broaden Your Horizon
by Julius de Kempenaer,
Senior Technical Analyst, StockCharts.com
When markets across the world and all asset classes are dropping, it's time to put things into (international) perspective and see if any alternatives to US stocks are available.
I always keep an eye on this Relative Rotation Graph, which holds a group of international stock market indexes...
READ MORE
MEMBERS ONLY
Sector Spotlight: This is Still a Bear Market, Right?
by Julius de Kempenaer,
Senior Technical Analyst, StockCharts.com
In this week's edition of StockCharts TV's Sector Spotlight, at asset class level, I highlight the strength of the USD, which also plays a role in the weakness of BTC. Stocks and bonds did not move much last week, while commodities seem to be turning. Sector...
READ MORE
MEMBERS ONLY
Two Things I Don't Expect to See in a Bear Market
by Julius de Kempenaer,
Senior Technical Analyst, StockCharts.com
I seriously hope that I was able to make clear in last Tuesday's Sector Spotlight that the market ($SPX) is still on shaky grounds and certainly not (back) in an uptrend. Sure, I mentioned the short-term improvement, which was undeniably there. But also that the upside was...
READ MORE
MEMBERS ONLY
Consumer Discretionary Picking Up Strength
by Julius de Kempenaer,
Senior Technical Analyst, StockCharts.com
On the weekly Relative Rotation Graph, the consumer discretionary sector continues to improve and is now pushing further into the leading quadrant. It is now the sector with the highest JdK RS-Momentum reading. The tail length is fairly long compared to the other tails in the universe. All in...
READ MORE
MEMBERS ONLY
Sector Spotlight: Money Moving Back to XLY and Bitcoin
by Julius de Kempenaer,
Senior Technical Analyst, StockCharts.com
In this week's edition of StockCharts TV's Sector Spotlight, I start with an overview of the current asset class rotation, using daily and weekly Relative Rotation Graphs. In this segment, I replace VNQ (real estate) with BTC, which better represents the asset class landscape, as Real...
READ MORE
MEMBERS ONLY
Sector Spotlight: 6/11 Sectors in Downtrend on Monthly Chart
by Julius de Kempenaer,
Senior Technical Analyst, StockCharts.com
In this week's edition of StockCharts TV's Sector Spotlight, for the first Tuesday of September, I dive into the monthly chart, which was completed last Thursday. We kick off with a view of sector rotation using the newly added monthly time frame on Relative Rotation Graphs;...
READ MORE
MEMBERS ONLY
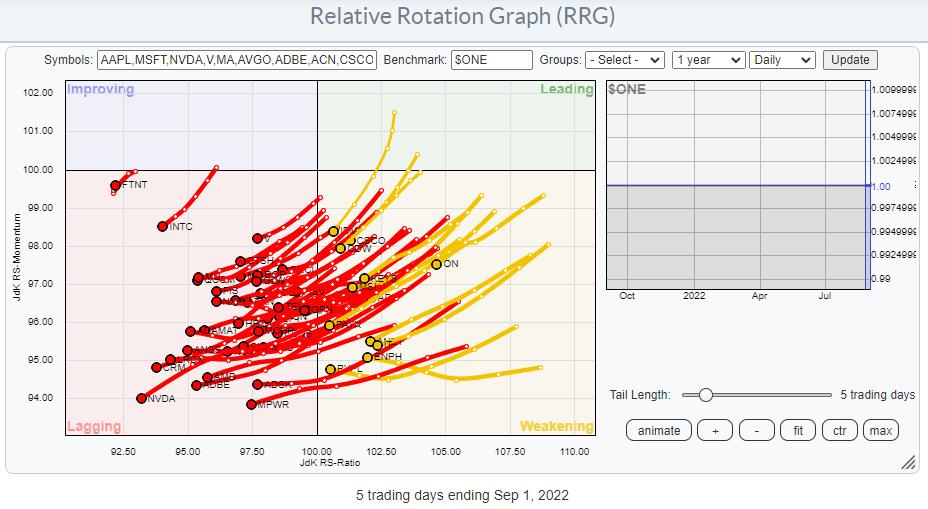
Inside Tech, It's Really AAPL vs. MSFT
by Julius de Kempenaer,
Senior Technical Analyst, StockCharts.com
Plotting the components of the Information Technology Sector against $ONE provides us with a sobering picture. Pretty much every single stock in that index is in a downtrend, inside lagging, and/or inside weakening (and very close to entering lagging).
Plotting that same graph on a weekly timeframe shows almost...
READ MORE
MEMBERS ONLY
Sector Spotlight: Weak Sector Rotation Puts $SPX on Track for 3900
by Julius de Kempenaer,
Senior Technical Analyst, StockCharts.com
In this week's edition of StockCharts TV's Sector Spotlight, I look at seasonality and try to align the theoretical expectations for the relative performance of sectors against the S&P 500 going into September with the current reality as it is playing out on the...
READ MORE
MEMBERS ONLY
Don't Even Think About Buying... (This Sector)
by Julius de Kempenaer,
Senior Technical Analyst, StockCharts.com
Staying out of a sector can be as important as being in the right sector. This is particularly true for the Communication Services Sector, and has been for a long time already.
The Relative Rotation Graph above shows the rotation over the last 30 weeks, starting the week of 1/...
READ MORE
MEMBERS ONLY
Sector Spotlight: Rotation to Utilities Signals Caution for S&P 500
by Julius de Kempenaer,
Senior Technical Analyst, StockCharts.com
In this week's edition of StockCharts TV's Sector Spotlight, I share my thoughts on potential developments for the S&P 500. First, from an asset allocation perspective, I focus on the development of the USD and interest rates in relation to the stock market. Then,...
READ MORE
MEMBERS ONLY
Combining RRG with the Turtle Soup Scan is Now More Powerful
by Julius de Kempenaer,
Senior Technical Analyst, StockCharts.com
Since my introductory article on the topic, 2018's "Combining Relative Rotation Graphs and the "Turtle Soup" setup", I have mentioned and used this strategy a few times in my articles and analyses. The main goal has been to combine the power of RRG and...
READ MORE
MEMBERS ONLY
Sector Spotlight: End of Downtrend ≠ New Uptrend
by Julius de Kempenaer,
Senior Technical Analyst, StockCharts.com
In this week's edition of StockCharts TV's Sector Spotlight, I take a look at recent rotations in asset classes and sectors. The recent strength for stocks over bonds at asset class level is clear, but the rotational picture for the weekly and daily time frames is...
READ MORE
MEMBERS ONLY
Only Two Sectors are Leading the Charge
by Julius de Kempenaer,
Senior Technical Analyst, StockCharts.com
On the Relative Rotation Graph for US sectors, there are only two sectors that are leading the market higher. Not surprisingly, these are growth-related sectors, specifically XLK and XLY, which together make up 40% of the market capitalization of the S&P 500 index.
In last Tuesday'...
READ MORE
MEMBERS ONLY
Sector Spotlight: Sectors Kissing Resistance
by Julius de Kempenaer,
Senior Technical Analyst, StockCharts.com
In this week's edition of StockCharts TV's Sector Spotlight, I start with a look at Growth/Value and Size (Large-, Mid-, and Small-Cap) rotations. After that, I take an extensive look at the rotations of Offensive, Defensive and Sensitive sectors and their individual charts. The...
READ MORE
MEMBERS ONLY
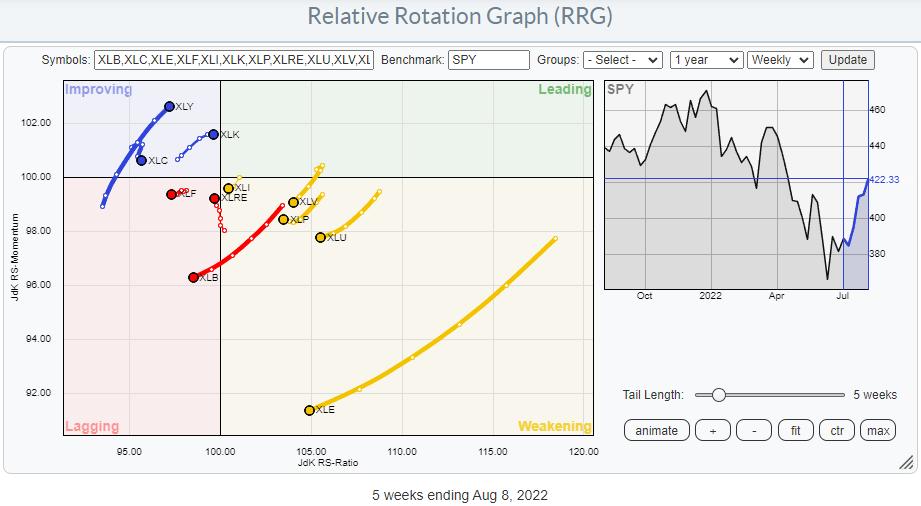
Disconnected EW Sector Rotation Offers Opportunities
by Julius de Kempenaer,
Senior Technical Analyst, StockCharts.com
From time to time, I compare the rotations of the SPDR sectors that we usually use with their EW counterparts.
The first RRG below shows the rotations for the SPDR sector spiders (cap-weighted). The second RRG shows the rotations of the Equal Weight sectors. In both, the Energy sector...
READ MORE
MEMBERS ONLY
Sector Spotlight: Downside Risk Beats Upside Potential
by Julius de Kempenaer,
Senior Technical Analyst, StockCharts.com
In this week's edition of StockCharts TV's Sector Spotlight, I start with a look at the current state of Sector Rotation in US stocks. (Normally, I review seasonal patterns in sectors every last Tuesday of the month, but, last week, that segment had to make place...
READ MORE
MEMBERS ONLY
Are You a Short-Term Trader? Watch This!
by Julius de Kempenaer,
Senior Technical Analyst, StockCharts.com
Relative Rotation Graphs (RRG) were introduced on StockCharts.com in July 2014. Since then, we have had the possibility to render the charts using weekly or daily data. Primarily, I think, because those were the time frames I was, and am, using most of the time for myself and in...
READ MORE
MEMBERS ONLY
Sector Spotlight: Bouncing Bonds and Intraday RRGs
by Julius de Kempenaer,
Senior Technical Analyst, StockCharts.com
This edition of StockCharts TV's Sector Spotlight marks an important milestone in the life of RRG on StockCharts.com. Following many user requests, the latest release of new functionalities and improvements (Bainbridge) of the website includes the support for intraday time frames on Relative Rotation Graphs. This addition...
READ MORE
MEMBERS ONLY
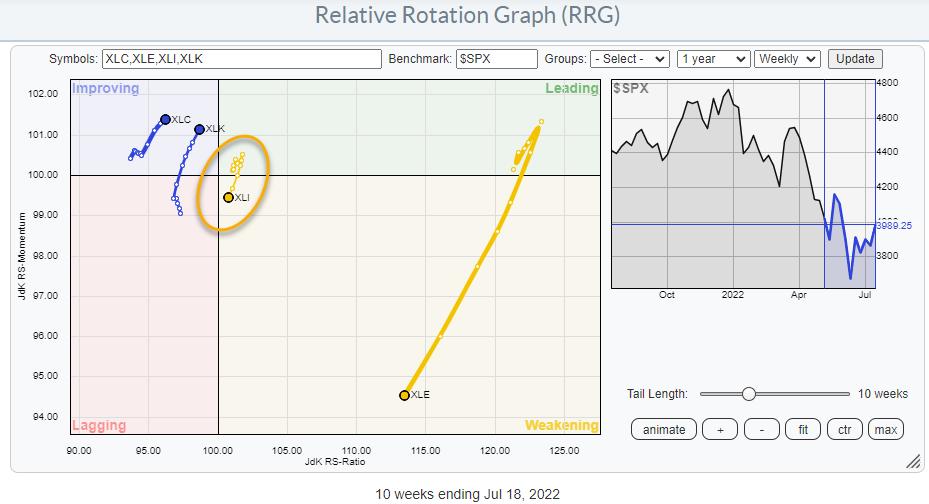
5 Interesting Industries In Industrials
by Julius de Kempenaer,
Senior Technical Analyst, StockCharts.com
In this article, I'd like to dig a bit deeper into the Industrial sector.
Starting at the sector level, we find the tail for XLI inside the weakening quadrant and moving towards lagging. So definitely not one of the better sectors. As a matter of fact, it'...
READ MORE
MEMBERS ONLY
Sector Spotlight: Growth Takes Over (for Now)
by Julius de Kempenaer,
Senior Technical Analyst, StockCharts.com
In this edition of StockCharts TV's Sector Spotlight, I assess the current rotation in asset classes and sectors, highlighting the rotation for commodities, which are going through a setback but are likely to come back as the leading asset class. In equity sectors, I'm seeing an...
READ MORE
MEMBERS ONLY
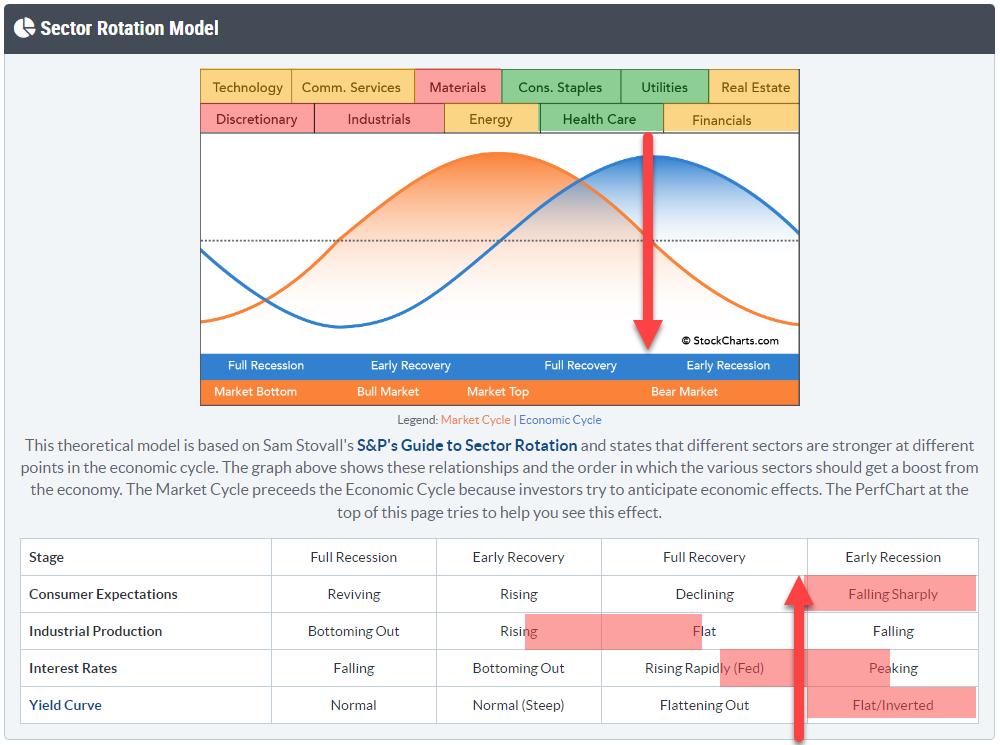
Sector Rotation (Model) vs Seasonality
by Julius de Kempenaer,
Senior Technical Analyst, StockCharts.com
Those of you who regularly watch Sector Spotlight on StockchartsTV will know that I have a few segments that come back on a regular basis.
Every last Tuesday of the month I discuss the seasonality for sectors going into the new month to see if the historical seasonal pattern aligns...
READ MORE
MEMBERS ONLY
Sector Spotlight: Sector Rotation Model Says It's Not Over Yet
by Julius de Kempenaer,
Senior Technical Analyst, StockCharts.com
In this edition of StockCharts TV's Sector Spotlight, after an update on the current rotations for various asset classes, I look at the sector rotation model and and try to make an assessment on where, and which phase, we currently are in the market cycle. I evaluate the...
READ MORE
MEMBERS ONLY
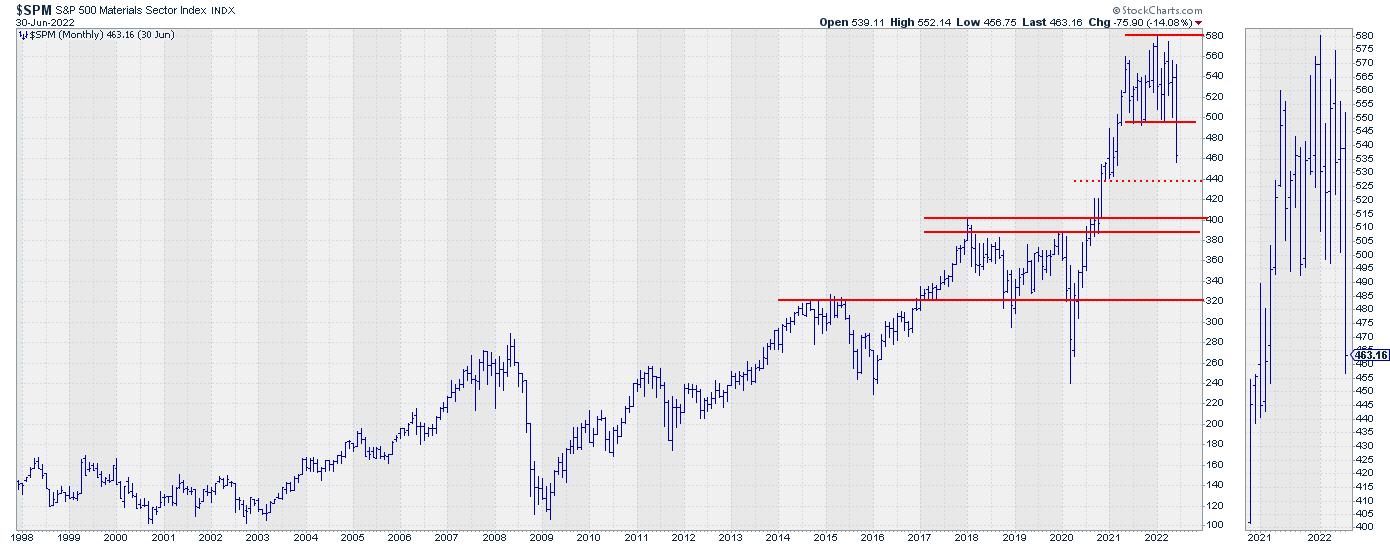
This Industry Group is Facing 60% Downside Risk
by Julius de Kempenaer,
Senior Technical Analyst, StockCharts.com
The chart above is the monthly chart for the materials sector $SPM, which I discussed in this week's episode of Sector Spotlight while going through the completed monthly charts for June.
Materials Sector Completing Big Top Formation
$SPM especially stands out, as the sector very clearly completed a...
READ MORE
MEMBERS ONLY
Sector Spotlight: Bonds Drop, Money Leaves Materials Sector
by Julius de Kempenaer,
Senior Technical Analyst, StockCharts.com
In this edition of StockCharts TV's Sector Spotlight, to kick off the month of July, I dive into the status of the long-term trends as they are unfolding on the monthly charts. The main message from the asset classes is that the bond market is clear: Corporate-...
READ MORE
MEMBERS ONLY
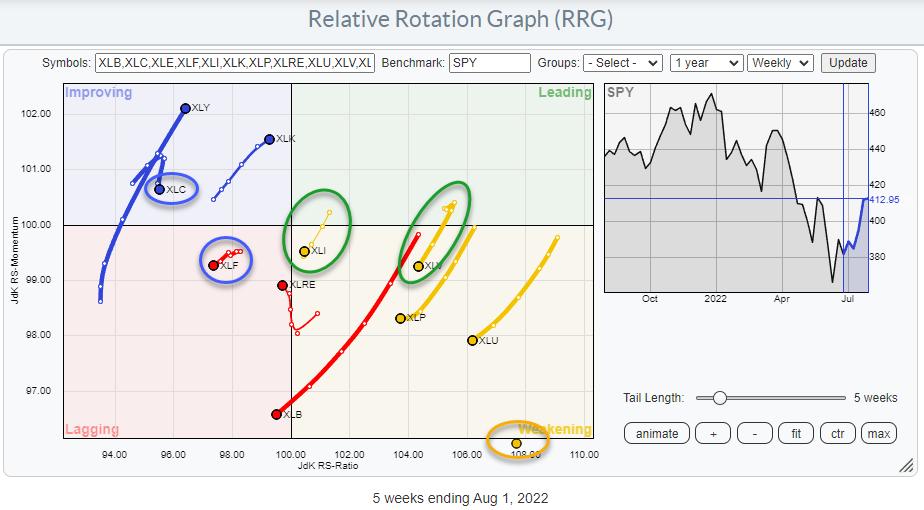
Money Rotating Out of Insurance Groups is Splitting The Financials Sector in Two
by Julius de Kempenaer,
Senior Technical Analyst, StockCharts.com
The Financial sector qualifies as an offensive, or cyclical, sector, together with Consumer Discretionary, Real-Estate and Materials.
On the Relative Rotation Graph for sectors, XLF is showing up inside the lagging quadrant, signaling a relative downtrend vs. the benchmark (SPY). It is interesting to see that XLF is the...
READ MORE
MEMBERS ONLY
Isn't That Beautiful?
by Julius de Kempenaer,
Senior Technical Analyst, StockCharts.com
Yes, Technical Analysis can be (very) subjective at times. Different (types of) investors interpret charts differently. And yes, more quant-based technical approaches can make interpretation of charts or time series less subjective. Personally, I am probably somewhere in the middle of the spectrum.
BUT, looking at the chart of...
READ MORE
MEMBERS ONLY
Sector Spotlight: Sector Rotation Out of Energy Stocks
by Julius de Kempenaer,
Senior Technical Analyst, StockCharts.com
In this edition of StockCharts TV's Sector Spotlight, for this last Tuesday of the month, I take a look at seasonal sector rotation and try to align that with the current reality to see if meaningful matches can be found. For this month, four sectors are providing potentially...
READ MORE
MEMBERS ONLY
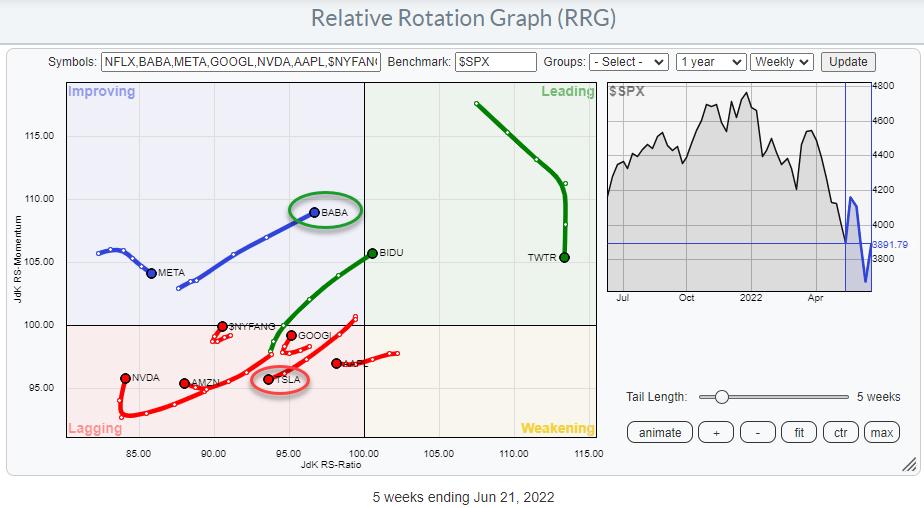
The Battle Between Musk & Ma
by Julius de Kempenaer,
Senior Technical Analyst, StockCharts.com
Following the recent bounce in the stock market, predominantly driven by growth stocks, I wanted to investigate the rotations within the NYFANG+ index (or should it be NYMANA, nowadays?). This is a group of mega-cap stocks from the technology, consumer discretionary and communication services sectors.
When we look at...
READ MORE
MEMBERS ONLY
Sector Spotlight: When Defensive Sectors Break Support...
by Julius de Kempenaer,
Senior Technical Analyst, StockCharts.com
In this edition of StockCharts TV's Sector Spotlight, I kick off the show by answering two questions from the mailbag. I then move on to the current rotation of asset classes, observing that a more pronounced pause in the turnaround for commodities seems imminent. Meanwhile, signals suggesting a...
READ MORE
MEMBERS ONLY
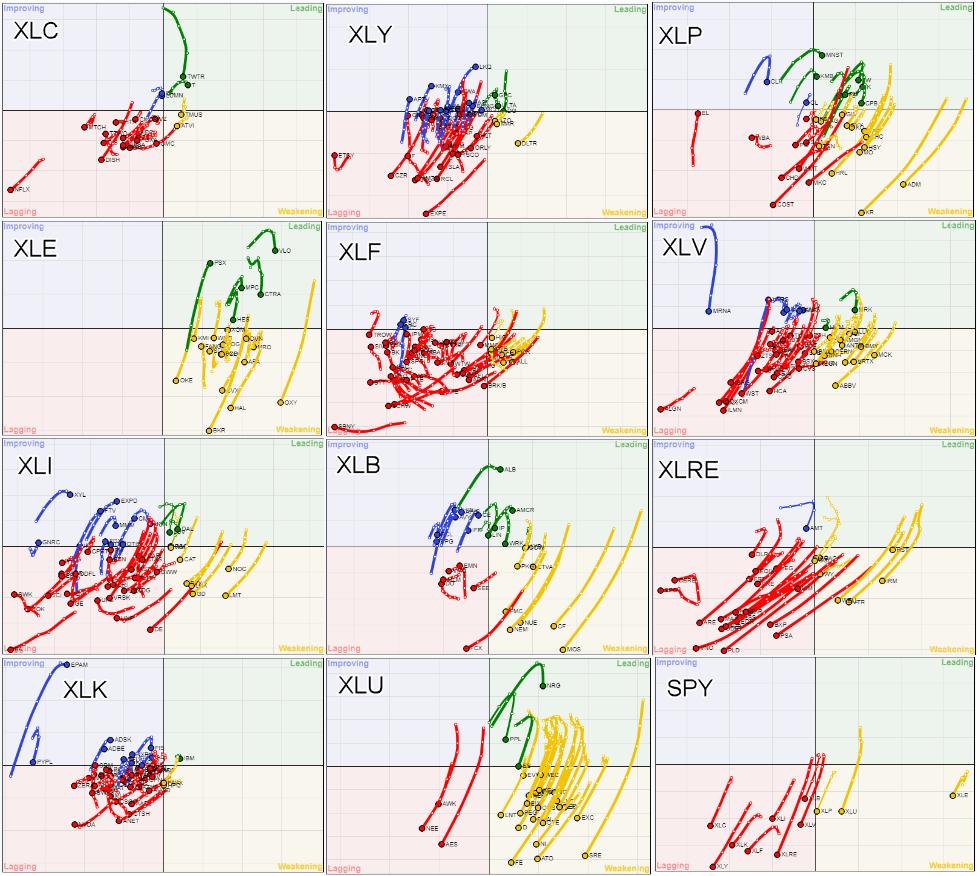
One Lone Ranger Inside the Technology Sector
by Julius de Kempenaer,
Senior Technical Analyst, StockCharts.com
In my previous article, as well as in Tuesday's Sector Spotlight show, I touched on using Relative Rotation Graphs for gauging market breadth, showing this combination chart.
This image combines 12 Relative Rotation Graphs using $ONE as the benchmark, and it tells me, and I hope you as...
READ MORE
MEMBERS ONLY
Sector Spotlight: Tracking the Stock Market Slide on RRG
by Julius de Kempenaer,
Senior Technical Analyst, StockCharts.com
In this edition of StockCharts TV's Sector Spotlight, I jump right into the rotations for asset classes and sectors. At asset class level, the only things that go up in price are commodities; the USD has made a strong move and is back on track. Meanwhile, both stocks...
READ MORE
MEMBERS ONLY
Sector Rotation At Cross Roads, Defense Likely To Take Back The Lead.
by Julius de Kempenaer,
Senior Technical Analyst, StockCharts.com
Weekly
The Relative Rotation Graph for US sectors is arriving at an important juncture.
For months the defensive sectors have been the leading segment in the S&P, even before the peak was reached Utilities, Staples, and Healthcare started leading the market from a relative perspective. These sectors were...
READ MORE