MEMBERS ONLY
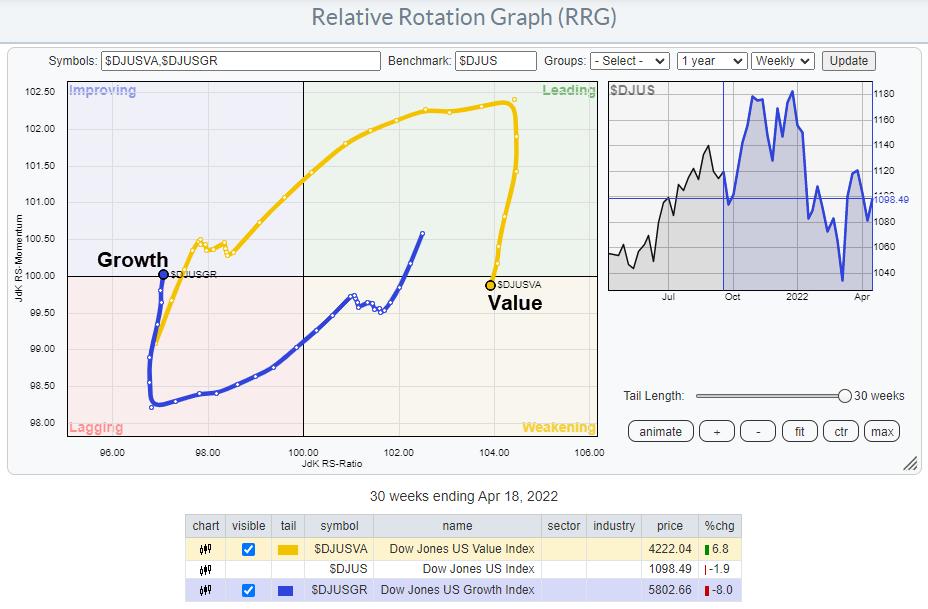
After a Short Break, Value is Ready to Pick Up Again
by Julius de Kempenaer,
Senior Technical Analyst, StockCharts.com
In this week's episode of Sector Spotlight, I had planned to also do a review of the current growth/value rotation. Due to bad timing on my side, or talking too long on the breakdown of sectors into cyclical, defensive and sensitive in large-cap, equal-weight and small-cap universes,...
READ MORE
MEMBERS ONLY
Sector Spotlight: Defense, Defense, Defense!
by Julius de Kempenaer,
Senior Technical Analyst, StockCharts.com
In this edition of StockCharts TV's Sector Spotlight, I briefly look at the current rotations in asset classes, then dive into sectors. After a look at what happened last week, I break down the sector universes into cyclical/offensive, defensive and sensitive, then compare the rotations between large-cap,...
READ MORE
MEMBERS ONLY
Sector Spotlight: Market Past Top Shifting Towards Early Recession
by Julius de Kempenaer,
Senior Technical Analyst, StockCharts.com
In this edition of StockCharts TV's Sector Spotlight, I take a look at last week's rotations for asset classes and sectors, noticing the improving relative strength for stocks vs. bonds but a general weakening of both stock and bond markets in price terms. The rapid rise...
READ MORE
MEMBERS ONLY
Sector Rotation Model Signals Economy Moving Towards Early Recession
by Julius de Kempenaer,
Senior Technical Analyst, StockCharts.com
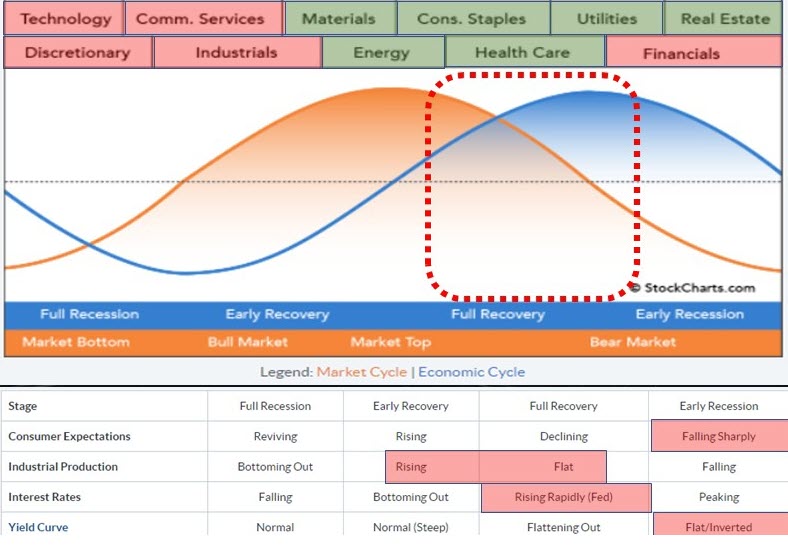
Every quarter, I try to do an update of the Sector Rotation Model. We have the framework as described by Sam Stovall here on the site. The image above shows my interpretation of the various factors that affect this model.
Across the top, you will find the eleven sectors. The...
READ MORE
MEMBERS ONLY
Who Is Swimming Against The Tide?
by Julius de Kempenaer,
Senior Technical Analyst, StockCharts.com
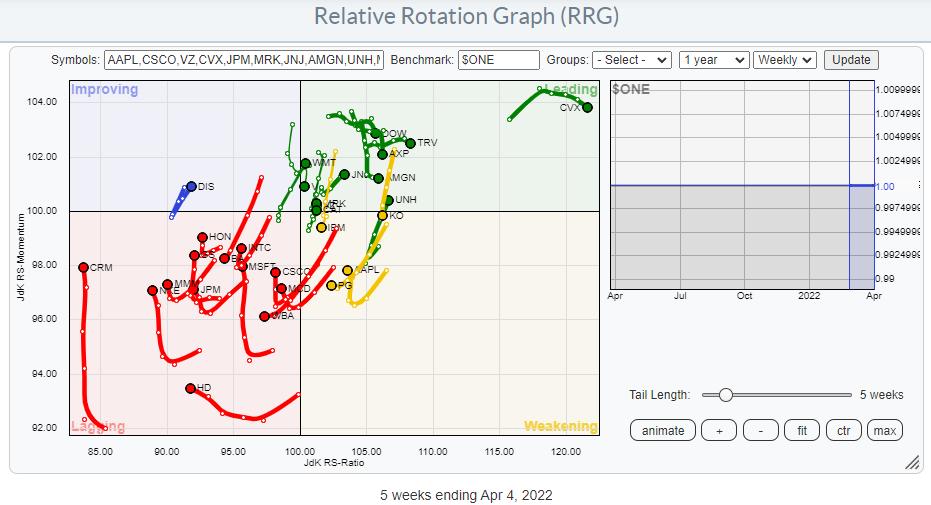
The Relative Rotation Graph above shows the members of the DJ Industrials index against $ONE as the benchmark. This way of looking at RRG helps us to gauge the price trends within the universe. You can see quite clearly that the majority of the tails are inside the lagging quadrant,...
READ MORE
MEMBERS ONLY
Sector Spotlight: A Killer Combination - Strong Utes and Weak Bonds
by Julius de Kempenaer,
Senior Technical Analyst, StockCharts.com
In this edition of StockCharts TV's Sector Spotlight, for this first Tuesday in April, I present the monthly charts for asset classes and sectors to the forefront again. After a review of last week's rotations, I bring up the monthly charts for the most important asset...
READ MORE
MEMBERS ONLY
A Pretty Clear Message From The Dow Theory
by Julius de Kempenaer,
Senior Technical Analyst, StockCharts.com
Sometimes less is more. When things are messy and there are a lot of things that are moving markets I usually like to take a step back and look at some of the very basic stuff to get rid of all the noise and clutter.
On this occasion, I thought...
READ MORE
MEMBERS ONLY
Sector Spotlight: Bonds Remain a Threat
by Julius de Kempenaer,
Senior Technical Analyst, StockCharts.com
In this edition of StockCharts TV's Sector Spotlight, after having missed last week's show, I catch up with a discussion on rotations for asset classes and sectors, in particular pointing out the rapidly-rising interest rates and their potential impact on stocks. The near-term rotations are in...
READ MORE
MEMBERS ONLY
A New Round of Crypto Strength Seems to be Around the Corner!
by Julius de Kempenaer,
Senior Technical Analyst, StockCharts.com
The interest in Bitcoin or, more generally, cryptocurrencies comes and goes, and the moves are highly volatile from time to time. Nevertheless, this investment space is becoming more and more mainstream and, no matter what your personal opinion is, it is more and more a force to be reckoned with....
READ MORE
MEMBERS ONLY
Materials are Creeping Up, While PKG Breaks Higher
by Julius de Kempenaer,
Senior Technical Analyst, StockCharts.com
The materials sector has recently started to pick up relative strength again following a loss of relative momentum while inside the leading quadrant. The RRG above, with the XLB tail highlighted, is a nice example of how RRG-Velocity, which measures the week-to-week distances on the tail, started to shrink before...
READ MORE
MEMBERS ONLY
Sector Spotlight: It's Not Over Yet for Slumping SPY!
by Julius de Kempenaer,
Senior Technical Analyst, StockCharts.com
In this edition of StockCharts TV's Sector Spotlight, I address last week's rotations for asset classes and sectors. After that, I look deeper into the current structure of the S&P 500 chart in combination with the RSI and discuss the interpretation of the current...
READ MORE
MEMBERS ONLY
Which Energy Stocks Should You Be Watching?
by Julius de Kempenaer,
Senior Technical Analyst, StockCharts.com
It's very clear that the Energy sector is the strongest sector inside the S&P 500 over the last several months.
The tail on the Relative Rotation Graph above shows the rotation that the sector went through. The "hook" back up to leading from weakening...
READ MORE
MEMBERS ONLY
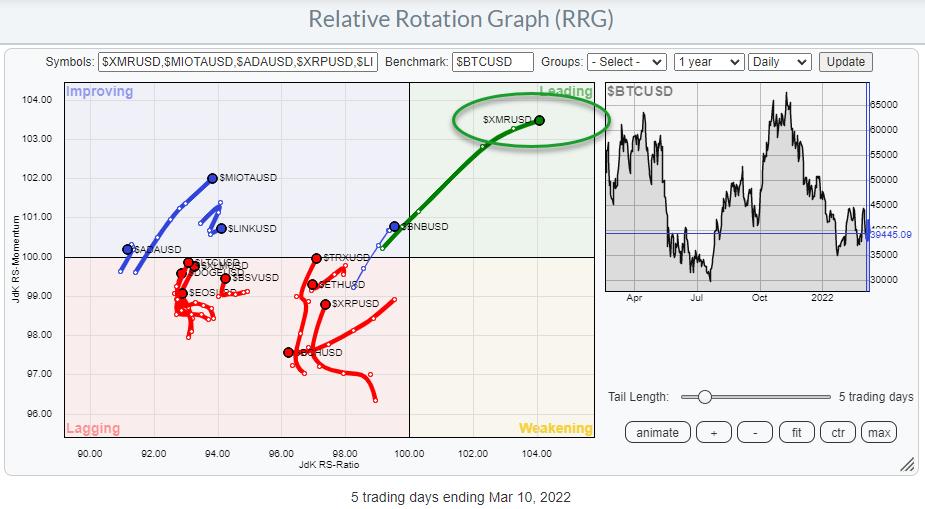
Monero (XMR) Starting To Lead Against BTC
by Julius de Kempenaer,
Senior Technical Analyst, StockCharts.com
The Relative Rotation Graph above shows the rotation for a group of cryptocurrencies against BTC on a daily time frame. Looking at this chart, the tail for $XMRUSD stands out. Almost all the tails are traveling in an NW direction, which means that they are improving against BTC. However, the...
READ MORE
MEMBERS ONLY
Don't Be Fooled by a One-Day 2.5% Jump
by Julius de Kempenaer,
Senior Technical Analyst, StockCharts.com
Yesterday (Wed 3/9), the S&P bounced up around 2.5%... And although it is a nice jump after all the declines we have seen recently, it doesn't impress me much. At least not enough to get very bullish again all of a sudden.
Of course,...
READ MORE
MEMBERS ONLY
Sector Spotlight: Energy and Utilities Jump Amid Market Mayhem
by Julius de Kempenaer,
Senior Technical Analyst, StockCharts.com
In this edition of StockCharts TV's Sector Spotlight, after another volatile week, I take a look at rotations as they unfolded in Asset Classes and sectors where I find defensive sectors topping the charts. Following the events in Eastern Europe between Russia and Ukraine, I take another look...
READ MORE
MEMBERS ONLY
Sector Spotlight: Long-Term Sector Trends are Fading
by Julius de Kempenaer,
Senior Technical Analyst, StockCharts.com
In this edition of StockCharts TV's Sector Spotlight, as it is the first Tuesday of the month, I take on the monthly charts for February. After a short look at the current rotations for Asset Classes and Sectors, I jump into the long-term trends as they are unfolding...
READ MORE
MEMBERS ONLY
Breaking Down Europe (On the Charts, That Is...)
by Julius de Kempenaer,
Senior Technical Analyst, StockCharts.com
In my article for the ChartWatchers newsletter this weekend, I wrote about the rotation of various stock markets against the DJ Global Index. On that Relative Rotation Graph, Europe had moved into the leading quadrant, but has since almost immediately started to lose relative momentum. The US market (SPY) had...
READ MORE
MEMBERS ONLY
Waking Up in Europe on Thursday Morning
by Julius de Kempenaer,
Senior Technical Analyst, StockCharts.com
What a surreal experience it was waking up on Thursday morning. Switching on the news and seeing that Russia has actually invaded Ukraine. For us Europeans, wars since WWII have always been fought far away from home in Afghanistan, former Yugoslavia, Iraq, Iran, Kuwait, etc. But this is literally in...
READ MORE
MEMBERS ONLY
SPY Closing in on Important Support
by Julius de Kempenaer,
Senior Technical Analyst, StockCharts.com
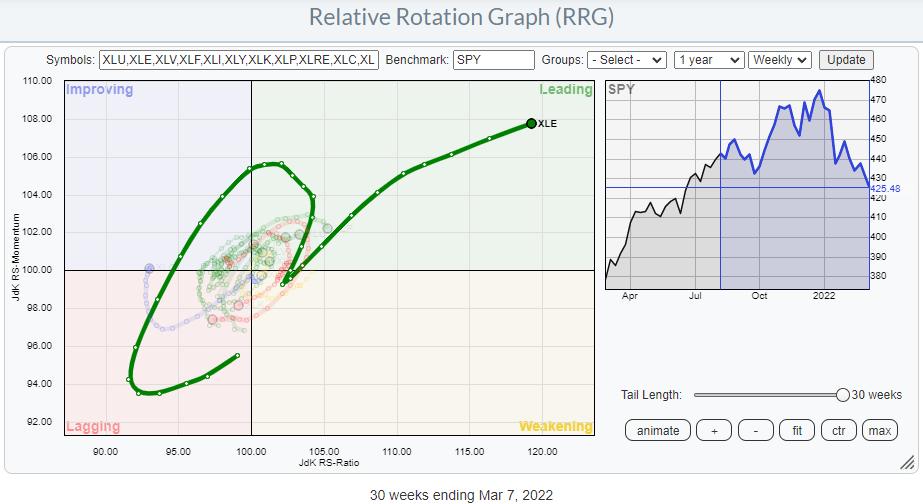
On this week's episode of Sector Spotlight, I discussed the chart of SPY, as it is approaching an important support area between 420-425. The updated version of this chart is printed above and, as you can see, the market is getting closer and closer to this important support...
READ MORE
MEMBERS ONLY
Sector Spotlight: Looking Abroad for Opportunities
by Julius de Kempenaer,
Senior Technical Analyst, StockCharts.com
In this edition of StockCharts TV's Sector Spotlight, I take on the rotations in asset classes and US sectors as they unfolded last week. Because it is the last Tuesday of the month, a look at seasonality, in combination with current rotations, is also on the menu. I...
READ MORE
MEMBERS ONLY
Discretionary and Tech Are Crucial for the Direction of the Market
by Julius de Kempenaer,
Senior Technical Analyst, StockCharts.com
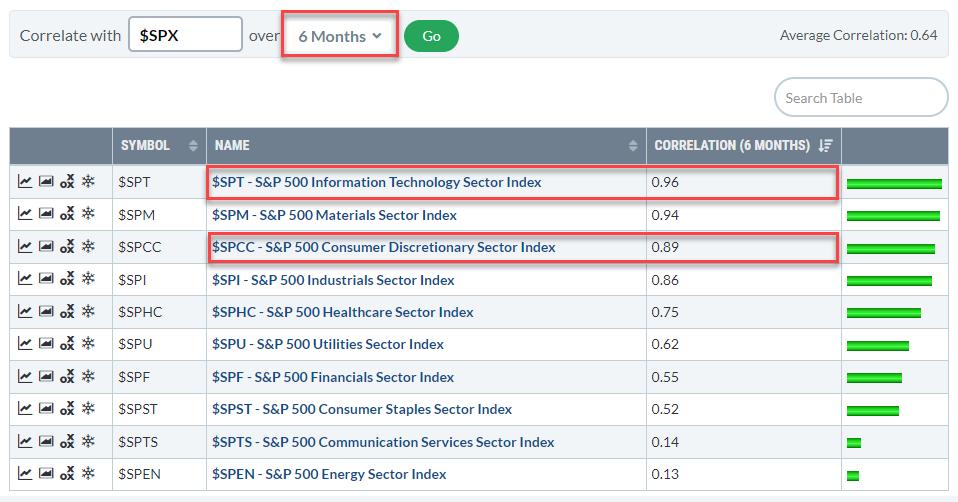
Correlation is a useful metric to use when trying to gauge the direction of the market.
The table above shows the correlations for the 12 sectors against the S&P 500. In this version, I used a 6-month period to calculate the correlation; the drop-down selector allows users to...
READ MORE
MEMBERS ONLY
Sector Spotlight: Old Support Returns as Resistance
by Julius de Kempenaer,
Senior Technical Analyst, StockCharts.com
In this edition of StockCharts TV's Sector Spotlight, I go over last week's rotations in Asset Classes and Sectors and put these into a weekly perspective. In the Asset Class section, I zoom in on Stocks, Bonds and Commodities. In sectors, I look at rotations for...
READ MORE
MEMBERS ONLY
Trouble In FAANG(sta's) Paradise
by Julius de Kempenaer,
Senior Technical Analyst, StockCharts.com
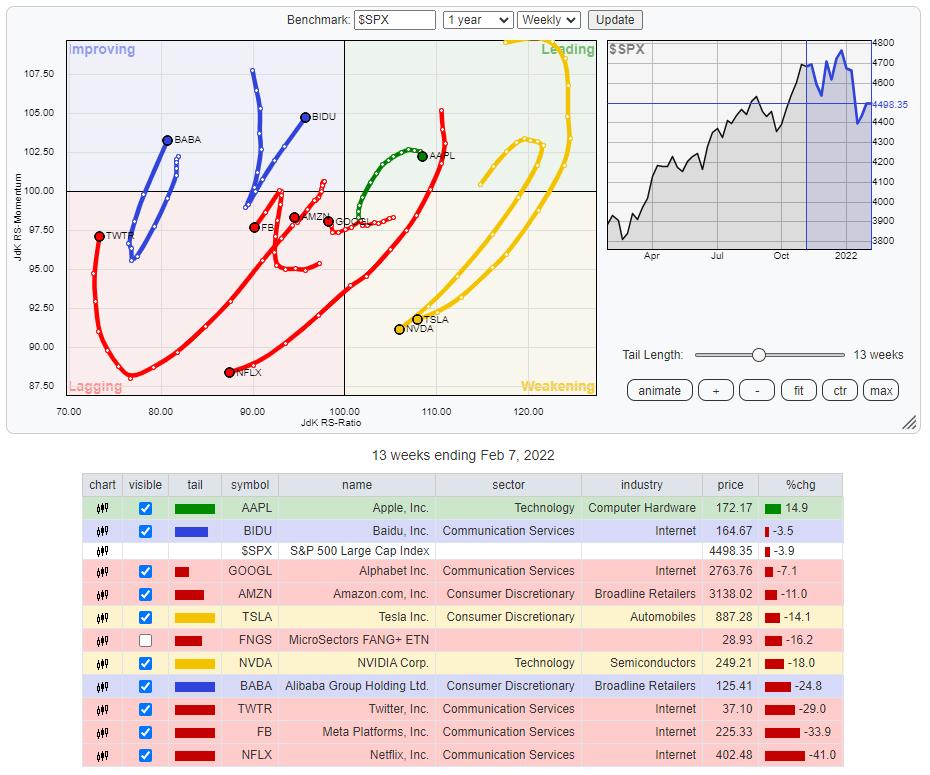
This Relative Rotation Graph shows the rotation for the NYFANG+ members over the last thirteen weeks (quarter). Plotting this universe against the S&P 500 index clearly shows the weakness that crept into this universe recently.
Leading Quadrant
AAPL is the only stock that managed to keep up inside...
READ MORE
MEMBERS ONLY
Semiconductors at Risk!
by Julius de Kempenaer,
Senior Technical Analyst, StockCharts.com
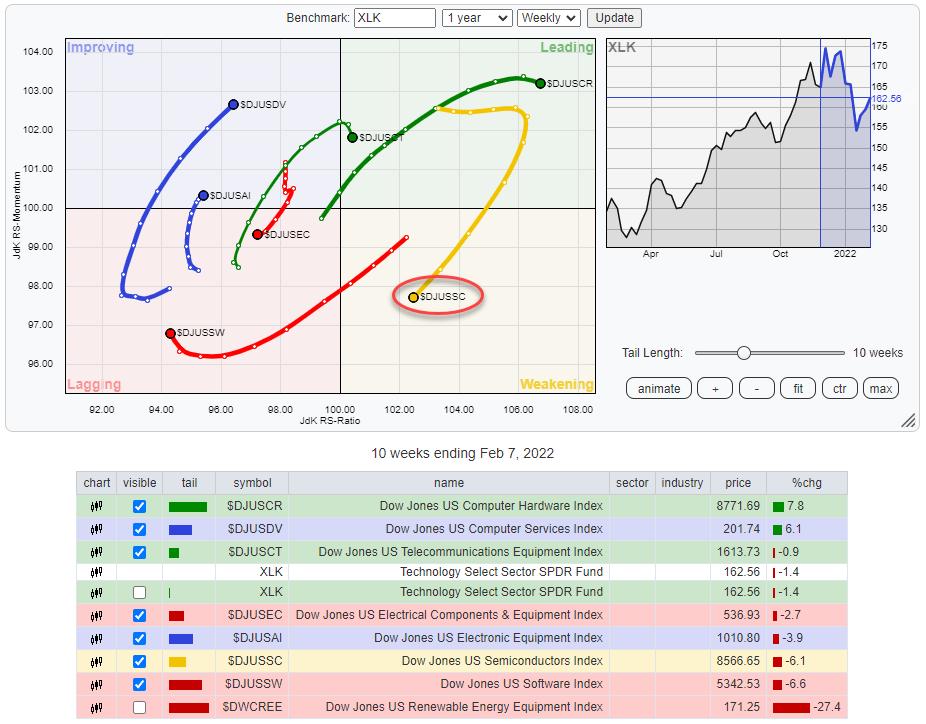
The Technology sector is under pressure for a few weeks already. We have seen a few attempts to bounce back but, so far, these have not been very successful.
The Relative Rotation Graph above shows the groups within the technology sector. The Semiconductors group was a major contributor on the...
READ MORE
MEMBERS ONLY
Sector Spotlight: Bonds Take a Nosedive
by Julius de Kempenaer,
Senior Technical Analyst, StockCharts.com
In this edition of StockCharts TV's Sector Spotlight, after last week's look at long-term trends on monthly charts, I focus on daily and weekly rotations as I see them in asset classes and sectors. In the asset class segment, developments in the bond markets play a...
READ MORE
MEMBERS ONLY
Sector Rotation to Defense Continues
by Julius de Kempenaer,
Senior Technical Analyst, StockCharts.com
Big drops call for big recoveries, but it's dangerous to watch these moves in isolation.
The S&P 500 dropped roughly 60 points from its peak at 480 at the start of the year to find a low recently around 420. Out of that low, the market...
READ MORE
MEMBERS ONLY
Sector Spotlight: Sector Charts Showing Nasty Reversal Bars
by Julius de Kempenaer,
Senior Technical Analyst, StockCharts.com
In this edition of StockCharts TV's Sector Spotlight, after a volatile week in the markets and the completion of the monthly charts for January on Monday (1/31), now is a perfect moment to take a good look at the developments on these long-term charts. In the Asset...
READ MORE
MEMBERS ONLY
C'mon Commodities, Push That Energy Sector UP!
by Julius de Kempenaer,
Senior Technical Analyst, StockCharts.com
Watchers of my show Sector Spotlight will know that I have been watching the development of commodities as an asset class that's going through a long turnaround. Recent developments continue to reinforce that view.
The Relative Rotation Graph shows the rotation for a universe of asset class ETFs...
READ MORE
MEMBERS ONLY
Large Cap vs. Small Cap... A World Of Difference
by Julius de Kempenaer,
Senior Technical Analyst, StockCharts.com
When looking at Relative Rotation Graphs showing large-cap sectors and small-cap sectors, we usually see rotations for the various sectors that are more or less in line with each other. That's not surprising, as the small companies are active in the same sector as their large counterparts. Sometimes,...
READ MORE
MEMBERS ONLY
Sector Spotlight: Stock/Bond Ratio Signals Defense
by Julius de Kempenaer,
Senior Technical Analyst, StockCharts.com
In this edition of StockCharts TV's Sector Spotlight, after a rocky week and a volatile Monday, I evaluate the rotations for asset classes and sectors on Relative Rotation Graphs. Both groups are showing some important shifts that suggest a further move to defense is in order. As it...
READ MORE
MEMBERS ONLY
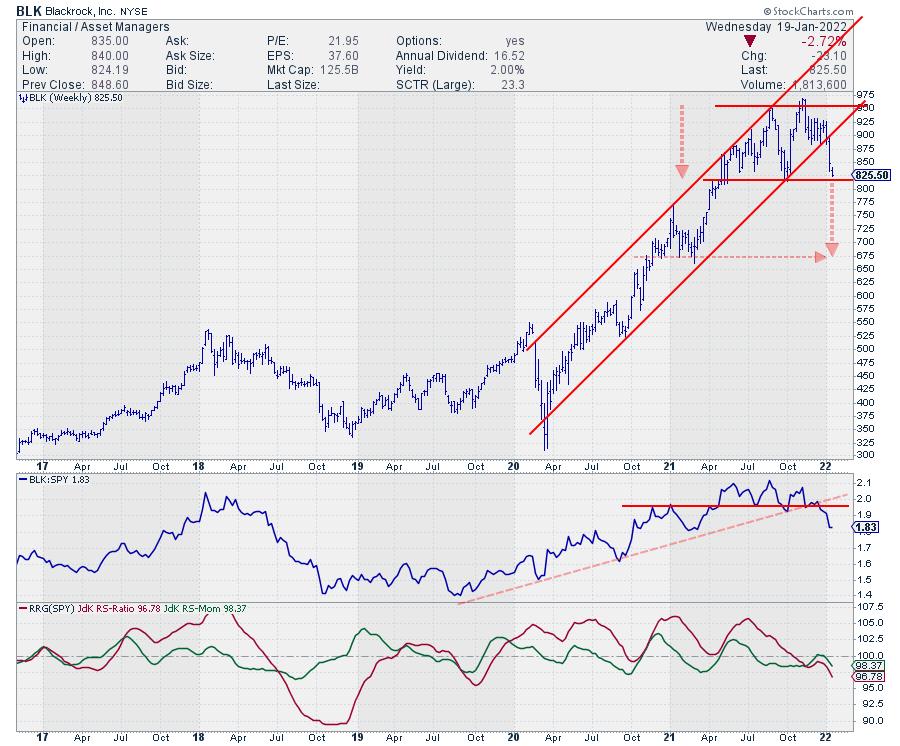
This Big Boy is in Trouble
by Julius de Kempenaer,
Senior Technical Analyst, StockCharts.com
While looking at the Financial sector, I noticed that the group Asset Managers is currently at a very weak rotation against the S&P, as well as its sector index XLF.
After returning into the leading quadrant from weakening, which is usually a strong sign, $DJUSAG rapidly hooked back...
READ MORE
MEMBERS ONLY
Financials are All Over the Place
by Julius de Kempenaer,
Senior Technical Analyst, StockCharts.com
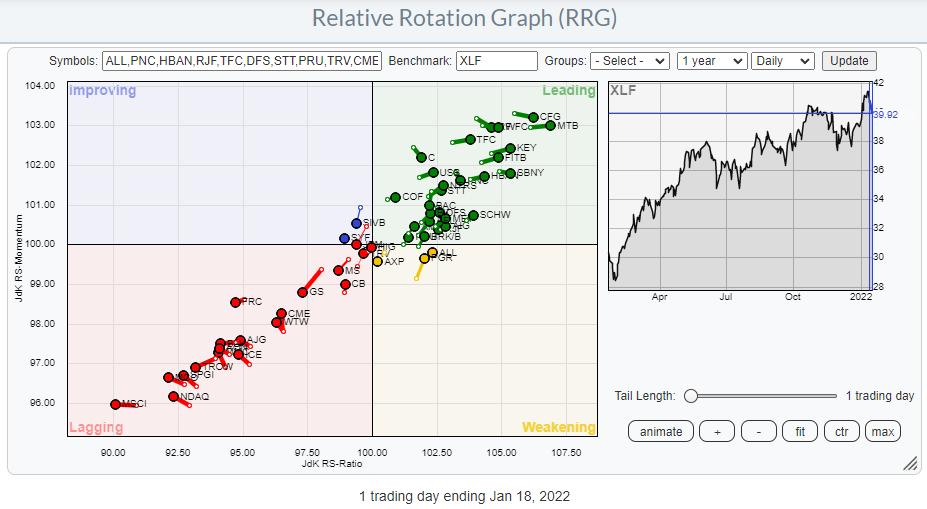
On the back of a lot of earnings announcements, the financial sector is getting a lot of attention this week. A few stocks, led by SIVB, FRC and GS, got hurt pretty bad yesterday with >5% declines.
The RRG above shows the (top 50) stocks inside the financial sector....
READ MORE
MEMBERS ONLY
Sector Spotlight: Cycle Shifting Towards Full Recovery/Top
by Julius de Kempenaer,
Senior Technical Analyst, StockCharts.com
In this edition of StockCharts TV's Sector Spotlight, after going over the current rotations for asset classes and sectors, I use the Equal Weight sectors to update and gauge the current position of the market in relation to the economic cycle. Since December, things seem to have shifted...
READ MORE
MEMBERS ONLY
Using RRG for Visual Inspection of Market and Sector Breadth
by Julius de Kempenaer,
Senior Technical Analyst, StockCharts.com
Relative Rotation Graphs are mostly used to show exactly that -- the RELATIVE Rotation of securities against a benchmark and against each other. However, they offer many more possibilities.
One of the options is to change the benchmark to $ONE. That is essentially a straight line at value 1. This...
READ MORE
MEMBERS ONLY
Useful Utes
by Julius de Kempenaer,
Senior Technical Analyst, StockCharts.com
The utilities sector is showing a strong rotation over the last weeks. The sector moved back into lagging from improving in the week starting 18 October, then rotated through lagging and re-entered the improving quadrant again in the week starting 13 December at a strong RRG-Heading.
The next Relative Rotation...
READ MORE
MEMBERS ONLY
Sector Spotlight: Tech & Discretionary Push S&P to Support
by Julius de Kempenaer,
Senior Technical Analyst, StockCharts.com
In this edition of StockCharts TV's Sector Spotlight, I cover the rotations for asset classes, sectors and crypto. The break below support of GOVT gets attention while the recent sector rotation out of Consumer Discretionary and Technology pushed the S&P 500 to the lower boundary of...
READ MORE
MEMBERS ONLY
Strong Rotation for Defensive Sectors is Keeping S&P Under Pressure
by Julius de Kempenaer,
Senior Technical Analyst, StockCharts.com
One of the more prominent rotations on the (weekly) Relative Rotation Graph for sectors is the strength displayed by the defensive sectors.
In the RRG above, I have marked an oval around Staples, Utilities and Health Care. These are the three "defensive sectors" in the universe and they...
READ MORE
MEMBERS ONLY
Sector Spotlight: Yield Curve Supports Further Strength for Stocks
by Julius de Kempenaer,
Senior Technical Analyst, StockCharts.com
On the first 2022 edition of StockCharts TV's Sector Spotlight, I look back at rotations that happened over the holiday period and then address the monthly charts that completed in December. The long-term trend in the yield curve shows a rapid flattening in December and, historically, that seems...
READ MORE
MEMBERS ONLY
Ready for New RRG Rotations into 2022
by Julius de Kempenaer,
Senior Technical Analyst, StockCharts.com
Here we are, on the last day of the year, writing my last ChartWatchers newsletter contribution for 2021.
By the time you are reading this, it will be 2022. So let me kick off by...
wishing you a very happy and above all healthy new year!!
Given the situation the...
READ MORE
MEMBERS ONLY
Three Groups to Watch Inside the Materials Sector
by Julius de Kempenaer,
Senior Technical Analyst, StockCharts.com
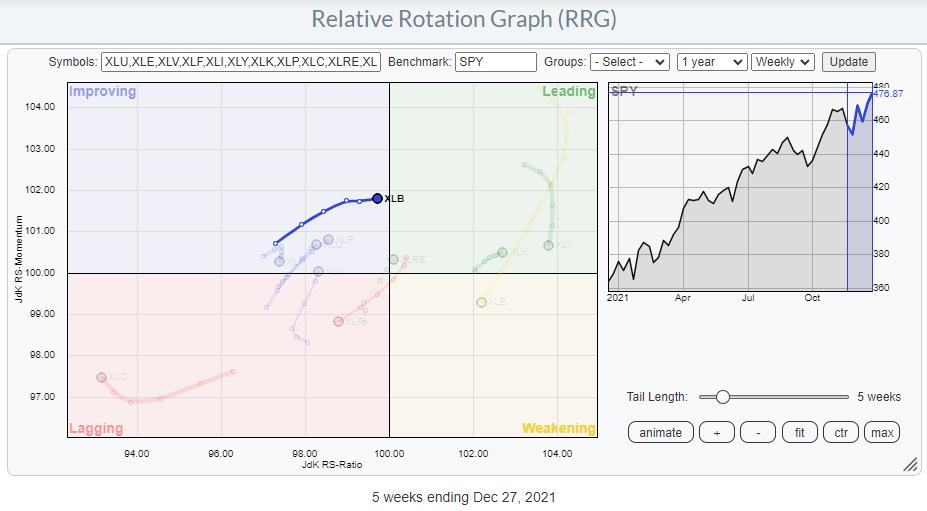
Over the past several weeks, the materials sector has continued to improve very gradually and is now on the verge of crossing over into the leading quadrant.
The bottoming process of relative strength against SPY is still ongoing and has been picked up by the RRG-Lines, which are both rising....
READ MORE