MEMBERS ONLY
Dollar Index Is On A Knife Edge
by Martin Pring,
President, Pring Research
* Long-term dollar technical position
* Short-term picture bearish outcome
* Short-term picture bullish outcome
* Euro
* Yen
* Swiss franc
Long-term dollar technical position
I have been primary trend bullish on the dollar for several months. That opinion still stands because the Dollar Index is well above its 12-month MA and its long-term KST...
READ MORE
MEMBERS ONLY
Is It A Bubble When ...
by Martin Pring,
President, Pring Research
* A few thoughts on bubbles
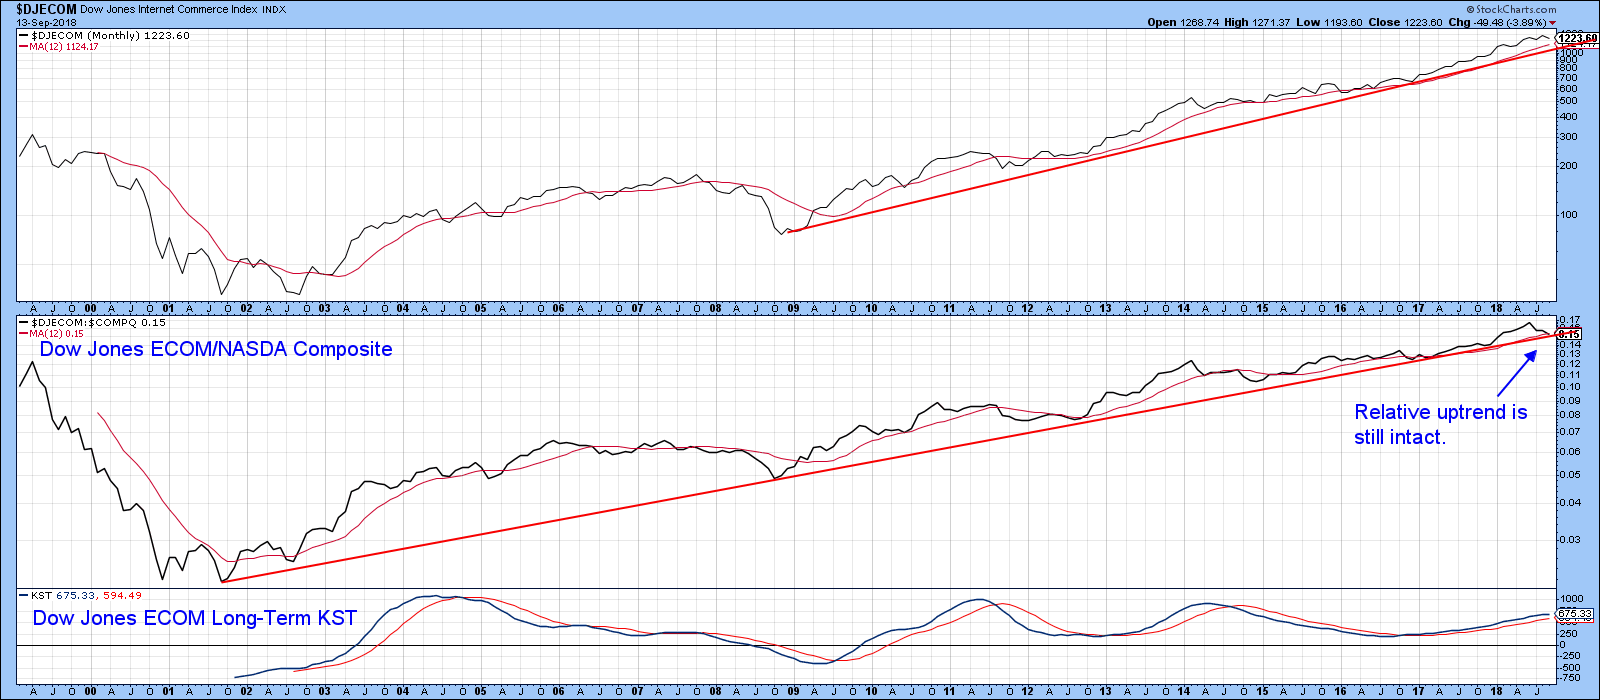
* Technical comments on the Dow Jones Internet Commerce Index
* China on the brink
A few thoughts on bubbles
Last week, I pointed out that most of the FAANG stocks remained in uptrends, with the possible exception of Netflix and the confirmed bear market in Facebook....
READ MORE
MEMBERS ONLY
Facebook Does An About Face, But What About The Other FAANG Stocks?
by Martin Pring,
President, Pring Research
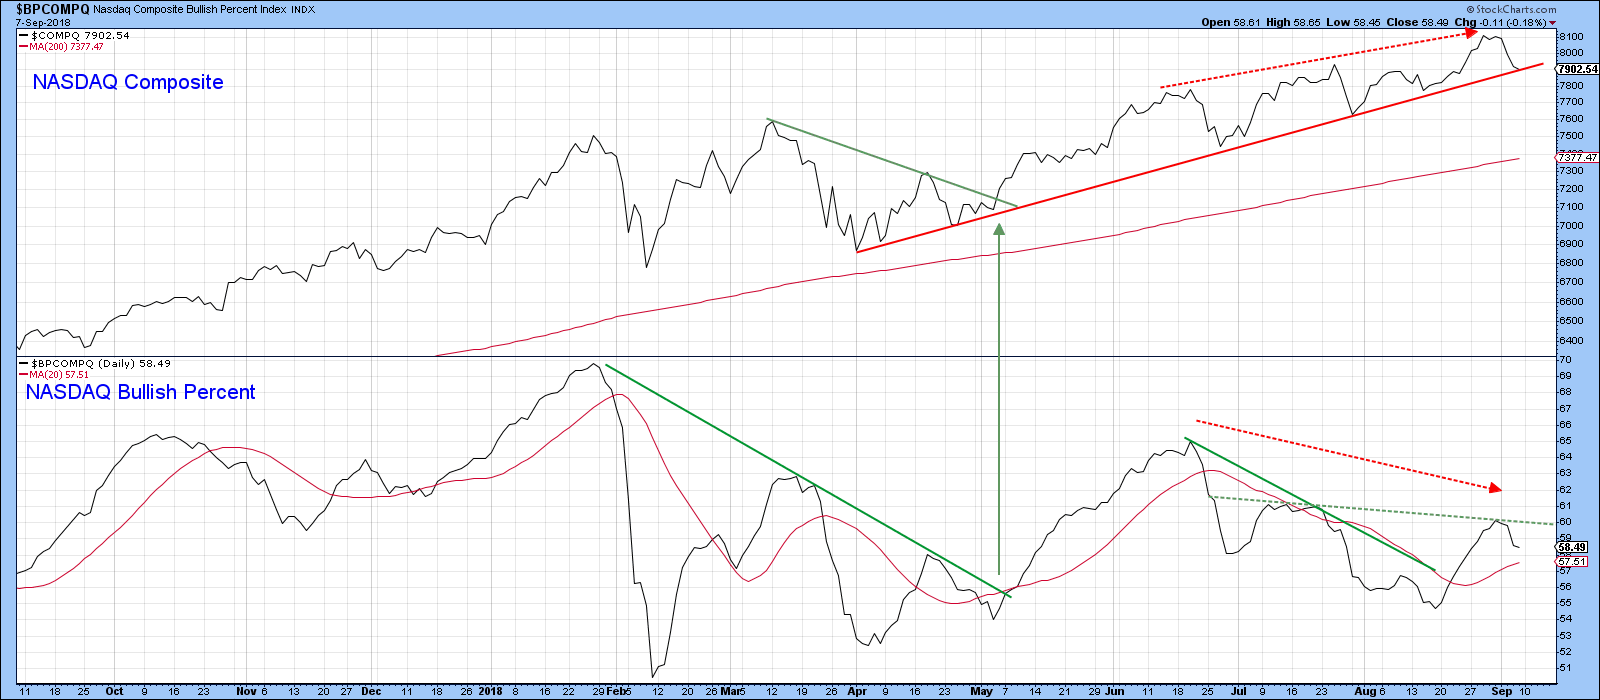
* NASDAQ breadth data offers conflicting signals
* Bullish FAANG Stocks
* De-fanged stock
NASDAQ breadth data offering conflicting signals
We have seen some attention paid to tech stocks as they have corrected in the last week or so. The so called FAANG (Facebook, Apple, Amazon, Alphabet’s Google and Netflix) have been...
READ MORE
MEMBERS ONLY
September 2018 Market Roundup With Martin Pring
by Martin Pring,
President, Pring Research
The MarketRoundup Video For September is now available.
Good luck and good charting,
Martin J. Pring
The views expressed in this article are those of the author and do not necessarily reflect the position or opinion ofPring Turner Capital Groupof Walnut Creek or its affiliates....
READ MORE
MEMBERS ONLY
US Stocks Take On Global Equities, Gold, Commodities And Bonds
by Martin Pring,
President, Pring Research
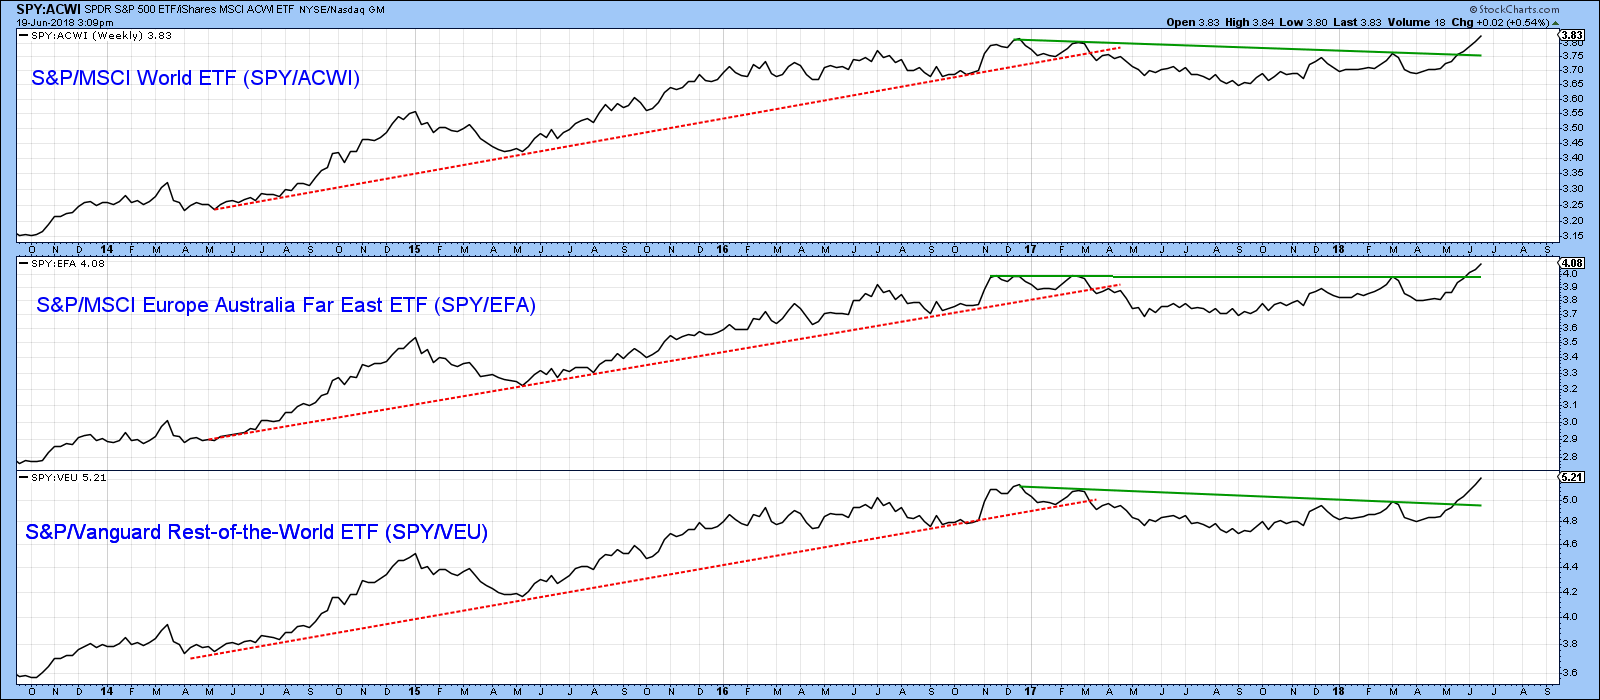
* US Equities versus the world
* Stocks versus Commodities
* Stocks and bonds
* Stocks compared to gold
There are lots of seasonal reasons to be bearish on the stock market, such as September being the weakest month and mid-term election years having a downward bias. However, if you compare the S&...
READ MORE
MEMBERS ONLY
Bond Yields Reach A Critical Support Zone
by Martin Pring,
President, Pring Research
* The longer-term picture argues for lower yields
* Deflationary forces gain the upper hand
* Bond yields at crucial short-term support
* UK Yields in a life or death struggle
The longer-term picture argues for lower yields
Earlier in the month I wrote an article pointing out that many bond yields had reached...
READ MORE
MEMBERS ONLY
More Evidence Of A Commodity Bear Market
by Martin Pring,
President, Pring Research
* Commodities starting to generate some long-term sell signals
* Internals and commodity intermarket relationships are deteriorating
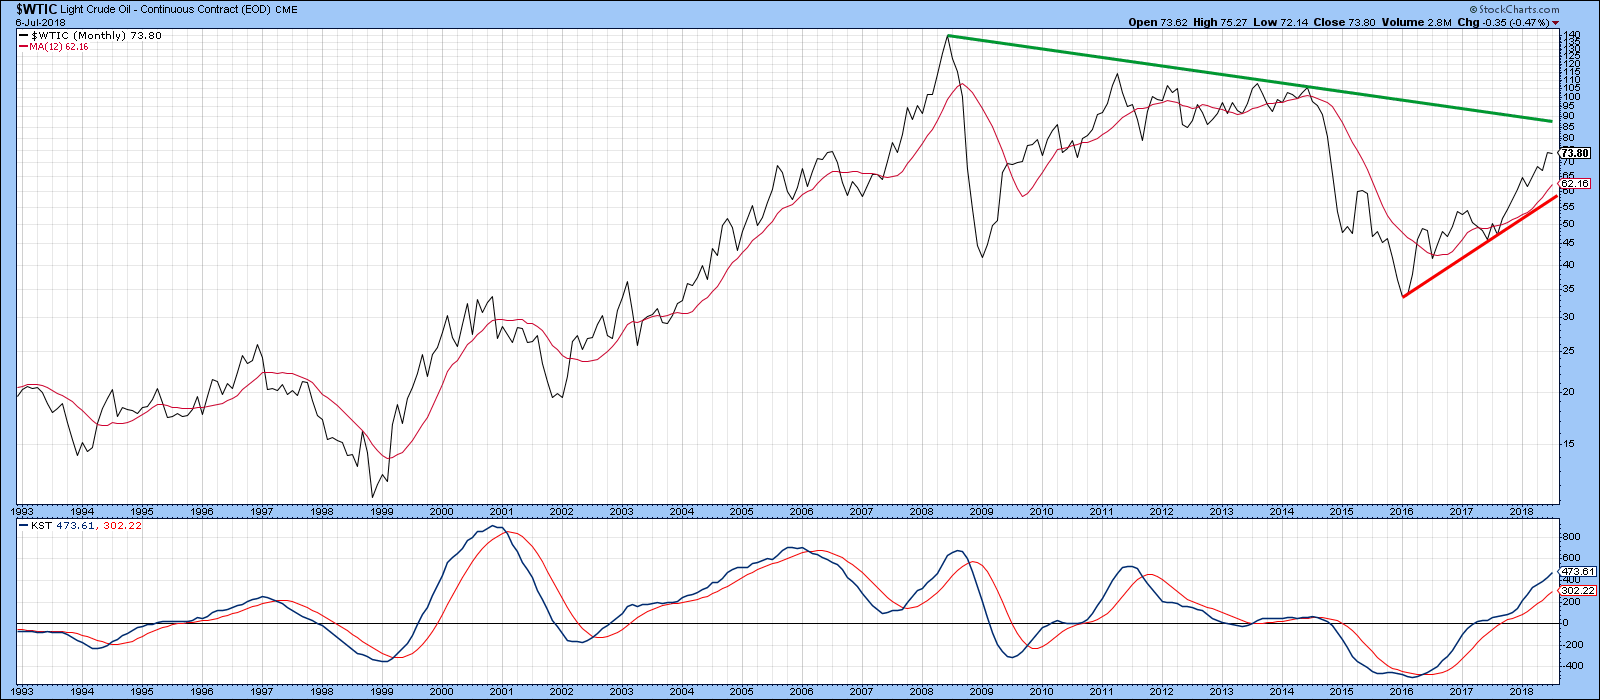
* Energy has been lagging on the downside but may be ready to play catch up
Earlier in the summer I wrote a couple of articles on copper and oil suggesting some short-term vulnerability, but concluding...
READ MORE
MEMBERS ONLY
Getting Through The Old Highs Could Be A Challenge
by Martin Pring,
President, Pring Research
* Last week's test of the highs leaves a lot to be desired
* Breadth and momentum indicators fail to confirm
* Some international charts not looking so good
Last week's test of the highs leaves a lot to be desired
If the charts in this article look a...
READ MORE
MEMBERS ONLY
Are We Seeing The Early Sign Of A Change In Market Leadership?
by Martin Pring,
President, Pring Research
* The Inflation/Deflation ratio
* Lagging sectors
* Defensive sectors
The Inflation/Deflation ratio
Last week I charted my Inflation/deflation ratio for the first time in a while and was surprised to see that it had broken to the downside. For those unfamiliar with the concept, the Inflation Ratio (!PRII) consists...
READ MORE
MEMBERS ONLY
Bond Yields Hit Mega Resistance. Will They Go Through?
by Martin Pring,
President, Pring Research
* 3- and 10-year series challenging their secular down trendlines
* Three indicators that suggest lower bond yields
* The Crunch Chart
3- and 10-year series challenging their secular down trend lines
US government bond yields have reached very important resistance, at a time when they are overextended on a long-term momentum basis....
READ MORE
MEMBERS ONLY
August Market Round Up With Martin Pring Video 2018-08-01
by Martin Pring,
President, Pring Research
This month, the Market Roundup carries a lot of information about how acute the current market position is in globally.
Good luck and good charting,
Martin J. Pring
The views expressed in this article are those of the author and do not necessarily reflect the position or opinion of Pring...
READ MORE
MEMBERS ONLY
This Week's NASDAQ High Was A Lonely Place
by Martin Pring,
President, Pring Research
* Tuesday was a Key Reversal Day
* Breadth fails to confirm Tuesday’s high
* Primary uptrend is intact, but will it be threatened?
Tuesday was a Key Reversal Day
This week the NASDAQ Composite registered a new all-time-high, but the quality of that rally leaves a lot to be desired. That...
READ MORE
MEMBERS ONLY
Is Gold In A Bear Market Or A Buying Opportunity?
by Martin Pring,
President, Pring Research
* Long-term trends rolling over to the downside
* A rising dollar does not help gold
* Gold Under-performing stocks is not a good thing….for gold
* Gold showing bear market characteristics
Long-term trends rolling over to the downside
The recent sell off in the price of gold has quite frankly surprised me....
READ MORE
MEMBERS ONLY
Bond Yields Showing Some Vulnerability
by Martin Pring,
President, Pring Research
* A look at the primary and secular trends
* Interesting momentum study points to lower bond yields
* Bond Net New Highs set to pounce in either direction
* Slight softening in confidence hints at lower yields
In the June and July editions of my Market Roundup webinars I pointed out the possibility...
READ MORE
MEMBERS ONLY
What Would It Take For The Charts To Signal A Top In Oil?
by Martin Pring,
President, Pring Research
* Technical picture is ripe for a turn, but the main trend is up right now
* Tuesday’s outside day could be the first domino
* Negative divergences between several energy components
Technical picture is ripe for a turn, but the main trend is up right now
The oil price remains in...
READ MORE
MEMBERS ONLY
Wider Implications For A Sick Looking Dr. Copper?
by Martin Pring,
President, Pring Research
* Copper signals a primary bear market
* Copper’s influence on commodities in general
* Copper and bond yields
It’s often said that Copper has a PHD in economics because it is used widely in many economic sectors. As a result, long-term reversals in its price trend often foreshadow general swings...
READ MORE
MEMBERS ONLY
July Market Round Up With Martin Pring 2018-07-01
by Martin Pring,
President, Pring Research
Here is the link to my current thoughts about the global markets.
Good luck and good charting,
Martin J. Pring
The views expressed in this article are those of the author and do not necessarily reflect the position or opinion of Pring Turner Capital Group of Walnut Creek or its...
READ MORE
MEMBERS ONLY
Global and US Equity Markets On A Knife Edge
by Martin Pring,
President, Pring Research
* The US on a knife edge
* Global markets are also on the edge
* Individual regions largely around key support
Last week I wrote about the important upside breakout in the US market vis a vis the rest-of-the-world, and a previous article pointed out that the S&P had also...
READ MORE
MEMBERS ONLY
Global Equities Are Falling Apart But It's MAGA For US Relative Action
by Martin Pring,
President, Pring Research
* New bull market high for US equity relative action
* International markets are breaking down
* Commodities lose some upside momentum
US equities have been hit hard so far this week, but that’s nothing compared to China, Emerging Markets, Europe and other markets around the globe. As a result, we are...
READ MORE
MEMBERS ONLY
What Is The Gold Price Telling Us About The Stock Market?
by Martin Pring,
President, Pring Research
* Stocks are rising against gold and that’s bullish
* The long-term trend points to gold under-performing stocks
* Stock/Gold ratio breaks out from a right-angled broadening formation
The price of gold, over the short-term, typically rises and falls on global tensions or lack thereof. Longer-term trends though, are more influenced...
READ MORE
MEMBERS ONLY
NYSE Breakout Is Supported By Eight Sectors
by Martin Pring,
President, Pring Research
* NYSE breakout
* Multi-sector breakouts
* Green shoots coming through for Europe and emerging markets
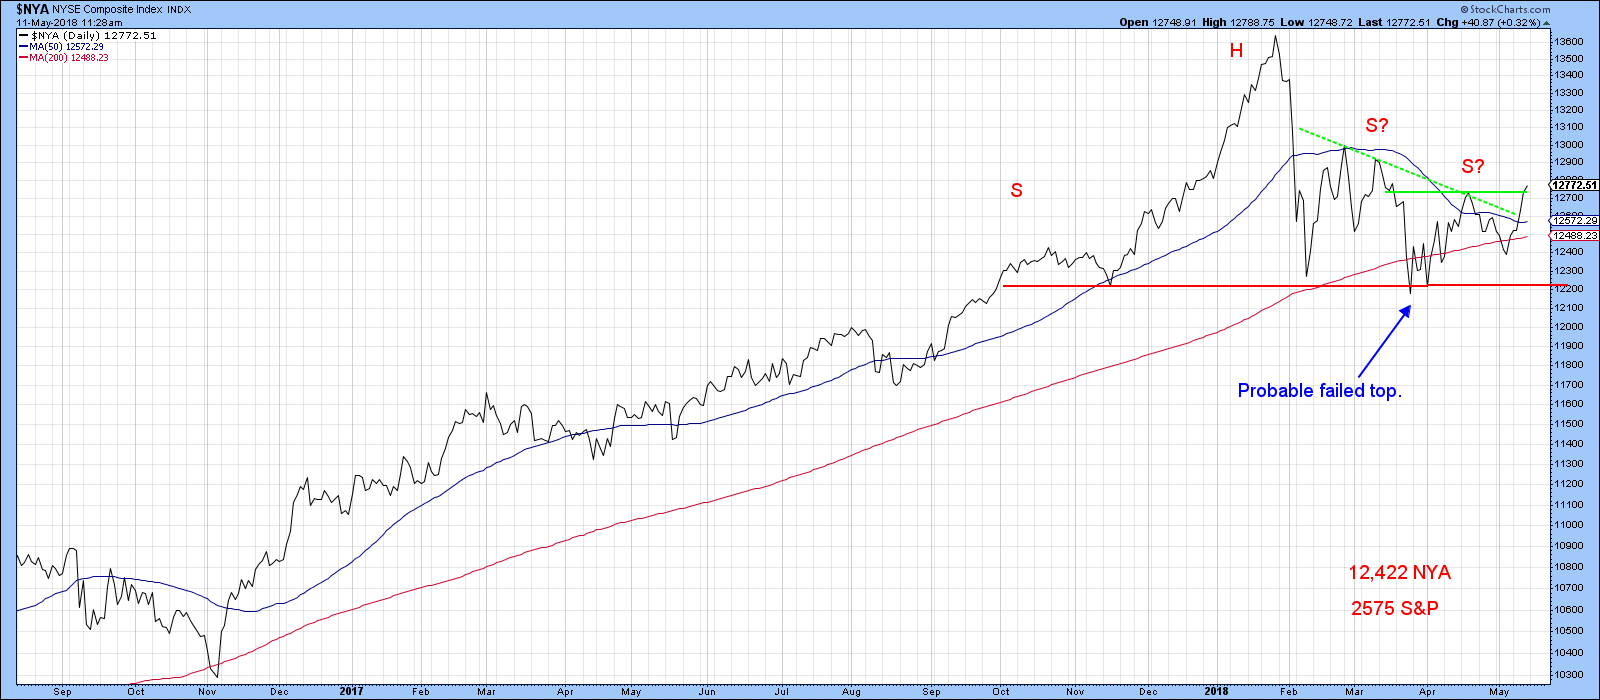
NYSE breakout
Monday’s action has seen the NYSE Composite, the $NYA complete a 4-month reverse head and shoulders pattern. If that breakout holds, and there are few grounds for suspecting that it won’t, it’s...
READ MORE
MEMBERS ONLY
Market Round Up June 2018
by Martin Pring,
President, Pring Research
Here is the link for the June 2018 Market Round Up.
Good luck and good charting,
Martin J. Pring
The views expressed in this article are those of the author and do not necessarily reflect the position or opinion of Pring Turner Capital Group of Walnut Creek or its affiliates....
READ MORE
MEMBERS ONLY
Equities At A Make-Or-Break Level What To Look Out For
by Martin Pring,
President, Pring Research
* CPI adjusted S&P is just above a long-term make-or-break point
* The rest of the world is at the brink
* US market looks stronger
CPI Adjusted S&P is just above a long-term make-or-break point
Last week I pointed out that US equities were experiencing a marginal upside...
READ MORE
MEMBERS ONLY
Market Roundup Live May 2018
by Martin Pring,
President, Pring Research
This is the Market Roundup for May 2018.
Good luck and good charting,
Martin J. Pring
The views expressed in this article are those of the author and do not necessarily reflect the position or opinion of Pring Turner Capital Group of Walnut Creek or its affiliates....
READ MORE
MEMBERS ONLY
US Equities Are Breaking Out Against The World
by Martin Pring,
President, Pring Research
* SPY experiences important relative breakouts
* World A/D Line unexpectedly breaks trend
* European and Emerging markets ETF’s experience major breakdowns
SPY experiences important relative breakouts
Earlier this morning I had the idea of writing about the relationship between the US and international markets, as this ratio usually does well...
READ MORE
MEMBERS ONLY
Two Markets Close To Basket Case Status
by Martin Pring,
President, Pring Research
* Commodities looking short-term toppy
* Copper close to a bear market signal that it may escape
* Oil trend is still positive but vulnerable
* Two markets close to a major breakdown
In a global stock market of predominantly long-term bullish charts, two country funds stand out as being on the verge of...
READ MORE
MEMBERS ONLY
Steady As She Goes: Several Indicators Say The Market Is Headed Higher
by Martin Pring,
President, Pring Research
Volume is offering a mixed picture
Last week I pointed out that several short-term indicators, including breadth and net new high indicators, were still pointing north. One area that was not showing any strength of note was volume, in the form of the PVO for the NYSE. Chart 1 shows...
READ MORE
MEMBERS ONLY
This Rally Looks Like It Has Legs
by Martin Pring,
President, Pring Research
* When a top is not a top
* The rally is broadly based
* Is the US about to out-perform the world again?
When a top is not a top
Last week I pointed out that several indicators were positioned for a nice rally. However, one of the lingering questions related to...
READ MORE
MEMBERS ONLY
Buy In May And Say Hooray?
by Martin Pring,
President, Pring Research
* Sell in May does not have a great track record
* Technology continues to outpace staples, and that’s bullish
* Technology, consumer cyclicals and REITS are well positioned for a rally
Sell in May does not have a great track record
If there is a seasonal saying that seems ubiquitous at...
READ MORE
MEMBERS ONLY
Dollar Breakout Starts To Infect Other Markets
by Martin Pring,
President, Pring Research
* Dollar Index breaks to the upside
* Dollar sympathy relationships
* The Aussie Dollar close to a mega signal for itself and commodities
Dollar Index breaks to the upside
Chart 1 shows that the Dollar Index falsely broke to the downside at the very beginning of the year. In the last couple...
READ MORE
MEMBERS ONLY
Who's Afraid Of The Big Bad 3%?
by Martin Pring,
President, Pring Research
* Technical position for yields still looks bullish
* International rates look higher
* Dollar breaks out, but will it hold?
* Finely balanced Gold picture needs some guidance from the Dollar
If you have punched up the symbol $TNX, you will know that the 10-year yield has recently hit 3%. Chances are that...
READ MORE
MEMBERS ONLY
Is The Breakout In The Dollar For Real?
by Martin Pring,
President, Pring Research
* The primary trend
* The short-term picture
* The Dollar, Copper and Gold
The Dollar Index showed some green shoots at the end of the week that might lead to greater things. That’s important in its own right, but since the dollar often moves inversely with commodities and gold its direction...
READ MORE
MEMBERS ONLY
More Indicators Are Flashing The All Clear
by Martin Pring,
President, Pring Research
* Bearish engulfing pattern and outside day are cancelled
* Breath indicators are firming up
Bearish engulfing pattern and outside day are cancelled
Last week I wrote that many of the short-term indicators were flashing buy signals and that we should expect the US equity market to work its way higher. I...
READ MORE
MEMBERS ONLY
DJIA Engulfing Pattern Suggests A Pause Before Higher Prices
by Martin Pring,
President, Pring Research
* A small correction ahead?
* Short-term oscillators are primed for a rally
* Bitcoin is breaking out again
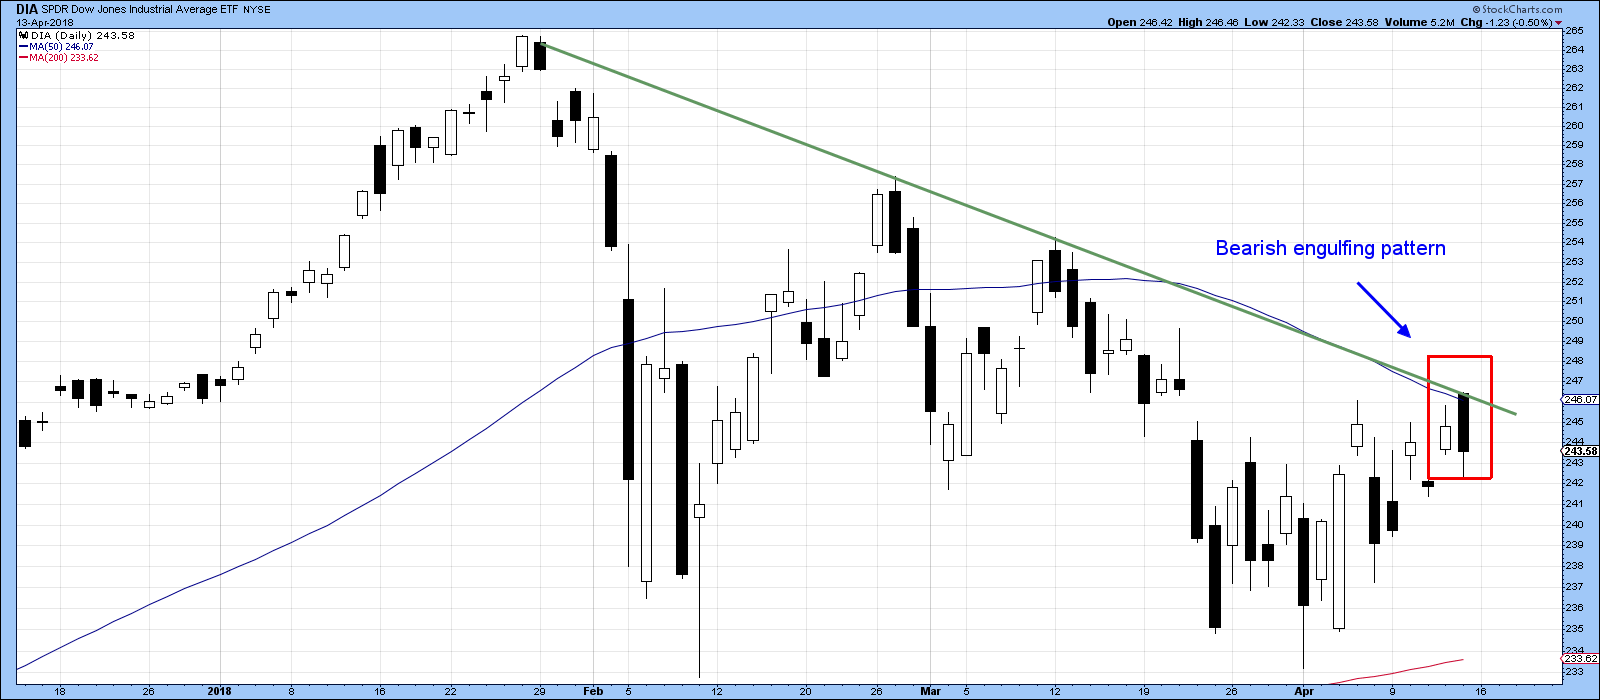
A small correction ahead?
If you want to be bullish, Friday’s technical action was somewhat disappointing. That’s because it represented an engulfing pattern for the DIA, as shown in Chart 1.
Chart...
READ MORE
MEMBERS ONLY
Small Caps May Be Breaking Out But Not All Are Created Equal
by Martin Pring,
President, Pring Research
* The technical position of small caps in general
* Small cap sectors
The technical position of small caps in general
Small caps, as represented by the Russell 2000 ETF (IWM), have outperformed the market since late March and have now broken out in their own right. We can see this from...
READ MORE
MEMBERS ONLY
Identifying The Tapestry Of A Market Top
by Martin Pring,
President, Pring Research
* The importance of identifying the direction of the primary trend
* The Shiller P/E
* The four-way test
The importance of identifying the primary trend
Sometimes it’s a good idea to step back from the everyday trading of daily charts and short-term activity and look at the big picture. If...
READ MORE
MEMBERS ONLY
Bottoms Up Part II
by Martin Pring,
President, Pring Research
* Positive breadth characteristics
* VIX is less fearful
* Short-term oscillators starting to get extremely oversold
* How about trend?
Last week I suggested that the market may be in the process of forming a double bottom. This week we take that possibility one step forward. Whenever the non-financial cable networks run a...
READ MORE
MEMBERS ONLY
Market Round Up April 2018
by Martin Pring,
President, Pring Research
Here is a link to the April edition of Market Round Up for 2018.
Martin-Pring-Market-Roundup-April-2018 from StockCharts.com on Vimeo.
Good luck and good charting,
Martin J. Pring
The views expressed in this article are those of the author and do not necessarily reflect the position or opinion of Pring...
READ MORE
MEMBERS ONLY
Bottoms Up?
by Martin Pring,
President, Pring Research
* Is the market forming a double bottom?
* Short-term indicators suggest the bottoming process is nearly complete
Sometimes a technical event or characteristic becomes very popular very quickly as a lot of people write and blog about them. Usually, the expectations based on those forecasts are not met. For example, every...
READ MORE
MEMBERS ONLY
NYSE Composite Draws Closer To Its 200-day And 12-month Moving Averages
by Martin Pring,
President, Pring Research
* Breadth is more of a positive than a negative factor
* Global breadth is also positive
* Dow Diffusion Indicator close to a buy signal
* Consumer cyclicals versus technology
Since early February, the US equity market, in the form of the NYSE Composite, has been in a trading range. This is flagged...
READ MORE