MEMBERS ONLY
When Will Rising Rates Hit The Stock Market?
by Martin Pring,
President, Pring Research
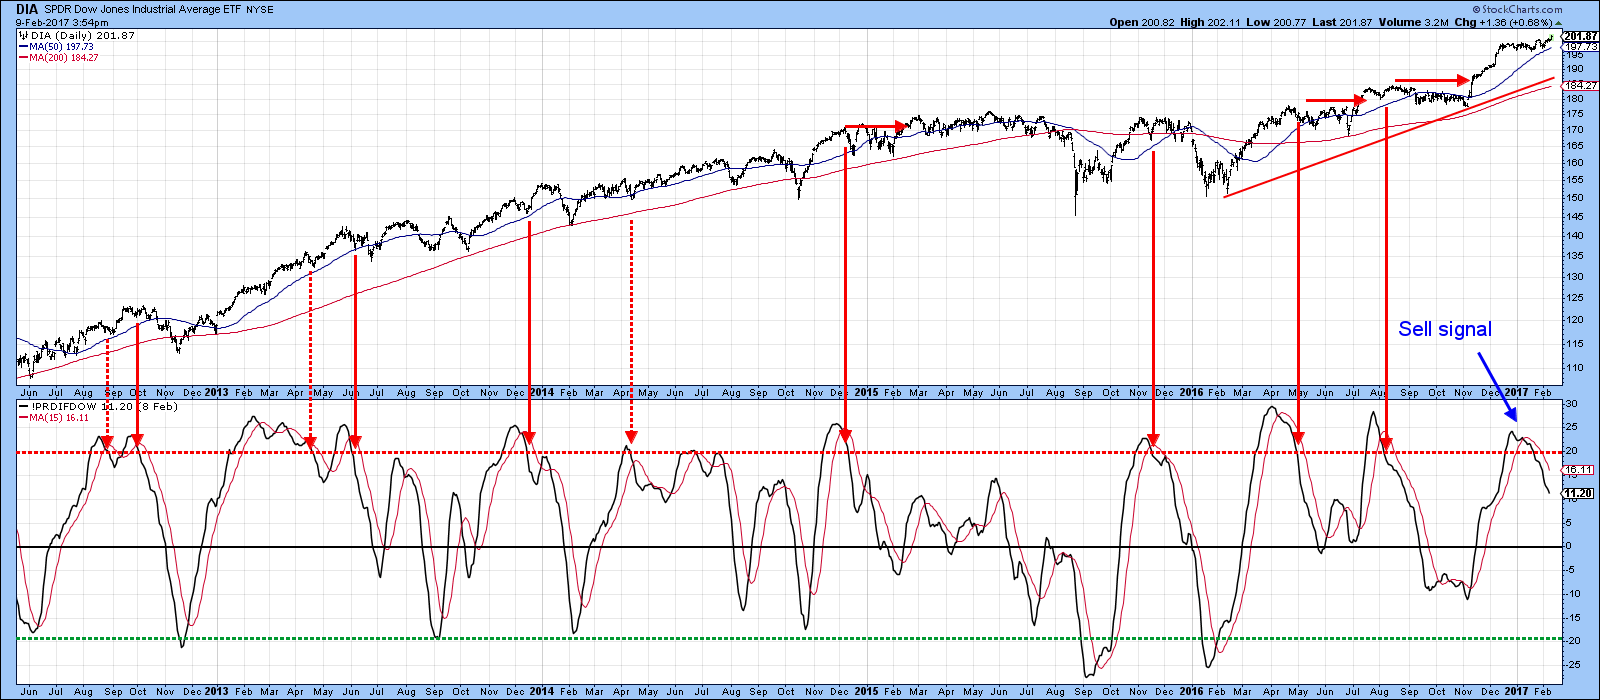
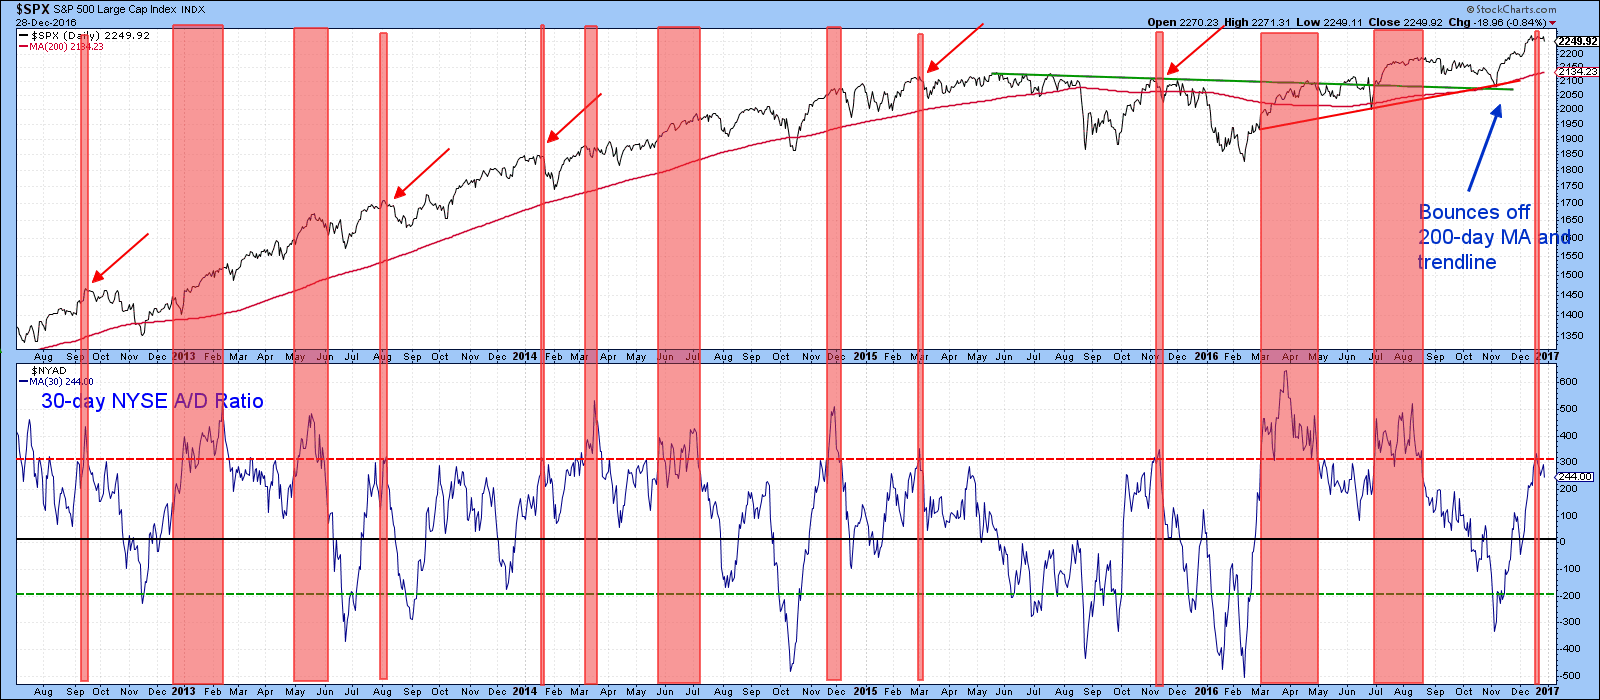
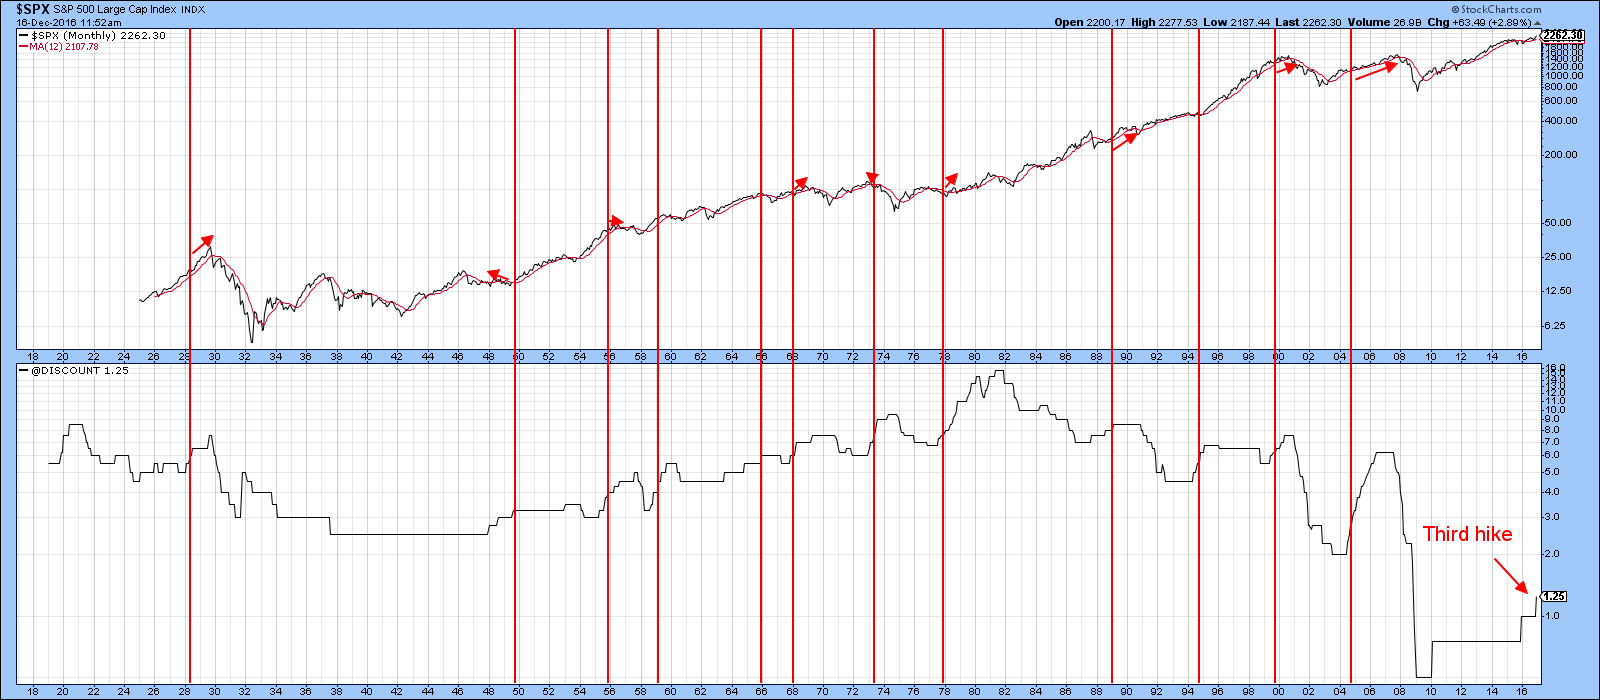
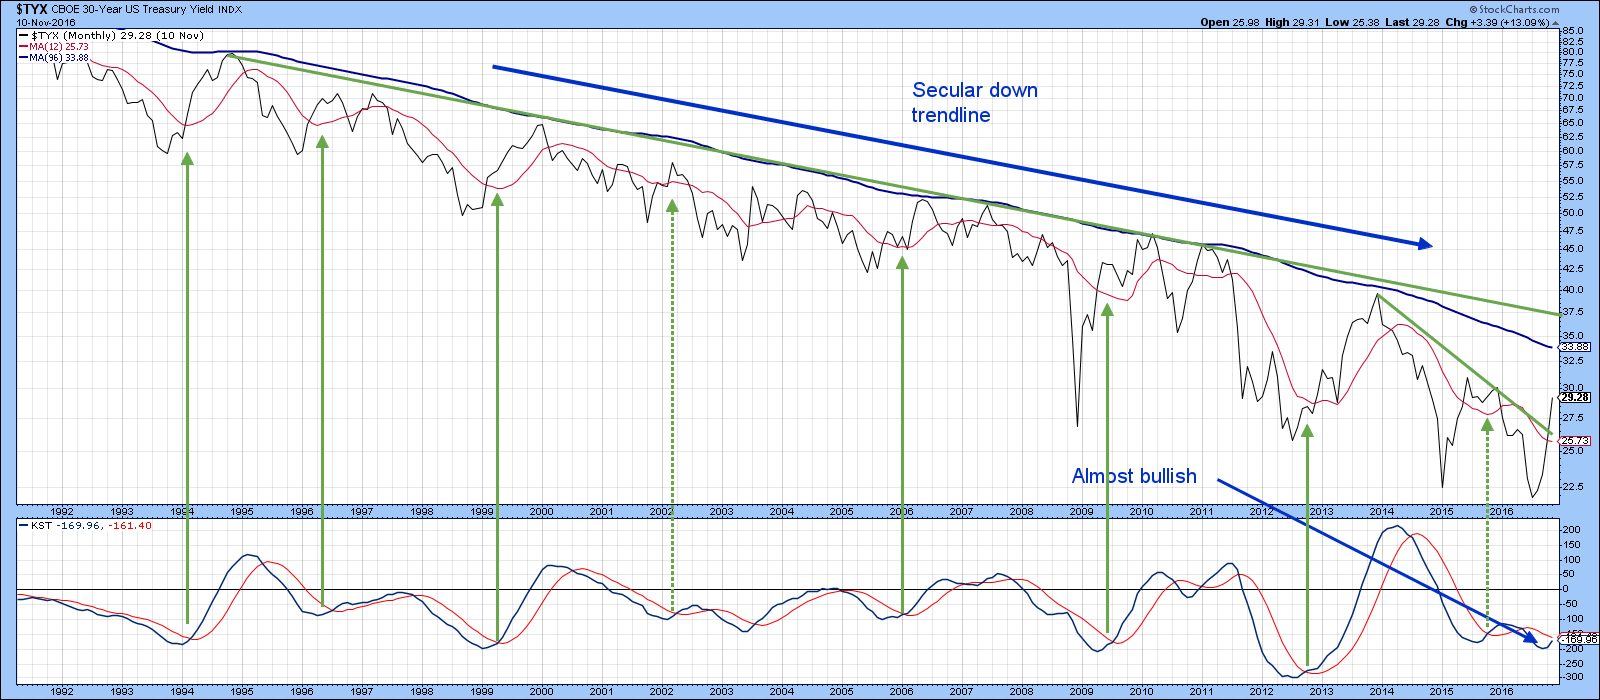
* No consistent relationship between rates and equity prices
* Three step and a stumble
* Combining interest rate movements with equity trends
No consistent relationship between rates and equity prices
A lot of prognosticators have recently raised concerns that rising rates will soon affect equities in an adverse way. Last week at...
READ MORE
MEMBERS ONLY
Is The Global Bull Market In Interest Rates Resuming?
by Martin Pring,
President, Pring Research
* The global picture
* Short-term rates
* Longer-term rates
* International rates
The Global Picture
When I talk about interest rates I am referring to a general advance that takes place at both ends of the yield spectrum. I make this reference because in many situations certain maturities and credit qualities do not...
READ MORE
MEMBERS ONLY
$GOLD : A Bear Market Rally Or A New Bull Market?
by Martin Pring,
President, Pring Research
* The all-important trading range
* The short-term trend for Gold
* What’s going on with those Gold shares?
* Hail Silver?
$GOLD has been rallying of late and the question naturally arises as to whether this advance is for real or is a normal bear market counter-cyclical advance. The answer is not...
READ MORE
MEMBERS ONLY
A Funny Thing May Be Happening On The Way To The Secular Bull Market In Interest Rates
by Martin Pring,
President, Pring Research
* How to spot a secular reversal
* Not all maturities are created equal
* The near-term technical picture
How to spot a secular reversal
A secular, or very long-term, trend is one that exists over many business cycles or what are usually called primary bull and bear markets. They vary in length...
READ MORE
MEMBERS ONLY
Is The Dollar Getting Ready To Make A Big Move?
by Martin Pring,
President, Pring Research
* The Dollar Index -- primary trend
* The Dollar Index viewed from the short-term trend
* The euro
* The yen
* The Canadian dollar
* Emerging market currencies
Expectations were high for the US Dollar ($USD) following the election and indeed, the currency did rally for a while. However, the trend for most of...
READ MORE
MEMBERS ONLY
Market Extends Gains As Breadth Surprisingly Improves
by Martin Pring,
President, Pring Research
More stocks trading above their 150-day MA’s
Last week I pointed out that many indicators were overstretched, thereby indicating the probability of a correction. I also stated that during a bull market, surprises typically develop on the upside. Consequently, if the market was able to shrug off its overbought...
READ MORE
MEMBERS ONLY
New Highs In The Market ... But Fewer Stocks Are Participating
by Martin Pring,
President, Pring Research
* Market still overstretched
* Greater selectivity as the market moves higher
* Whatever happened to China?
Last week, I pointed out that several indicators were pointing to a short-term correction. I also said that counter-cyclical corrections are difficult to play, essentially because they are usually over before you realize it. To quote...
READ MORE
MEMBERS ONLY
Are Housing Stocks Topping Out?
by Martin Pring,
President, Pring Research
* Housing economic data is finely balanced
* The long-term technicals for housing equities are also evenly matched
* The bearish short-term picture could be the domino that tips everything
Housing economic data is finely balanced
The housing industry has not exactly been on a roll since the last recession, but it has...
READ MORE
MEMBERS ONLY
The Main Trend Is Still Positive But The Consensus Says?
by Martin Pring,
President, Pring Research
* One reliable long-term indicator is bullish
* What are the short-term indicators saying?
* Bottom fisher to the rescue?
The long-term indicators for equities have been pointing north for quite a while. Quite often I’ll include one of those indicators in my articles as testimony to the bull, but hedge my...
READ MORE
MEMBERS ONLY
World Equities Surging to New Highs
by Martin Pring,
President, Pring Research
* Global A/D Line breaks to the upside
* Post-election trends
* US equities
* The 10-year Yield
* Gold
* The Dollar Index
* Commodities
Global A/D Line breaks to the upside
This week has seen an important breakout for equities. I am not referring to Dow 20,000 but to my Global A/...
READ MORE
MEMBERS ONLY
Some Country ETF's To Watch If The Rest Of The World Starts To Out Perform The US
by Martin Pring,
President, Pring Research
* The current status of the US versus the rest of the world
* Europe
* Asia
* Latin America
The current status of the US versus the rest of the world
Earlier in the week I pointed out that the trend of superior performance by the US against the "rest of the...
READ MORE
MEMBERS ONLY
Is It Time To Emphasize Overseas Equities?
by Martin Pring,
President, Pring Research
* Gauging the trend between the US and the rest of the world
* Relative performance of the US is largely dependent on the direction of the Dollar
* Special K is close to a relative sell signal for the US
* What does “The rest of the world” look like?
* A few comments...
READ MORE
MEMBERS ONLY
Is The Pound About To Head For Parity With The Dollar?
by Martin Pring,
President, Pring Research
* Long-term perspective
* The short-term picture
* The Pound against other major currencies
* Watch that gold!
Long-term perspective
Last October, I wrote an article entitled “British Pound Headed For Par, But Not Now”. The long-term case rested on the fact that the Pound, when measured against the Dollar, had completed a 30-year...
READ MORE
MEMBERS ONLY
Are Post Election Market Trends Starting To Reverse In 2017?
by Martin Pring,
President, Pring Research
* The long-term equity trend is bullish, but watch carefully
* Short-term technicals for equities
* Short-term technicals for yields and bond prices
* Short-term technicals for the Dollar Index, Gold and Commodities
The post-election trends I am referring to in the title refer but are not limited to, the five series plotted in...
READ MORE
MEMBERS ONLY
Three Charts That Suggest Dow 20,000 Will Happen Later Rather Than Sooner
by Martin Pring,
President, Pring Research
* Signs of short-term exhaustion
* Watch those housing ETF’s
* Shanghai is down, but is it out?
Even bull markets need to pause for breath as profits are digested and doubts sown concerning the validity of the prevailing trend. We may have come to such a moment.
Signs of short-term exhaustion...
READ MORE
MEMBERS ONLY
Yes, 20,000 Does Matter, But Not In The Way You Might Think
by Martin Pring,
President, Pring Research
* Twenty thousand, a media point on the charts
* The real 20,000 event
* International markets that deserve a closer look
Twenty thousand, a media point on the charts
For some time, our friends in the media have been touting Dow 20,000 ($INDU) as if something magical is going to...
READ MORE
MEMBERS ONLY
Three Steps And A Stumble?
by Martin Pring,
President, Pring Research
* Three steps and a stumble
* Interest rates are now driving the US Dollar
* Charts for the Euro, Yen and Swiss Franc continue to erode
Three steps and a stumble
The late great Edson Gould coined the term “Three Steps And A Stumble”. He was referring to his observation that when...
READ MORE
MEMBERS ONLY
Are They About To Take The Punch Bowl Away From The Party?
by Martin Pring,
President, Pring Research
* Some key averages showing signs of temporary exhaustion
* Energy burnt out?
* Defensives and interest sensitives looking more positive
* What about those bonds?
I have been bullish on the stock market for some time and in terms of the main trend I still am. I also council on focusing on the...
READ MORE
MEMBERS ONLY
What Can We Learn From Recent Gold Price Action About Where Commodity Prices Are Headed?
by Martin Pring,
President, Pring Research
* Using Gold as a barometer for commodity prices
* Gold versus other precious metals
* Gold and the stock market
Earlier in the week I wrote an article pointing out the fact that the Gold price ($GOLD), technically speaking, had reached, what seemed to me, to be a critical technical point. That...
READ MORE
MEMBERS ONLY
The Next Two Months Will Be Critical For Gold
by Martin Pring,
President, Pring Research
* Will the current short-term oversold level in Gold trigger a rally to reverse long-term bear signals?
* Gold leads commodities
* Gold breaks down against some commodities
Will the current short-term oversold trigger a sufficient rally to reverse long-term bear signals?
Earlier in the year $GOLD proved to be one of the...
READ MORE
MEMBERS ONLY
Are We At The End Of The Trump Rally?
by Martin Pring,
President, Pring Research
* A different way of looking at the VIX
* What about global equities?
* Sectors are largely pointing north
* Are commodities about to break out?
The market has been rising in an uninterrupted fashion since early November, on the back of a Trump election victory. The question naturally arises as to whether...
READ MORE
MEMBERS ONLY
Why Is A Strong Housing Report Is Good For The Stock Market
by Martin Pring,
President, Pring Research
* Subdued response to great housing numbers is a bullish sign
* What does this mean for housing stocks?
* Housing conclusion
* Small cap big profits?
Subdued response to great housing numbers is a bullish sign
Sometimes very important developments for the market receive widespread attention, quickly experiencing a swing in sentiment as...
READ MORE
MEMBERS ONLY
Why Is 1.75% So Critically Important?
by Martin Pring,
President, Pring Research
* What’s the direction of the primary trend of interest rates?
* What do the shorter-term maturities say?
* Appraising the short-term technicals
In early September, I wrote an article suggesting that things were beginning to fall in place for higher yields. Since then they have edged up a bit, but look...
READ MORE
MEMBERS ONLY
Monday Triggers A Dow Theory Buy Signal
by Martin Pring,
President, Pring Research
* A brief synopsis of Dow Theory
* Transports could be explosive
* Was there anything wrong with Monday’s rally?
* Market remains short-term oversold
* Good looking ETF’s
Monday's explosion in prices sent the Dow Transports well above their previous intermediate high. This price action confirms the buy signal already...
READ MORE
MEMBERS ONLY
Is It Time To Give Up On The Stock Market?
by Martin Pring,
President, Pring Research
* What’s happening at the margin?
* Short-term technical position oversold…but
* Gold breaks out against bonds
* Dollar showing weakness
What’s happening at the margin?
Last week I wrote an upbeat article pointing out that the stock market was oversold on a near-term basis as it approached a bullish seasonal...
READ MORE
MEMBERS ONLY
Bullish Seasonals And A Near-Term Oversold Condition Argue For An Interesting November
by Martin Pring,
President, Pring Research
* Seasonals are bullish
* Current condition of some short-term indicators
* The bullish part of the year
* Time to raise those beta glasses?
The stock market has really been in a trading range for the last two years. At my bi-weekly webinar this week, I pointed out that several long-term indicators have...
READ MORE
MEMBERS ONLY
Is The Price Of Gold Still In A Bull Market?
by Martin Pring,
President, Pring Research
* Long-term perspective
* What are gold shares saying?
* Gold and the dollar
* Conclusion
The question of whether gold is in a primary bull market keeps coming up in the Q & A part of my bi-weekly Tuesday webinars. Given the recent drop in the price, this question is becoming increasingly relevant....
READ MORE
MEMBERS ONLY
If The Market Gets Liftoff, Which Sectors Are Likely To Lead?
by Martin Pring,
President, Pring Research
* The long-term perspective
* Short-term indicators partially bullish
* Sectors offering positive relative action
The Long-term perspective
The US equity market has been moving sideways since July and has certainly worked off any short-term overbought condition. Some indicators are oversold, while others are still declining. During a bear market, these short-term indicators...
READ MORE
MEMBERS ONLY
British Pound Headed For Par, But Not Now
by Martin Pring,
President, Pring Research
* Long-term technicals for the pound
* Short-term technicals for the pound
* TIP of the day!
* The potential spoiler?
Long-term technicals for the pound
Chart 1 shows that the British Pound has completed a 30-year top. The price objective, calculated by taking the maximum depth of the formation and projecting it down...
READ MORE
MEMBERS ONLY
Commodities: On Your Mark, Get Set, Go?
by Martin Pring,
President, Pring Research
* Long-term picture at a critical juncture point
* Global commodities poised for an upside breakout
* What about commodities against other assets?
* If commodities break out so will yields?
Long-term picture at a critical juncture point
Chart 1 shows the long-term technical position of the CRB Composite ($CRB), where you can see...
READ MORE
MEMBERS ONLY
1987 And Now
by Martin Pring,
President, Pring Research
* Could it be 1987 deja-vu all over again?
* Why it’s not 1987
* Conclusion
A savvy subscriber to my monthly Intermarket Review sent me a copy of Chart 1 yesterday. Whenever he forwards me a relationship in chart format, it is usually pointing out a different conclusion than that set...
READ MORE
MEMBERS ONLY
Introducing The Special K Scan
by Martin Pring,
President, Pring Research
Rationale for the Special K
At my Chartcon presentation, I outlined the characteristics and uses of my Special K indicator and introduced a new advanced scan for identifying trading signals. I’ll talk about that, as well as how you can set up such scans later, but first a rationale...
READ MORE
MEMBERS ONLY
The Quiet Before The Storm?
by Martin Pring,
President, Pring Research
* Major stock averages are at major support
* Stocks or bonds?
* What about the rest of the world?
* Inflation/deflation inter-asset relationships
The media seems to be fixated with potential central bank action this week but the markets are barely able to keep their eyes open. This is becoming one-big-yawn! I...
READ MORE
MEMBERS ONLY
It May Be Time To Get Bullish Again
by Martin Pring,
President, Pring Research
* Broadening formation is still bullish
* What are the short-term indicators saying?
* What are important intermarket relationships saying about the recent drop?
* Is Dr. Copper about to make a house call?
On balance, the stock market has dropped since early last week, but peripheral price action has been constructive. That leads...
READ MORE
MEMBERS ONLY
The Case For Rising Rates Is Starting To Fall In Place
by Martin Pring,
President, Pring Research
The long-term picture
A couple of weeks ago I started to make the case for rising rates, based partly on the kind of price action featured in Chart 1. However, what was needed to reverse some of the longer term trends of falling yields and rising prices in the credit...
READ MORE
MEMBERS ONLY
Commodities - Trick Or Treat?
by Martin Pring,
President, Pring Research
* Two possible scenarios for commodities
* The primary trend picture
* Commodity breadth
* What’s the bond market saying?
Two possible scenarios for commodities
The last time I wrote about commodities my comments had a bullish slant. The CRB Composite ($CRB), having experienced an approximate 8-week correction involving a successful test of...
READ MORE
MEMBERS ONLY
Look Up Not Down: This Time For Interest Rates
by Martin Pring,
President, Pring Research
* Two reliable indicators point to a new bull market in interest rates
* What are the short-term technicals saying about rates?
* High versus low beta
Two reliable indicators point to a new bull market in interest rates
Last week I wrote that the vast majority of long-term stock market indicators were...
READ MORE
MEMBERS ONLY
Look Up Not Down
by Martin Pring,
President, Pring Research
* More corrective activity to come?
* Are we there yet with Dow Theory?
* Does the correction matter?
The market has been moving sideways for the last 2 months, thereby frustrating bull and bear alike. Chart 1 shows that the technical position, so far as breadth is concerned, has been improving. That...
READ MORE
MEMBERS ONLY
Is It Time To Emphasize Commodities And Reduce Bond Exposure?
by Martin Pring,
President, Pring Research
* The Six Stages
* Characteristics of Stage IV
* The stock market’s view on commodities
* All that glitters
The Six Stages
In the latest bi-weekly Market Round Up Webinar I looked at several inter-asset relationships to see which ones are likely to outperform going forward (watch the webinar here). To start...
READ MORE
MEMBERS ONLY
The World Order May Be Changing
by Martin Pring,
President, Pring Research
* The S&P 500 versus the world
* If things go against the US, where would be a good place to be?
* A true contrarian play
The S&P 500 versus the world
For several years the US stock market has been outperforming the rest of the world in...
READ MORE


