MEMBERS ONLY
The Battle Between Fed Chairman and the President Will Ultimately Be Won by the Market!
by Martin Pring,
President, Pring Research
The President and the Fed Chair have been in a battle over lower rates for some time. One has been pressuring for easy money to boost the economy, the other prefers to hold off for a while to see what effects the tariffs and other factors might have on inflation....
READ MORE
MEMBERS ONLY
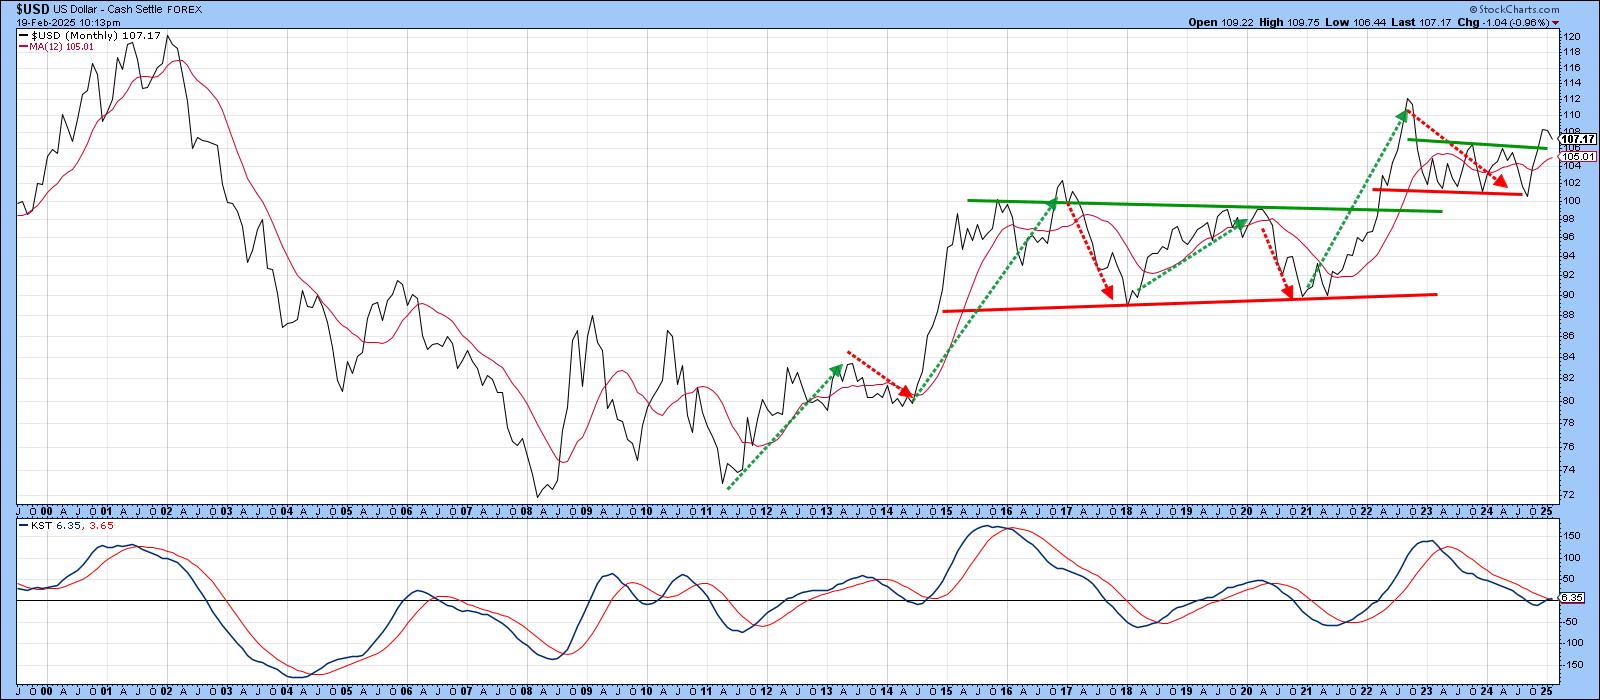
The Dollar Index Just Gave a Major Sell Signal - Does That Mean It's About to Implode?
by Martin Pring,
President, Pring Research
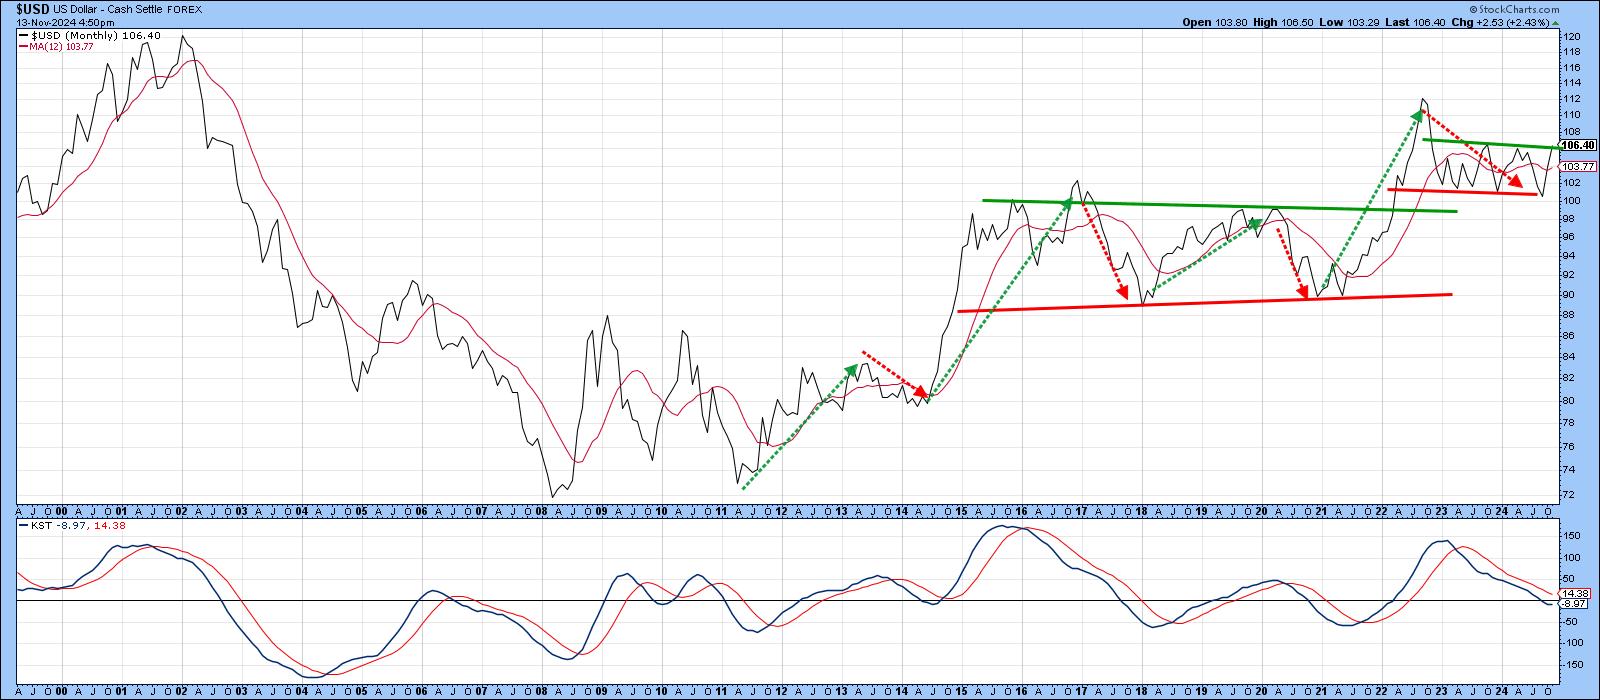
Last month, the Dollar Index triggered a number of sell signals confirming that it is in a bear market. Chart 1, for instance, shows that the red up trendline emanating in 2011 has been decisively ruptured, thereby pushing the Index further below its moving average. The Coppock Curve, seen in...
READ MORE
MEMBERS ONLY
Never Easy to Predict, the Price of Crude Just Got Harder
by Martin Pring,
President, Pring Research
Earlier in the month, I wrote an article pointing out that gold and copper typically move ahead of oil. It's true, the leads and lags between these three entities differ from cycle to cycle. However, since gold momentum turned up in early 2023 and copper in early 2022,...
READ MORE
MEMBERS ONLY
G7 Meeting in Canada Could Be Opportune Time for Accumulating Canadian Dollar and Canadian Equities
by Martin Pring,
President, Pring Research
The Canadian dollar peaked in 2007 and 2011 at around $1.05, and it has been zig-zagging downwards ever since. Now at a lowly 73 cents USD, the currency looks as if it may be in the process of bottoming, or at the very least entering a multi-year trading range....
READ MORE
MEMBERS ONLY
This Widely Used Commodity Could Be About to Surprise Us on the Upside
by Martin Pring,
President, Pring Research
Chart 1 lays out the long-term momentum (KST) relationship between gold, copper, and crude oil for the last 30 years. The arrows slant towards the right, indicating that gold leads copper, which subsequently turns up ahead of oil. Gold reversed to the upside in early 2023 and copper at the...
READ MORE
MEMBERS ONLY
This Important Metal Could Be on the Verge of a Mega-Breakout
by Martin Pring,
President, Pring Research
Gold has been on a tear since 2022, leaving other metals in the dust. Nevertheless, it's important to remember that the yellow metal has a strong tendency to lead commodities in general, which implies the likelihood of inflationary pressures in the commodity pits going forward. The leads and...
READ MORE
MEMBERS ONLY
Five Charts I Am Watching Closely
by Martin Pring,
President, Pring Research
Each week, I monitor numerous charts to see if they have the potential for an important breakout. I tend to look at longer-term ones, because they set the scene as to whether the primary trend is bullish or bearish. That's important information to have, as the magnitude and...
READ MORE
MEMBERS ONLY
Why the May 31 Close is Pivotal To Determine Primary Trend's Direction
by Martin Pring,
President, Pring Research
Way back in 1988, Robert W. Colby and Thomas A. Meyers authored a classic technical analysis book entitled Encyclopedia of Technical Market Indicators, in which they back-tested the performance of hundreds of market indicators. What caught my eye was their work on 12-month moving average (MA) crossovers, which offered the...
READ MORE
MEMBERS ONLY
Is It Time for Emerging Markets to Emerge?
by Martin Pring,
President, Pring Research
The US market has been recovering nicely since the April low, but it has actually been outperformed by the rest of the world this year so far. In that respect, Chart 1 shows that a major shift away from the US could well be in the cards.
It is evident...
READ MORE
MEMBERS ONLY
Gold Is Showing Signs of Exhaustion, But Is It Enough to Call a Top?
by Martin Pring,
President, Pring Research
Chart 1 shows that inflation-adjusted gold recently broke above a 45-year line of resistance. Since the third leg of the secular bull market began in 2023, the price of the yellow metal has been moving up sharply, thereby propelling the long-term KST to the edge of its overbought zone. It...
READ MORE
MEMBERS ONLY
If Non-US Equities Continue to Outperform the S&P, Will Europe or Asia Benefit Most?
by Martin Pring,
President, Pring Research
Since the tariff war first broke out, there have been widespread reports in the financial press telling us that investors have decided to cash in on their U.S. profits and move their capital abroad. The U.S., they tell us, is no longer regarded as a safe haven. Indeed,...
READ MORE
MEMBERS ONLY
Bonds Down, But Are They Out?
by Martin Pring,
President, Pring Research
Something didn't seem to ring true a couple of weeks ago when the whole world, by which I mean from the Treasury Secretary to your favorite cable news host, seized on the recent sell-off in bonds and why they would no longer be a safe haven and therefore...
READ MORE
MEMBERS ONLY
Gold is at a Record High -- Is There a Message?
by Martin Pring,
President, Pring Research
The recent rally in the gold price has not yet attracted the kind of gold fever associated with the 1980 peak. At that time, there were numerous reports of unusual action, such as customers forming huge lines to buy the stuff at Canadian banks, an event that to my knowledge...
READ MORE
MEMBERS ONLY
Are the Tariffs Bullish or Bearish for the US Dollar?
by Martin Pring,
President, Pring Research
Tariffs have been front and center of market attention, but one asset class that has been relatively subdued in its response has been the US Dollar Index. It has declined in recent weeks, but a review of the technical picture suggests that the sell-off is part of an overall corrective...
READ MORE
MEMBERS ONLY
Sentiment Is Near-Perfect for a Rally: One Thing Could Stand In the Way
by Martin Pring,
President, Pring Research
KEY TAKEAWAYS
* Several sentiment indicators have reached levels that usually fuel a worthwhile rally or jump-started a new bull market.
* Sentiment indicators could be at levels that are ripe for a rally but keep an eye on them.
* The absence of a rally could increase the odds of a bull...
READ MORE
MEMBERS ONLY
Is It Time to Buy Tesla?
by Martin Pring,
President, Pring Research
Recently, there have been horror stories about individual Tesla owners being harassed and dealers being vandalized, all because people have decided they don't like Elon Musk or his recent DOGE actions. In Europe, sales are reported down 49% in the first two months of the year, and, to...
READ MORE
MEMBERS ONLY
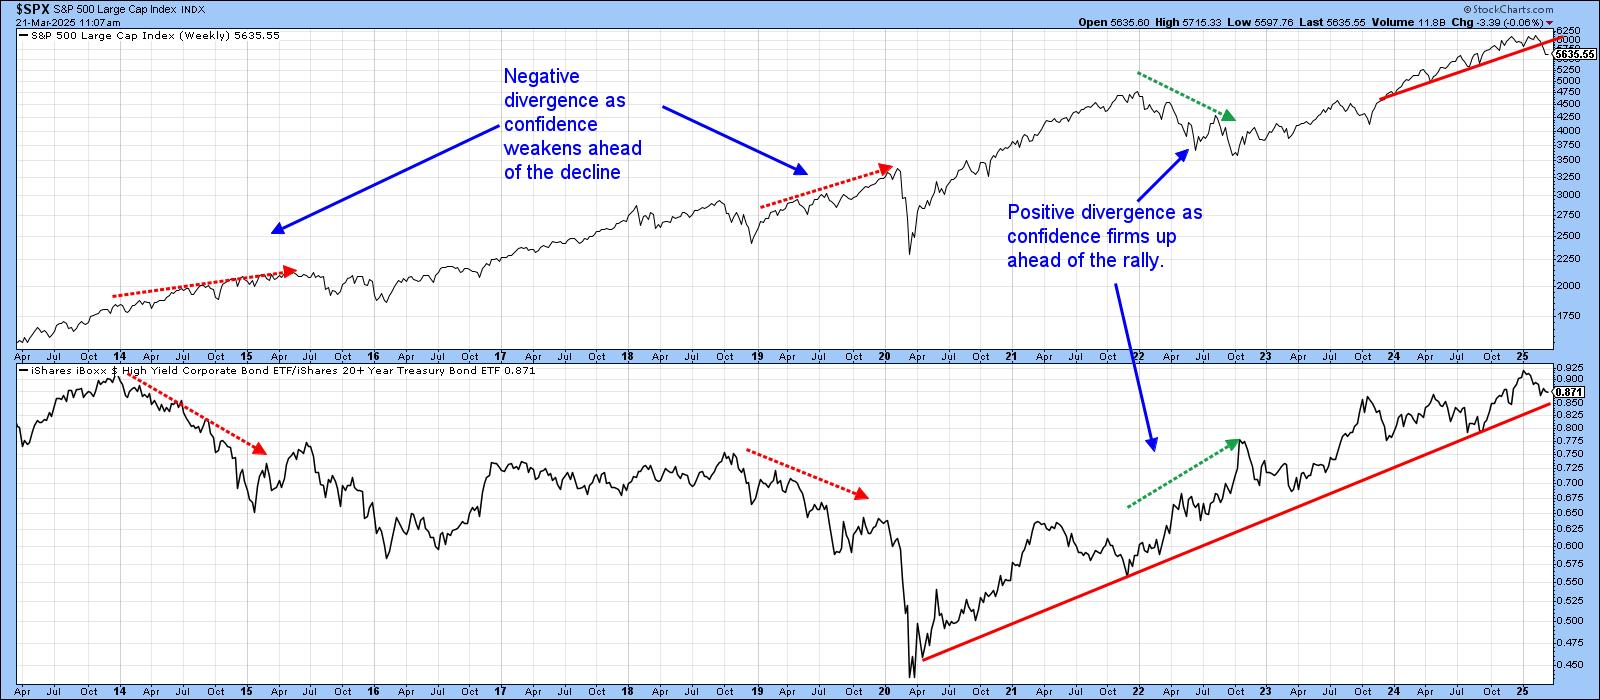
Confidence Ratios are in an Uptrend, But Looking Vulnerable
by Martin Pring,
President, Pring Research
At this week's news conference, Jerome Powell mentioned that the Fed is cautious about making significant changes to interest rates due to unclear economic conditions, citing factors like trade policies and inflation, which have contributed to this uncertainty. If the "experts" don't know, it&...
READ MORE
MEMBERS ONLY
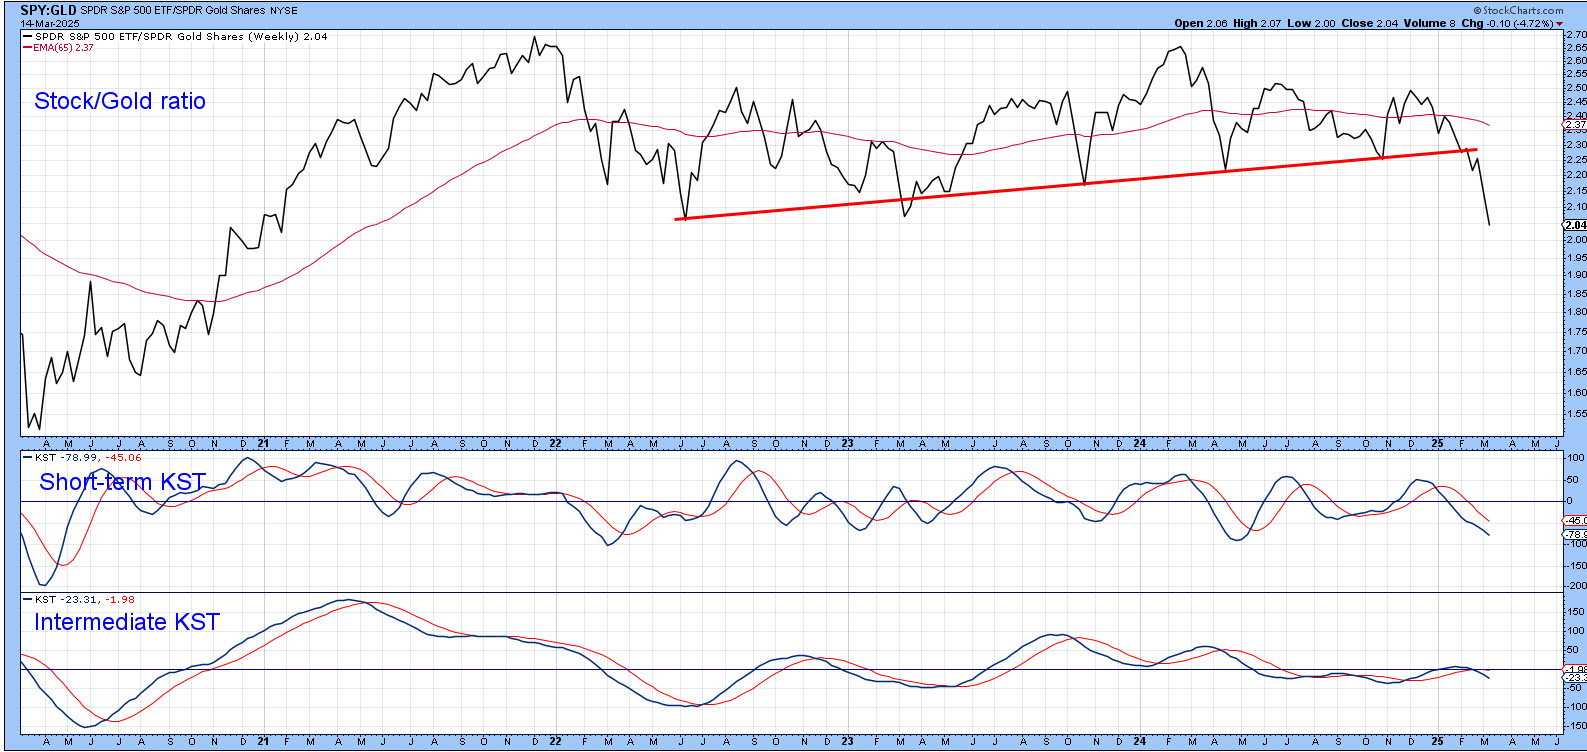
Stocks May No Longer Be the Preferred Asset Class
by Martin Pring,
President, Pring Research
A couple of weeks ago, I wrote that stocks were beginning to slip against the gold price. Chart 1 shows that the ratio has now decisively broken below an important uptrend line, marking the lower region of a three-year top. The short-term KST is currently oversold, so some kind of...
READ MORE
MEMBERS ONLY
Up Now, Down Later?
by Martin Pring,
President, Pring Research
The Hysteria
Last week I saw more references to the stock market and its sharp drop on cable TV than I can ever recall.
Normally, as Humphrey Neil, the father of contrarian thinking put it, "When everyone thinks the same, everyone is usually wrong." That's because...
READ MORE
MEMBERS ONLY
Bitcoin Faces Important Technical Test
by Martin Pring,
President, Pring Research
Over the weekend, Donald Trump declared the creation of a U.S. strategic crypto reserve, which will include Bitcoin and four other cryptocurrencies. The price immediately responded with a substantial rally over the weekend, but, by the close of business on Monday, had given up all of those gains. That...
READ MORE
MEMBERS ONLY
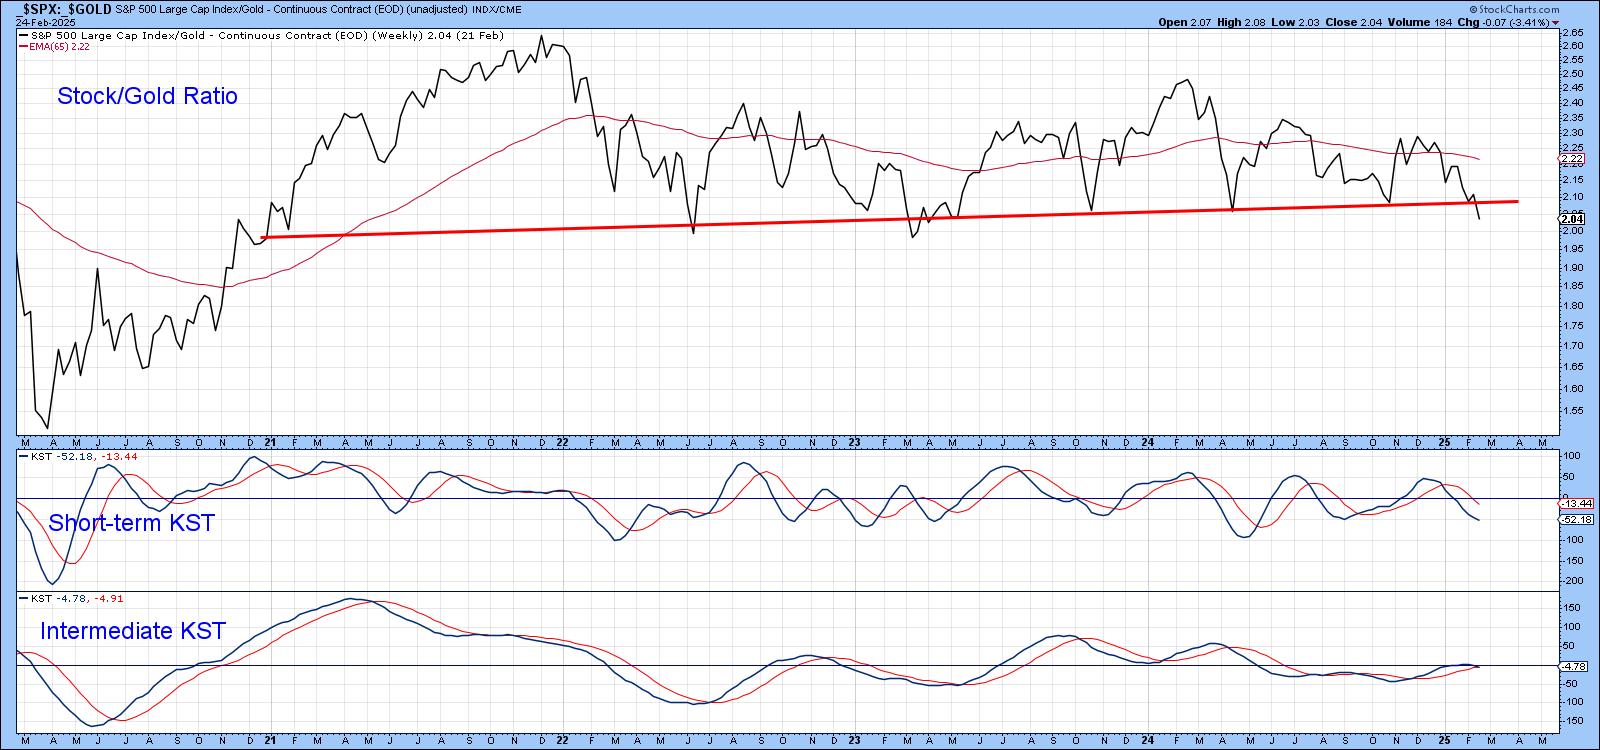
Stocks Starting to Break Down Against This Key Asset
by Martin Pring,
President, Pring Research
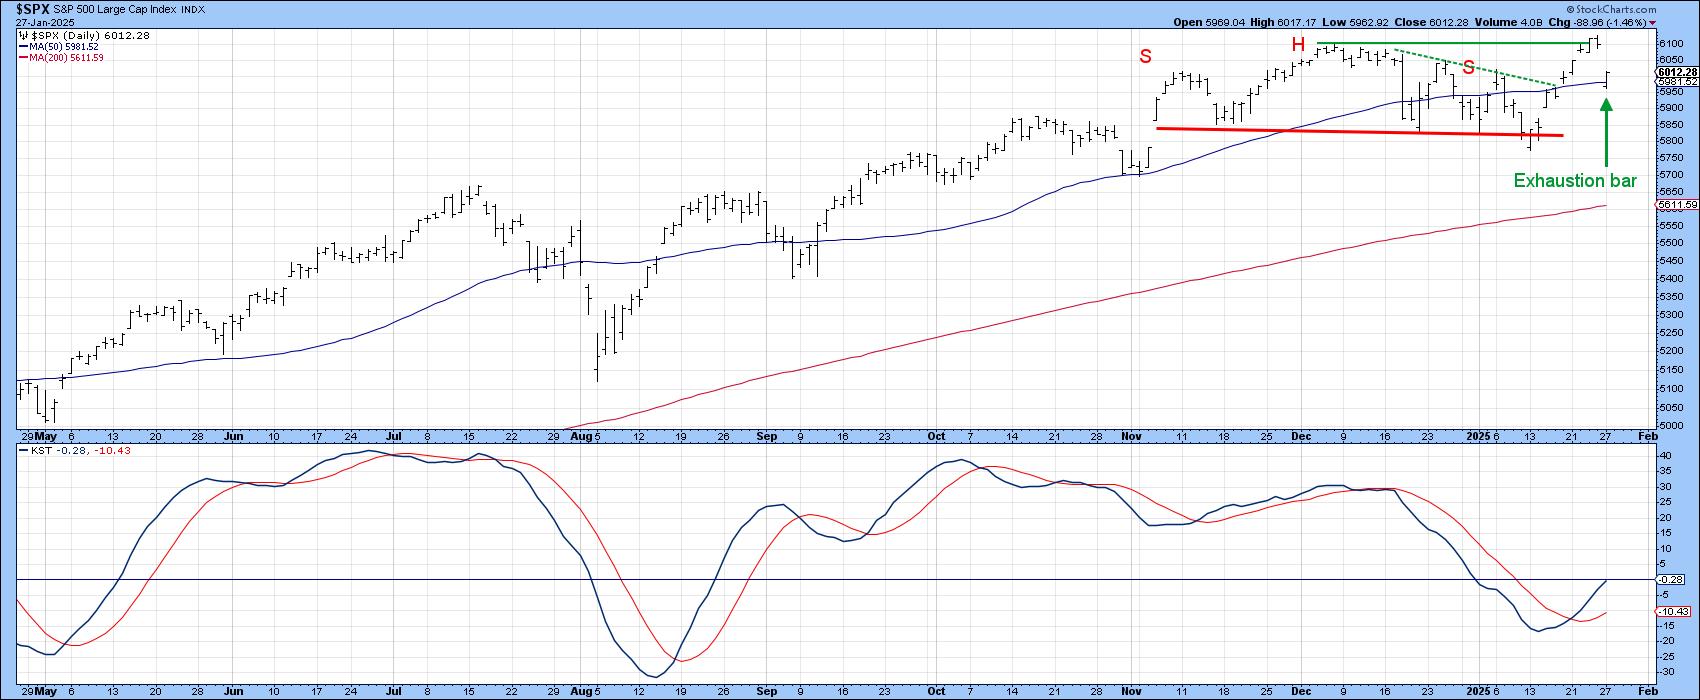
The S&P Composite ($SPX) briefly touched a new all-time high last week, which sounds encouraging. However, that kind of action was limited, as neither the Dow Industrials nor the NASDAQ Composite reached record territory. Such discrepancies can always be cleared up, of course, but more troubling is the...
READ MORE
MEMBERS ONLY
If a Rising Tide Lifts All Boats, What Does It Mean for the Dollar?
by Martin Pring,
President, Pring Research
KEY TAKEAWAYS
* The US dollar is still in a bullish trend.
* An analysis of a secular trend, primary trend, and short-term trend support the dollar's bullish case.
* The Pring Dollar Diffusion indicator tends to lead the action of the US dollar and is indicating a bullish move ahead....
READ MORE
MEMBERS ONLY
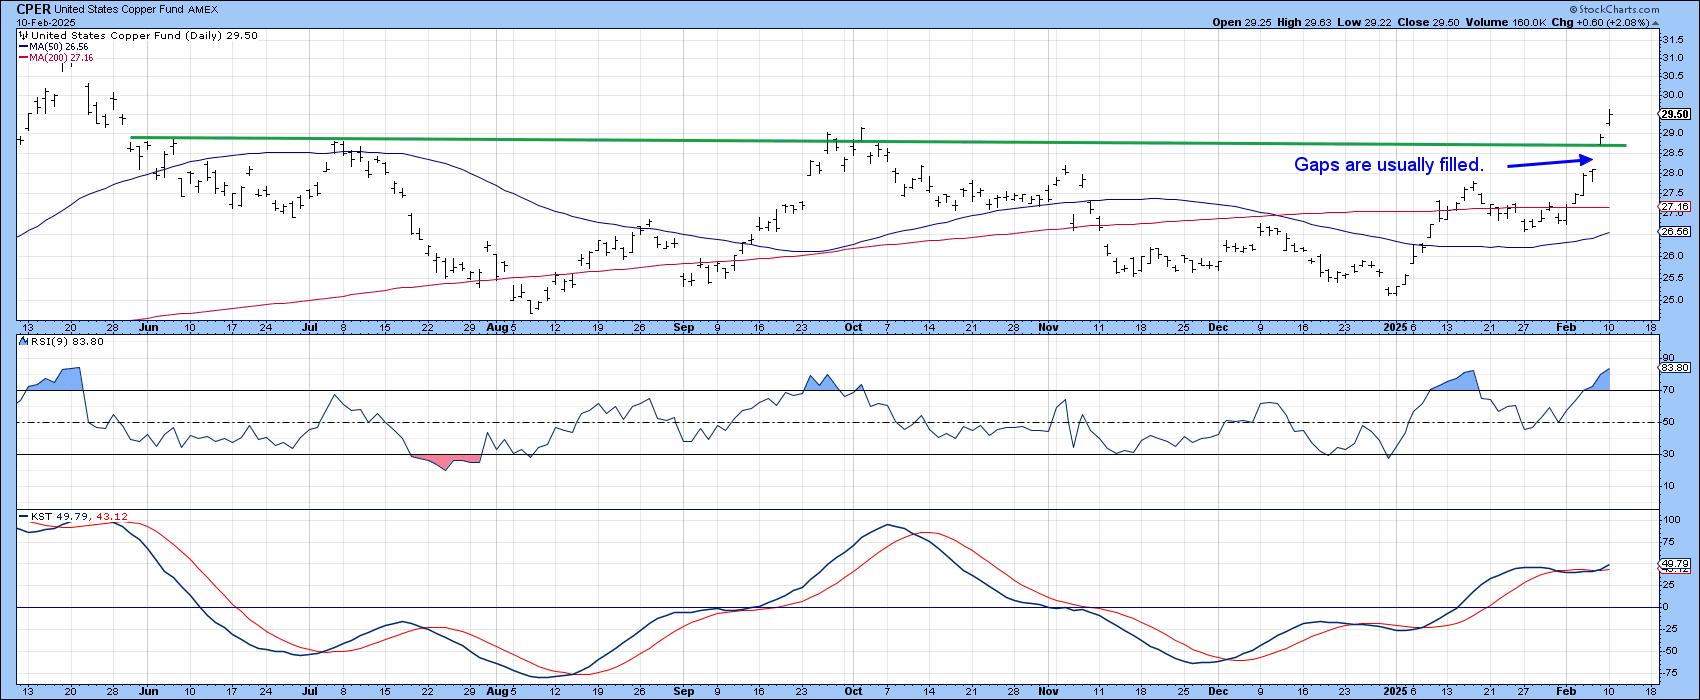
Dr Copper Could Be Close to a Major Breakout. What That Could Mean for the CPI
by Martin Pring,
President, Pring Research
The nickname "Dr. Copper" comes from its reputation as a reliable economic indicator. That's because it is used worldwide in a wide range of industries, including construction, electronics, and manufacturing. When demand for the red metal is high, it often signals that these industries are booming,...
READ MORE
MEMBERS ONLY
Forget Technology and Take a Look at This Sector
by Martin Pring,
President, Pring Research
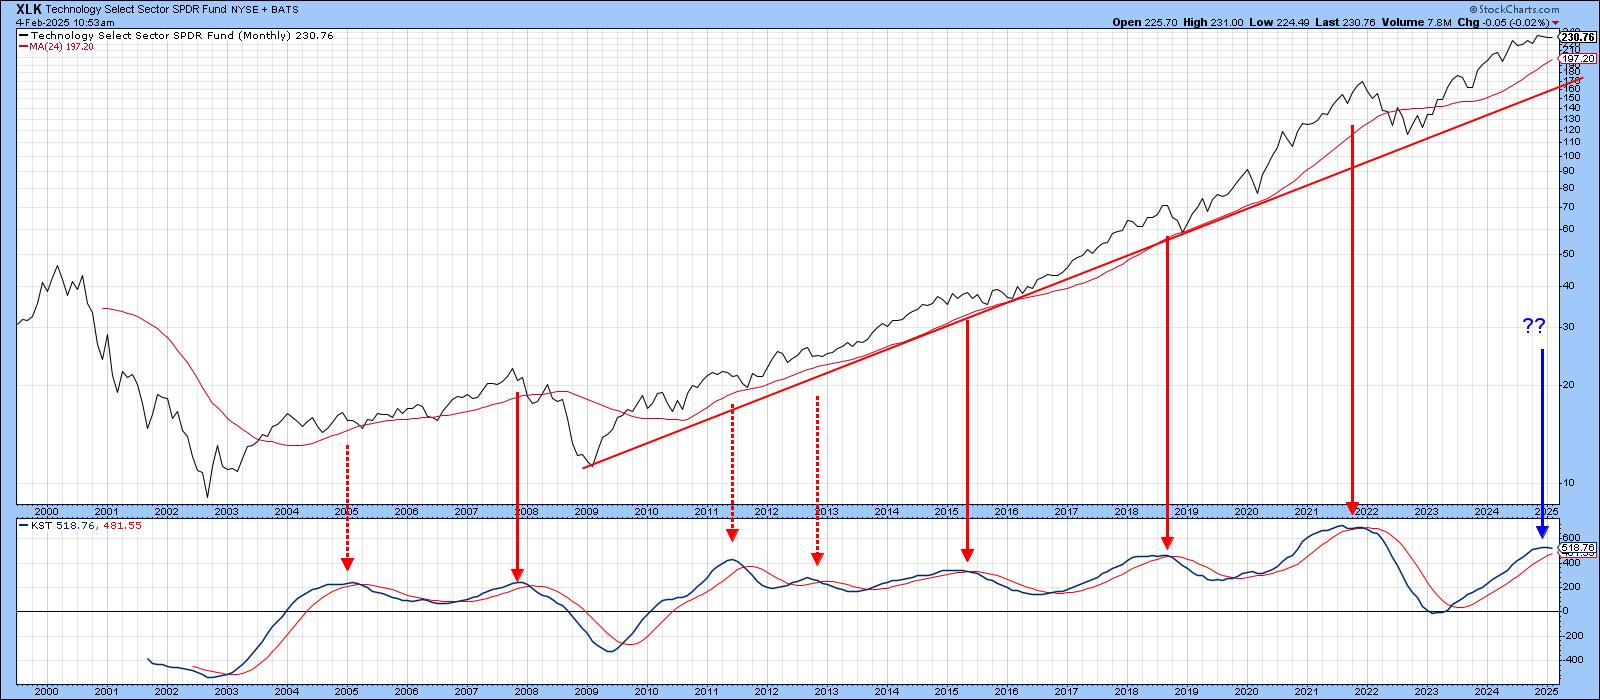
Technology stocks, in the form of the SPDR Technology ETF (XLK), have been on a tear since their secular low in 2009. That strength has not only resulted in higher absolute prices, but also striking relative action.
Chart 1 compares the XLK to its long-term KST. Reversals in this indicator...
READ MORE
MEMBERS ONLY
Some Silver Linings Following a Day of AI Panic
by Martin Pring,
President, Pring Research
I woke up this morning noting that NASDAQ futures had been down nearly 1,000 points at their overnight intraday low. Later, I tuned into a couple of general purpose, as opposed to financial, cable news channels. They, too, were talking about the sell-off and its rationale. I began to...
READ MORE
MEMBERS ONLY
Stocks are Facing an Important Test
by Martin Pring,
President, Pring Research
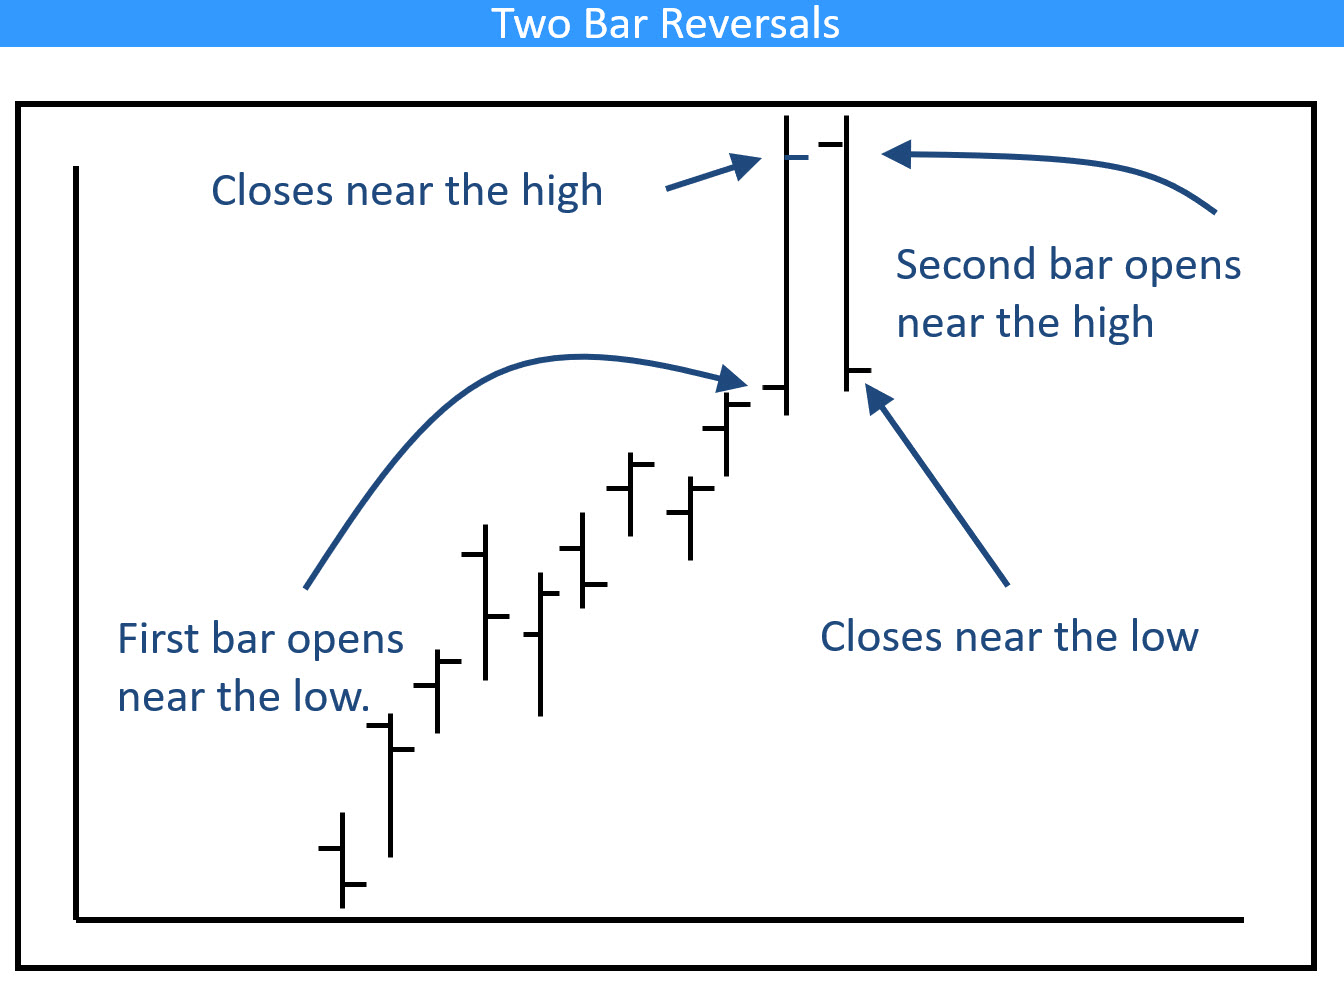
I have been expecting a bull market correction for about a month, but it's not been as deep as I expected. Now, however, several indexes have completed small bullish two-bar reversal patterns on the weekly charts. If they work, that would be a characteristic of a bull market,...
READ MORE
MEMBERS ONLY
One Small Push by Commodities Could Lead to a Giant Leap for Commoditykind
by Martin Pring,
President, Pring Research
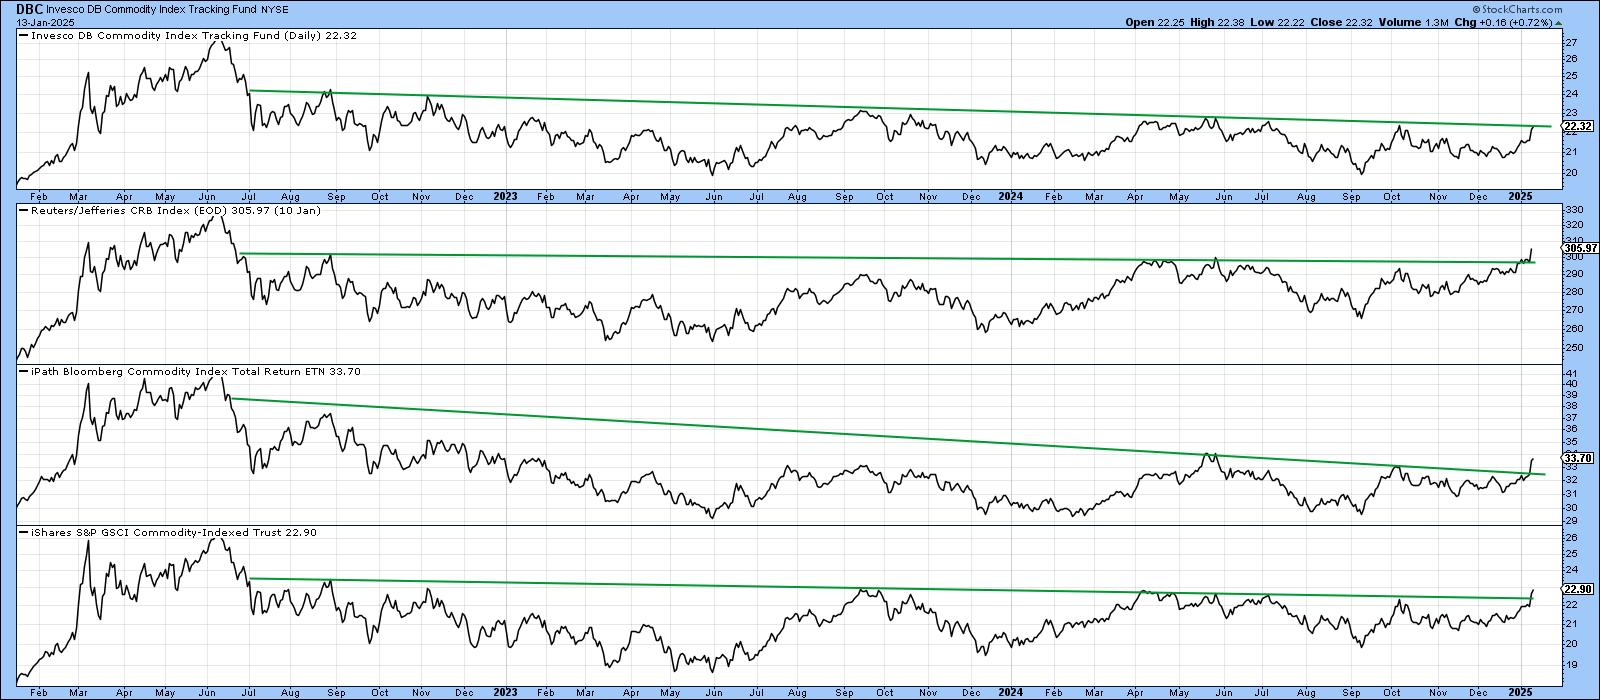
That may seem like a strange title, but it is intended to make the point that commodities look as though they are in the process of breaking out. Furthermore, this breakout, if successful, would jump-start a finely balanced long-term technical position into a primary bull market, all courtesy of our...
READ MORE
MEMBERS ONLY
Is The First Domino About to Fall for the Bitcoin Bull Market?
by Martin Pring,
President, Pring Research
The Long-Term Picture
No market goes up forever and, at some point, Bitcoin will top out. It's currently down about 12% from its peak, set on December 17 less than 4 weeks ago, so there is scant evidence at this point indicating a primary bear market. For example,...
READ MORE
MEMBERS ONLY
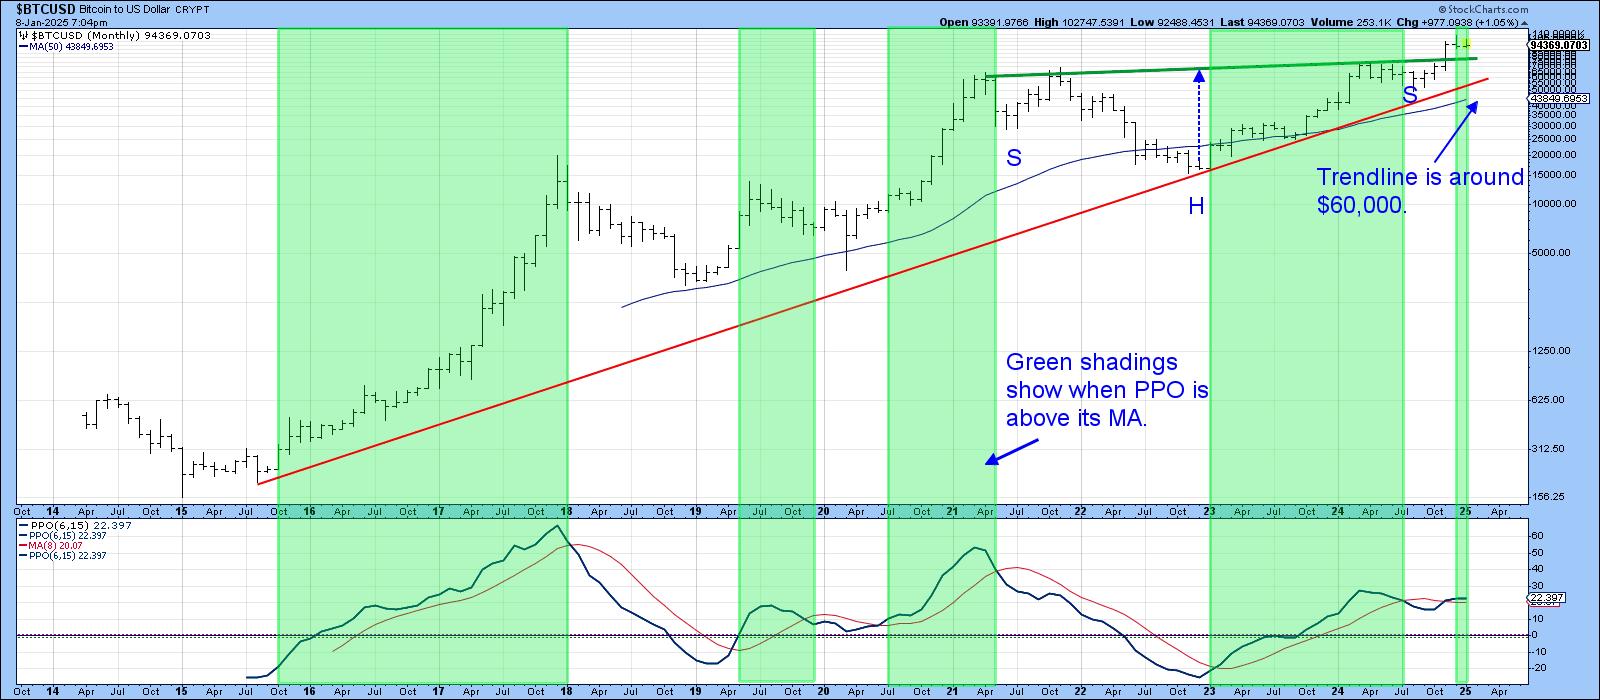
These Bars and Candles May Hold the Key for 2025
by Martin Pring,
President, Pring Research
Most of the time, when we study bars or candlesticks, our attention is focused on daily and intraday charts, since they give early warnings of a possible change in the short-term trend. Nonetheless, it occasionally makes sense to step back and take a look at monthly bars and candlesticks. Not...
READ MORE
MEMBERS ONLY
The Trump Trade? Not All as MAGA as You Might Think
by Martin Pring,
President, Pring Research
The "Trump Trade" refers to the market reaction and investment strategies that emerged following Donald Trump's election victories and his economic policies. It describes the shift in market sentiment driven by anticipated pro-business policies, tax cuts, and deregulation under his administration.
Investors initially rushed into sectors...
READ MORE
MEMBERS ONLY
Don't Be Surprised by an Early 2025 Pullback
by Martin Pring,
President, Pring Research
This year has been a very good one for stockholders. Come to think of it, 2023 wasn't so bad either. After an extended period of gains, it's natural for investors to become complacent, especially as they head home for the holidays.
This is the kind of...
READ MORE
MEMBERS ONLY
Several Intermarket Relationships Precariously Positioned for Stocks
by Martin Pring,
President, Pring Research
Chart 1 compares the S&P Composite with the NYSE A/D Line and its Common Stock counterpart. These, of course, are not intermarket relationships, but the chart does show that some near-term weakness would violate their bull market trendlines. Violating a trendline is not necessarily the end of...
READ MORE
MEMBERS ONLY
What the Economic Indicators are Saying About Stocks and Commodities
by Martin Pring,
President, Pring Research
You may not know it, but StockCharts' library of economic indicators has recently been enlarged. It's not as extensive as, say, the stock coverage, but it does include a lot of indicators that actually work, in the sense of helping identify major reversals in stock, bond, and...
READ MORE
MEMBERS ONLY
Three Charts That Could Be About to Break in a Big Way
by Martin Pring,
President, Pring Research
This article is not centered around a specific theme; rather, it focuses on some charts which look as if they are about to signal an important change in trend. In this case, "important" is defined as a forthcoming move lasting at least 3-months.
My indicator of choice for...
READ MORE
MEMBERS ONLY
These Country ETFs are Looking Particularly Vulnerable
by Martin Pring,
President, Pring Research
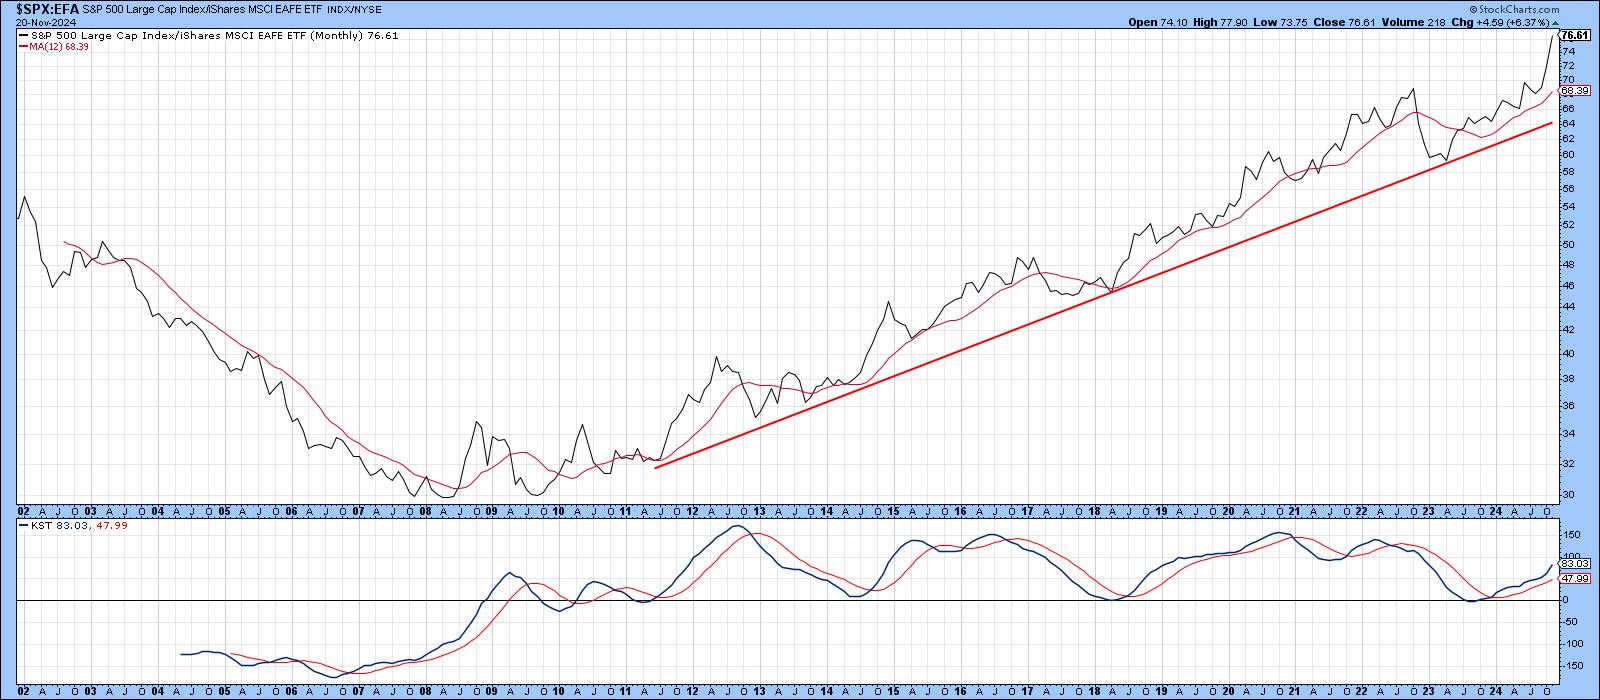
Chart 1, below, compares the S&P Composite to the Europe Australia Far East ETF (EFA), which is effectively the rest of the world. It shows that US equities have been on a tear against its rivals since the financial crisis. More to the point, there are very few...
READ MORE
MEMBERS ONLY
The Dollar's Technical Position is Crucial from a Short, Intermediate, Primary, and Secular Standpoint
by Martin Pring,
President, Pring Research
Chart 1 shows the Dollar Index has been in a trading range for the last couple of years and is now at resistance in the form of its upper part. The big question relates as to whether it can break to the upside, or if the resistance will once again...
READ MORE
MEMBERS ONLY
This Sector is Worth Watching, Not Just For Itself But as a Market Bellwether
by Martin Pring,
President, Pring Research
Last week, I drew your attention to the fact that out that three US market sectors had experienced bearish two-bar reversals on the weekly charts and were likely to retrace some of their previous advances. I also pointed out that this was only one piece of negative evidence and that...
READ MORE
MEMBERS ONLY
Four Sectors That Have Just Experienced Bearish Weekly Action
by Martin Pring,
President, Pring Research
Most weekends, I flip through a chartlist featuring weekly bars and candles for sectors, country ETFs, currencies, bonds and some commodities. The idea is to see whether any of these entities are showing signs of bullish or bearish reversals. Most of the time, this fishing exercise does not uncover a...
READ MORE
MEMBERS ONLY
This Stock Market Will Likely Outperform the World Index, But Could Be Outshone by Something Completely Different
by Martin Pring,
President, Pring Research
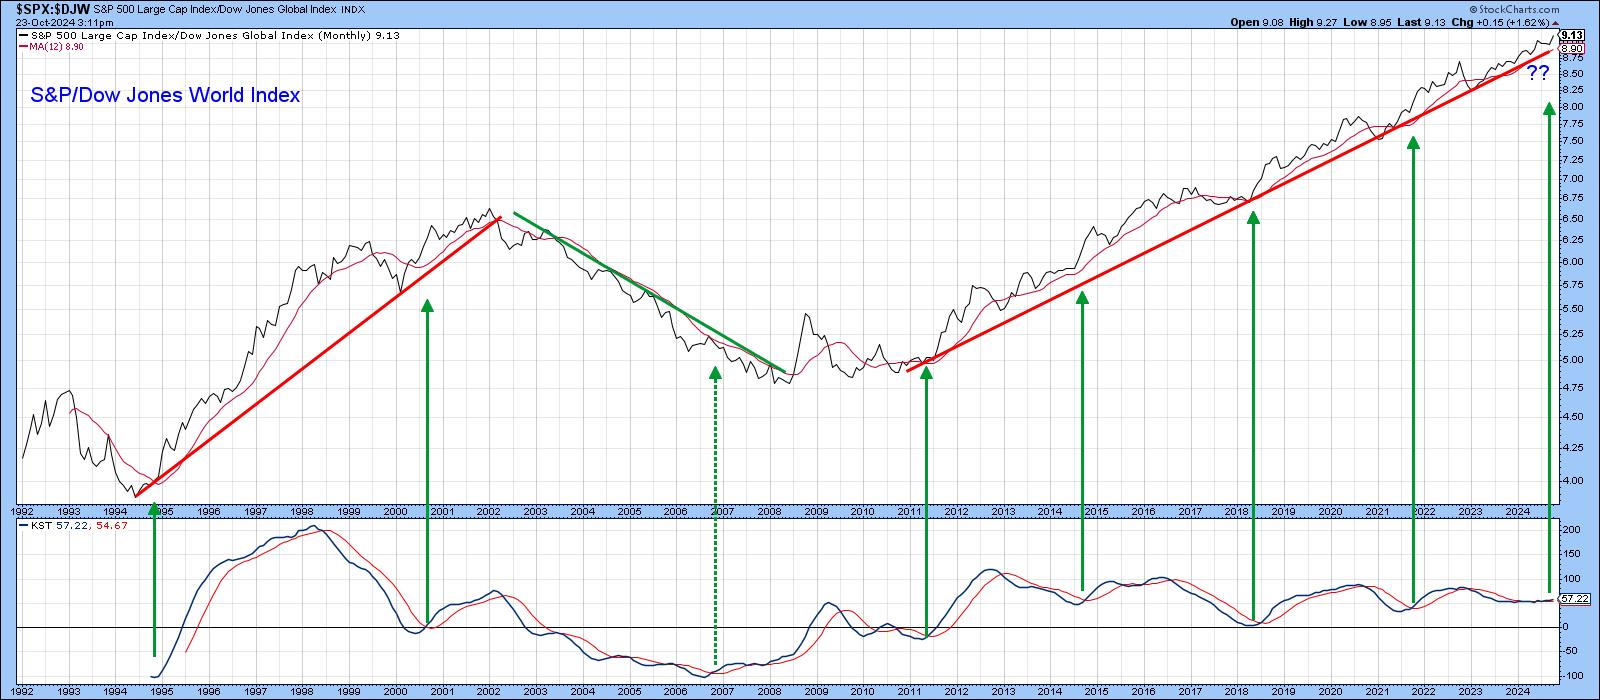
Since 2011, the US stock market, represented by the S&P Composite, has outperformed the world. In the last couple of weeks or so, it has managed to break out from a trading range in its relationship with the rest of the world and looks headed even higher on...
READ MORE
MEMBERS ONLY
The Next Big Move in Yields May Be Different Than You Think
by Martin Pring,
President, Pring Research
Below, Chart 1 shows a weekly plot for the 30-year yield, where we can see a perfectly formed top whose completion was followed by a negative 65-week EMA crossover. At the time of the breakdown, there were few grounds for suspecting a false break. However, in the last couple of...
READ MORE