MEMBERS ONLY
Did We Just See a False Breakdown in Crude Oil?
by Martin Pring,
President, Pring Research
Using West Texas Crude, Chart 1 features one of my favorite techniques for identifying changes in long-term trends, which is simply a PPO using the 6- and 15-month parameters. When it is above zero, it's bullish, and when below, bearish. The pink shading indicates bearish periods, and the...
READ MORE
MEMBERS ONLY
China Stocks May Be On to Something
by Martin Pring,
President, Pring Research
China's stock market exploded last week in an amazing rally, so formidable that it raises the question of whether it could be the start of a new bull market, or just a short-covering rally which will quickly fizzle out. In that respect, it's important to note...
READ MORE
MEMBERS ONLY
The Dollar Index is Down, But Is It Out?
by Martin Pring,
President, Pring Research
The Dollar Index has been selling off sharply in the last few weeks and has now reached critical support in the form of the lower part of its recent trading range. The big question is whether it will break below the range or extend it in any way.
Chart 1...
READ MORE
MEMBERS ONLY
Four Intermarket Confidence Relationships that Aren't Confident
by Martin Pring,
President, Pring Research
Most of the primary trend indicators I follow are in a bullish mode and show few signs of flagging. That said, some intermarket relationships, which help to indicate whether the environment is risk-off or risk-on, have started to move in a risk-off direction. That's usually a bearish omen...
READ MORE
MEMBERS ONLY
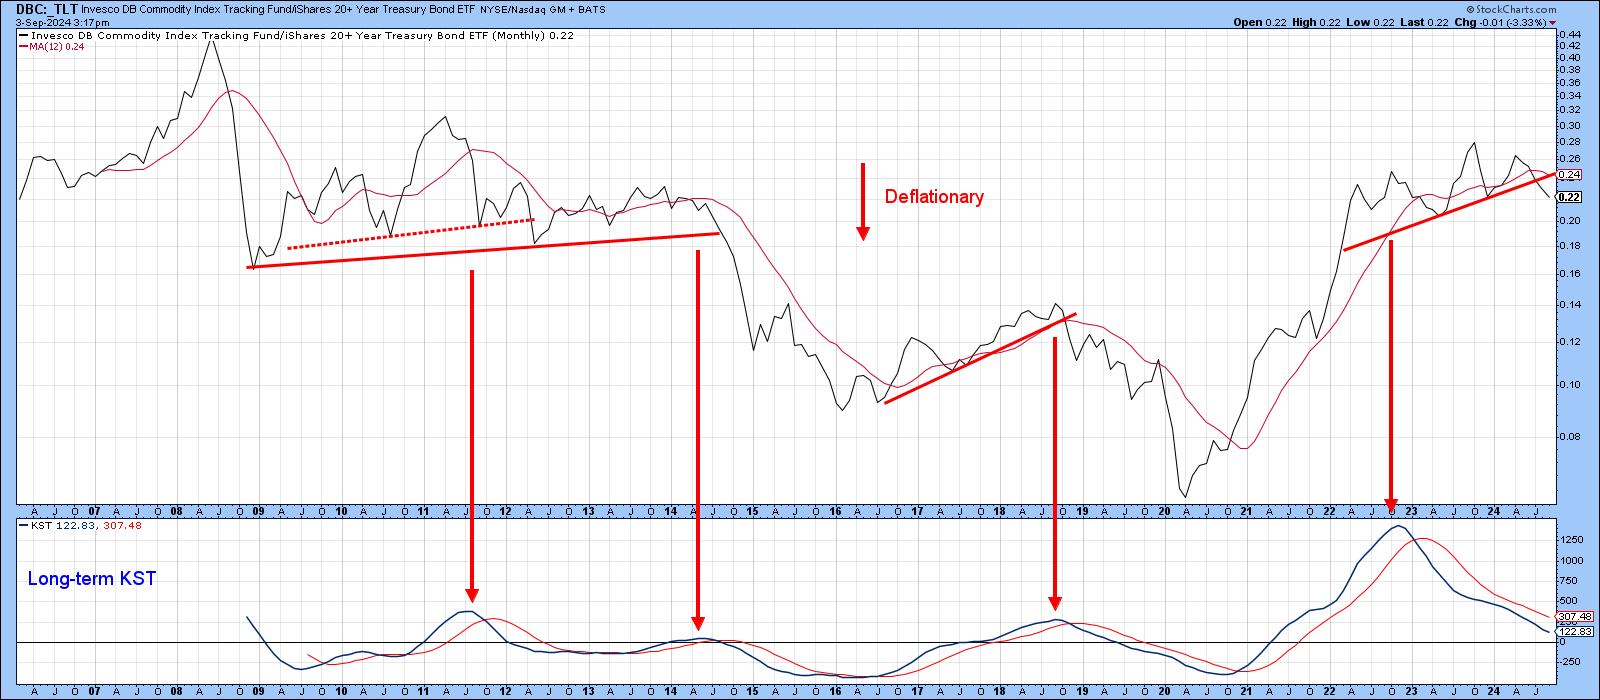
Is It Inflation or Deflation? What's in Your Wallet?
by Martin Pring,
President, Pring Research
Every business cycle has an inflationary and deflationary part, and it's very important for both traders and investors at least to try to have some understanding which has the upper hand at any particular point in time.
For example, when the economy is in a slowdown or recessionary...
READ MORE
MEMBERS ONLY
Is the Multi-Month Dollar Index Trading Range About to be Resolved?
by Martin Pring,
President, Pring Research
Last June, I wrote an articlewhose title was more or less the same as this one. At the time, the Index was bumping up against the top of a major trading range, and it looked very much as if it was about to experience an upside breakout. My conclusion was...
READ MORE
MEMBERS ONLY
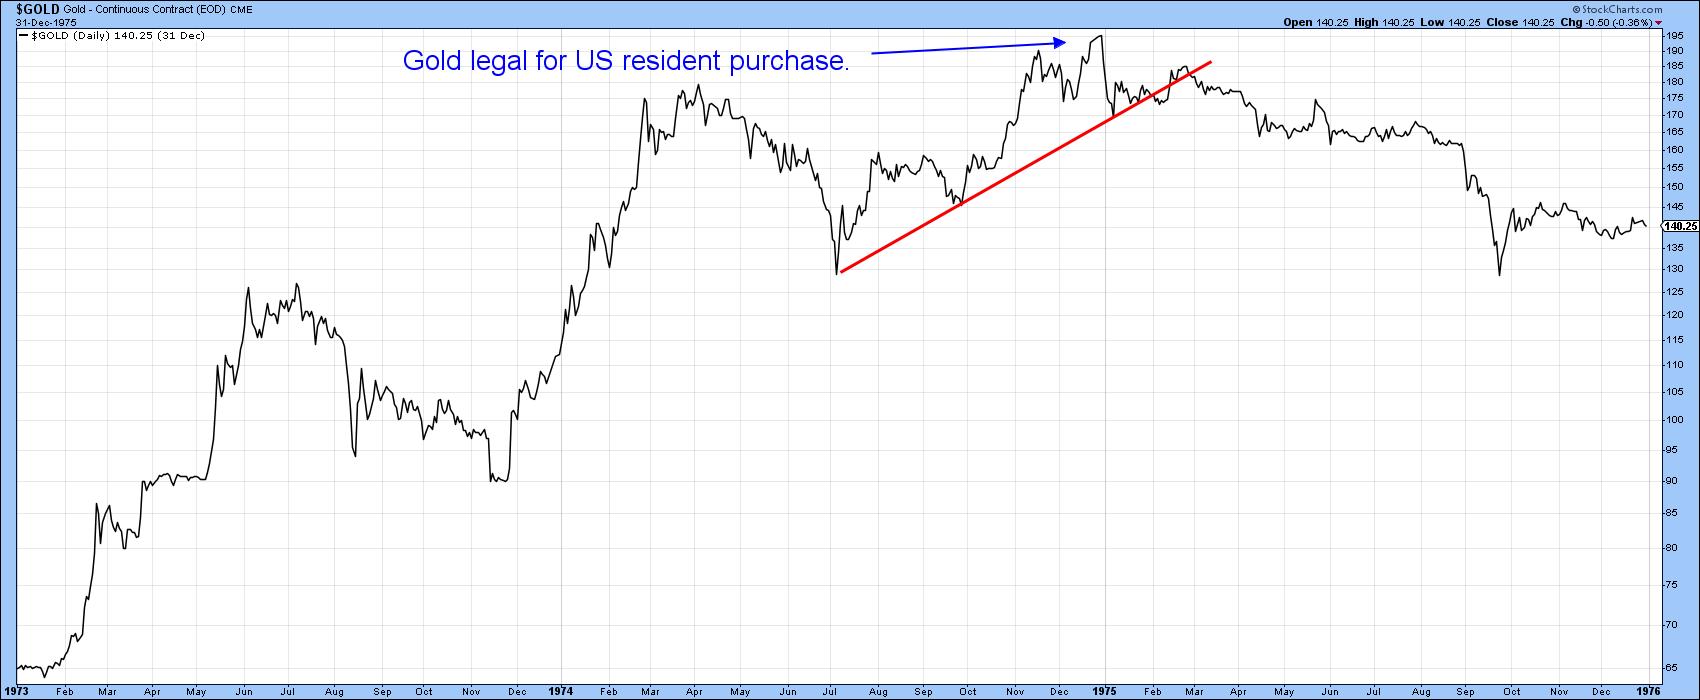
This Market is On Track for a 45-Year Breakout
by Martin Pring,
President, Pring Research
It's not very often that any market experiences a 10-year breakout, let alone a 45-year one. That, however, is what Chart 1 says is about to materialize for the inflation-adjusted gold price.
Since the chart is based on monthly data, we will not know for sure until the...
READ MORE
MEMBERS ONLY
VIX Indicates Fear, But Is It Enough?
by Martin Pring,
President, Pring Research
Last Monday, markets around the world experienced a sharp drop as the unwinding of yen carry trades followed the previous Friday's response to a weak employment report. The speed and sharpness of the equity sell-off got the attention of the general-purpose media and just about everyone else.
From...
READ MORE
MEMBERS ONLY
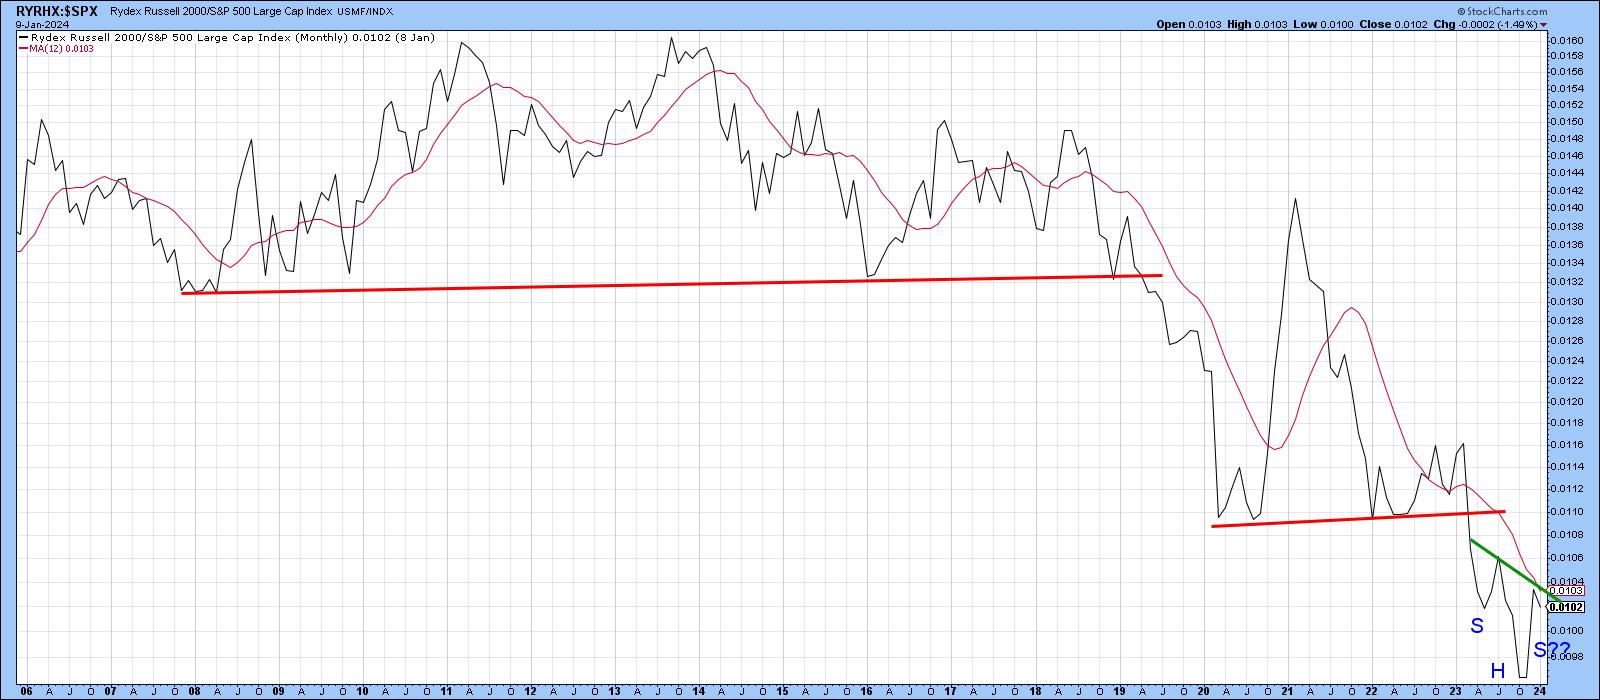
The Great Rotation: Not What You Think
by Martin Pring,
President, Pring Research
KEY TAKEAWAYS
* Small-cap stocks look like they have lost momentum.
* Market breadth in small-cap stocks appears to be weakening.
* The Utilities sector seems to be gaining momentum.
Just so we are on the same page, I looked up "Great Rotation" on Microsoft's Copilot and came away...
READ MORE
MEMBERS ONLY
Is the Bond Market About To Make a Big Move?
by Martin Pring,
President, Pring Research
The bond market experienced a secular bear between 1981 and the spring of 2020. Chart 1 offers three reasons why it has since reversed and given way to a secular uptrend or possibly multi-year trading range.
The first piece of evidence comes from violating the multi-decade trendline. Second, the price...
READ MORE
MEMBERS ONLY
Time for a Pause That Refreshes Stocks and Gold?
by Martin Pring,
President, Pring Research
Most weekends, I run through a chart list featuring weekly bars and candlesticks of bonds, stocks and commodities to see if any one or two bar patterns or candlestick formations have developed. Last week produced a crop of bearish messages from the major averages and some sectors. Before you rush...
READ MORE
MEMBERS ONLY
These Two Sectors are Showing Promising Silver Cross Setups
by Martin Pring,
President, Pring Research
A silver cross occurs when a 20-day MA crosses above its 50-day counterpart. While far from perfect, such signals enable you to ride a persistent trend. However, like all trend following techniques, problems can occur in a trading range environment.
Chart 1 features two recent buy signals for the S&...
READ MORE
MEMBERS ONLY
They Say Three Steps and Stumble; This Market is Taking a Fourth
by Martin Pring,
President, Pring Research
The legendary technician Edson Gould had a rule that, after three discount rate hikes, the stock market would be likely to stumble. That doesn't apply to emerging markets, but it did make a catchy headline. What is relevant to the iShares MSCI Emerging Market ETF (EEM) is that,...
READ MORE
MEMBERS ONLY
Has Housing Topped Out for the Cycle?
by Martin Pring,
President, Pring Research
Residential housing is not important for its size relative to GDP, which, according to Copilot, is about 3-5%. Rather, due to its interest rate sensitivity, housing is significant because it is the first sector of the economy to turn at the end of a recession, and the first to turn...
READ MORE
MEMBERS ONLY
Dow Transports Are Set for a Short-Term Rally, But Will It Be Enough?
by Martin Pring,
President, Pring Research
The Transportation Sector has been one of the weaker brethren of late. That's important, as this market average forms part of the Dow Theory, which many observers believe is currently signaling a bear market. However, back in January, I wrote a piece on the Dow Theorythat came to...
READ MORE
MEMBERS ONLY
Is the Eighteen-Month Dollar Index Trading Range About to be Resolved?
by Martin Pring,
President, Pring Research
Chart 1 shows that the Dollar Index has been in a trading range since the start of 2023. Its sheer size indicates the ultimate breakout could be followed by a sizeable move in either direction. It is also likely to have important implications for many different markets and asset classes....
READ MORE
MEMBERS ONLY
The Next Direction for Interest Rates Is...?
by Martin Pring,
President, Pring Research
In most cycles, central banks around the world raise and lower short-term interest rates in a rough synchronization. Last week, the European and Canadian central banks began lowering their rates, and the British are expected to follow suit this week. Most observers of the US expect the Federal Reserve to...
READ MORE
MEMBERS ONLY
It's Time to Take a Look at the Canadian and Australian Dollars and What They Imply for Inflation
by Martin Pring,
President, Pring Research
The Canadian and Aussie dollars have been confined between two converging trendlines since the beginning of the century, as we can see from Chart 1. The moment of truth appears to be close at hand, as both are approaching the apex of a giant potential symmetrical triangle.
One usually consistent...
READ MORE
MEMBERS ONLY
What Does Today's Outside Bars in the S&P and NASDAQ Mean Going Forward
by Martin Pring,
President, Pring Research
A couple of weeks ago, I wrote an upbeat article on the US stock market opining that the correction was over. I still think that's the case, but I do have to note that a bearish outside bar formed on both the S&P and NASDAQ on...
READ MORE
MEMBERS ONLY
These Commodities are On Track for Mega Breakouts in May
by Martin Pring,
President, Pring Research
It's rare when you see a multi-year breakout take place, but, when several materialize more or less at the same time, that should really get our attention. That's not simply because of the opportunities being presented, but also because several simultaneous breakouts indicate a broader participation...
READ MORE
MEMBERS ONLY
Four Reasons Why Emerging Markets are Headed Higher
by Martin Pring,
President, Pring Research
Last February, I wrote an article on emerging markets, using the iShares MSCI Emerging Markets ETF (EEM) as my benchmark. I pointed out that this sector was close, but had not quite broken out to the upside. Now it has, and the outlook is favorable for at least a 4-6-month...
READ MORE
MEMBERS ONLY
NYSE and Global A/D Lines Trade at New All-Time Highs
by Martin Pring,
President, Pring Research
The magnitude and duration of corrections are largely determined by the direction of the prevailing primary trend. If it's bearish, they tend to be more severe and last longer. In a bull market, it's just the opposite, as they are generally short and sweet, if you...
READ MORE
MEMBERS ONLY
Time for a Pause in the Ongoing Dollar Bull Market? Or Full Steam Ahead?
by Martin Pring,
President, Pring Research
I last wrote about the dollar in December, where I came to the conclusion that a limited rally was a likely possibility in what was assumed to be a primary bull market. I am still of the view that the bull market is alive and well, but it's...
READ MORE
MEMBERS ONLY
Are We There Yet?
by Martin Pring,
President, Pring Research
Back in early February, I wrote an article entitled "Only a Fool Would Try to Call a Correction in a Bull Market, So Here Goes". In it, I was trying to point out that counter-cyclical corrections are notably difficult to identify, as they often terminate just at the...
READ MORE
MEMBERS ONLY
Precious Metals Reach Exhaustion
by Martin Pring,
President, Pring Research
In the last couple of weeks, I have been reading stories about shoppers picking up gold bars in, of all places, Costco. According to Gemini, the AI branch of Google, "Reports indicate they may be selling up to $200 million worth of gold bars every month."
Normally, thin...
READ MORE
MEMBERS ONLY
The Day the Yields Broke Out
by Martin Pring,
President, Pring Research
Wednesday brought an unexpected firming up of the inflation figures, causing analysts and commentators to trim the number of times they expect interest rates to be cut this year. Whenever it is that the questions turn away from whether to when and by how much, as was the case until...
READ MORE
MEMBERS ONLY
This Sector is Breaking Up and Down Simultaneously
by Martin Pring,
President, Pring Research
This may seem like a contradiction, but it is possible for two different things to be true at the same time.
What I am referring to is the fact that the health care sector (XLV) recently broke out from a consolidation reverse head-and-shoulders pattern, as we can see from the...
READ MORE
MEMBERS ONLY
DJT Has Closed Last Week's Gap, But is It Enough?
by Martin Pring,
President, Pring Research
Sometimes, simple indicators like bar or candlesticks operate just as the textbooks tell us they should. I don't normally follow individual stocks, but the hype surrounding last week's listing of Trump Media piqued my interest to see if the technical position squared with what the many...
READ MORE
MEMBERS ONLY
Don't Bet on Lower Rates
by Martin Pring,
President, Pring Research
To paraphrase the late great contrarian Humphrey Neil: When everyone thinks alike, it's usually time to look for a turn in the market.
It seems to me, after reviewing an unscientific survey of the financial media, that everyone and his dog (no disrespect to our canine friends) is...
READ MORE
MEMBERS ONLY
Is China a Basket Case or a Screaming Buy?
by Martin Pring,
President, Pring Research
By now it's common knowledge that the Chinese property sector is in crisis, foreign investment has slowed, and youth unemployment is at record levels. Should be time to sell Chinese equities, right? After all, we don't know when the other shoe is going to drop. They...
READ MORE
MEMBERS ONLY
The Business Cycle is Edging its Way to a More Inflationary Stage
by Martin Pring,
President, Pring Research
Last week, I pointed out the inflationary consequences of the recent gold breakout, as gold market participants initially expect prices to firm up in the commodity pits and later the CPI itself. This week, we will take those thoughts a step further by relating swings in industrial commodity prices to...
READ MORE
MEMBERS ONLY
Everyone Has a Plan Until They Get Punched in the Face. Did Jerome Powell Just Get Punched in the Face?
by Martin Pring,
President, Pring Research
The title of this article may be exaggerated, but, last Friday, the probabilities for an upward reversal in the rate of inflation later this year went substantially higher. That's because the gold price, an inflationary bellwether, broke out from a 4-year trading range to a new all-time high....
READ MORE
MEMBERS ONLY
Three Intermarket Relationships That Say This Bull Market is Going Higher
by Martin Pring,
President, Pring Research
Absorbing the information gleaned from monthly charts for various asset classes or sectors can help gain some perspective. However, I find that an examination of the relationships between them can be equally rewarding, if not moreso. That's because they point out the nature of the current investment environment,...
READ MORE
MEMBERS ONLY
Emerging Markets Getting Closer to a Breakout
by Martin Pring,
President, Pring Research
Last November I asked the question "Are emerging markets about to emerge?"Using the iShares MSCI Emerging Markets ETF (EEM) as our benchmark, I concluded that more strength was needed in order to push the indicators into a bullish mode. In the intervening period, things have improved, but...
READ MORE
MEMBERS ONLY
Gold is at the Crossroad
by Martin Pring,
President, Pring Research
Last November and December, it looked as if gold had broken out from a multi-year inverse head-and-shoulders. Since then, the price has dropped below the breakout area, and the long-term KST has begun to roll over.
Just like takeoff and landing are the critical points for an aircraft, breakouts are...
READ MORE
MEMBERS ONLY
Only a Fool Would Try to Call a Correction in a Bull Market, So Here Goes!
by Martin Pring,
President, Pring Research
The vast majority of the primary trend indicators are pointing to a bull market and have been doing so for the better part of a year. Chart 1, for instance, shows that NYSE Margin Debt, or rather its long-term KST, has only recently gone bullish. The vertical lines point out...
READ MORE
MEMBERS ONLY
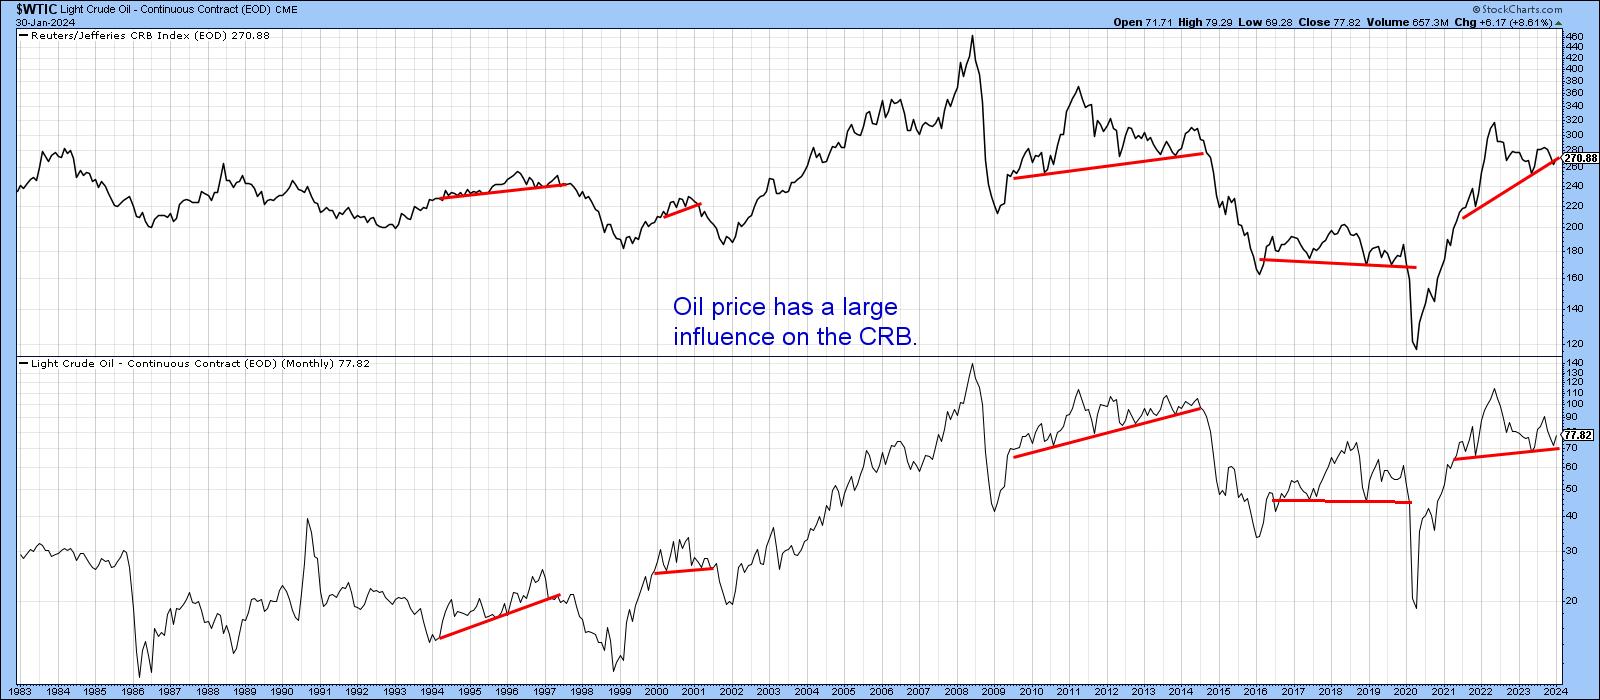
Is Oil Going Up or Down?
by Martin Pring,
President, Pring Research
Oil is not only an important commodity in and of itself, but is also one has a substantial influence on commodity indexes in general. Its weight in the CRB Composite is 23%; for energy in total, it is 39%. Chart 1 compares the oil price to the CRB Composite, where...
READ MORE
MEMBERS ONLY
What Does Dow Theory Say About This Market?
by Martin Pring,
President, Pring Research
Some tools in technical analysis are totally objective, such as a moving average crossover. It may be debatable whether it's a decisive signal or not, but a crossover is nevertheless a crossover. Dow Theory, on the other hand, is much more subjective and, therefore, open to interpretation. For...
READ MORE
MEMBERS ONLY
Buying Bitcoin ETFs is the Easy Part, But What Comes Next?
by Martin Pring,
President, Pring Research
Last week, eight new Bitcoin-based ETFs began trading courtesy of recent SEC approval. This launch was well anticipated, as the price had already run up in the hope that these new buyers would push it to an even higher level. The thought occurred to me that the situation is not...
READ MORE
MEMBERS ONLY
Is it Prime Time for Small Caps?
by Martin Pring,
President, Pring Research
A couple of weeks ago, I took note of the widespread interest in small caps amongst the technical community. I don't normally follow cap plays, but my contrary bones began to shake when I saw such acclaim at their recent performance following several false dawns in the last...
READ MORE