MEMBERS ONLY
Three Intermarket Relationships That are at a Critical Point
by Martin Pring,
President, Pring Research
When reviewing my charts last weekend, several jumped out as being at a pretty critical juncture, and therefore worthy of monitoring going forward. A couple of them involved the stock market, so I'll start there.
Two Stock Market Relationships
I have always been fascinated by the relationship between...
READ MORE
MEMBERS ONLY
What Does a Flattening Yield Curve Mean for Bonds, the Economy and Stocks
by Martin Pring,
President, Pring Research
In the last couple of weeks or so, US treasury yield curves have begun to flatten. That may sound unduly technical and boring, but it has implications for bonds stocks and the economy. I'll get to the investment implications later, but for now I'll quickly through...
READ MORE
MEMBERS ONLY
NASDAQ and S&P at a New High, But It's Very Lonely Up There
by Martin Pring,
President, Pring Research
This week saw the NASDAQ and S&P Composites rally to a new high, but not the DJIA, NYSE Composite, Unweighted S&P and Russell 2000. That's not necessarily the kiss of death, as these discrepancies can always be cleared up over time. In any case,...
READ MORE
MEMBERS ONLY
Can Positive Short & Intermediate Indicators for the Dollar Tip Long-Term Balance to the Bullish Side?
by Martin Pring,
President, Pring Research
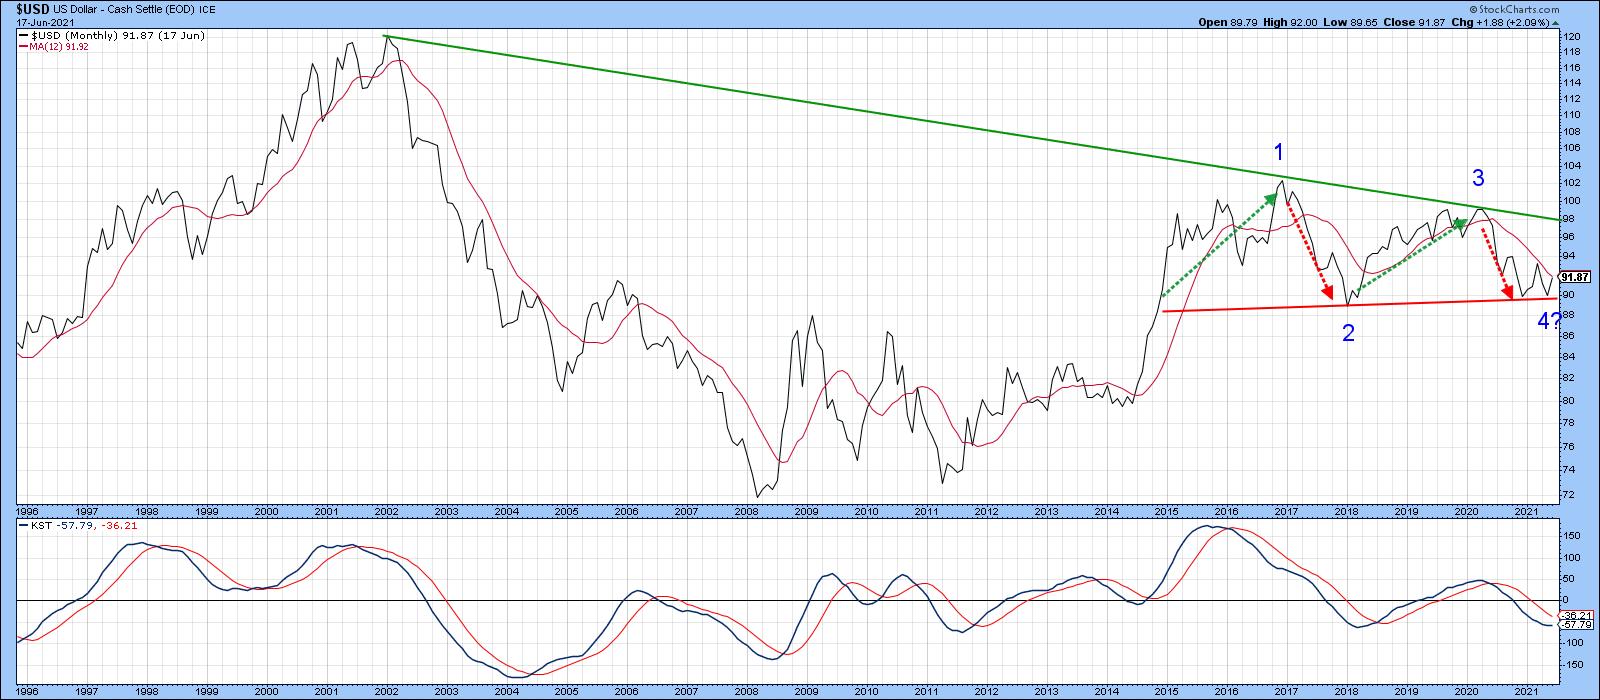
Chart 1 shows that, since 2015, the Dollar Index has been in a narrowing trading range bounded by two converging trendlines. That period has also embraced the end part of the 2011-2016 bull market, a mini-bear and bull market and the current bear. I use the term "...
READ MORE
MEMBERS ONLY
Can Positive Short & Intermediate Indicators for the Dollar Tip Long-Term Balance to the Bullish Side?
by Martin Pring,
President, Pring Research
Chart 1 shows that, since 2015, the Dollar Index has been in a narrowing trading range bounded by two converging trendlines. That period has also embraced the end part of the 2011-2016 bull market, a mini bear and bull market and the current bear. I use the term "...
READ MORE
MEMBERS ONLY
Oil May Be on the Verge of a Major Breakout
by Martin Pring,
President, Pring Research
Last week, I featured three energy-related ETFs as part of an article on the bond market, as they had just broken out on a short-term basis. Chart 1 shows that those breakouts have held so far. This week, though, I'd like to take a deeper dive...
READ MORE
MEMBERS ONLY
Bonds at the Crossroad as Energy Breaks to the Upside
by Martin Pring,
President, Pring Research
The Dilemma Between the Long and Short-Ends
Last March, I wrote an articleopining that, while the primary trend was positive, the idea of rising bond yields may have been become too popular for the time being. In the intervening 2 ½-months, yields at the long end have backed off...
READ MORE
MEMBERS ONLY
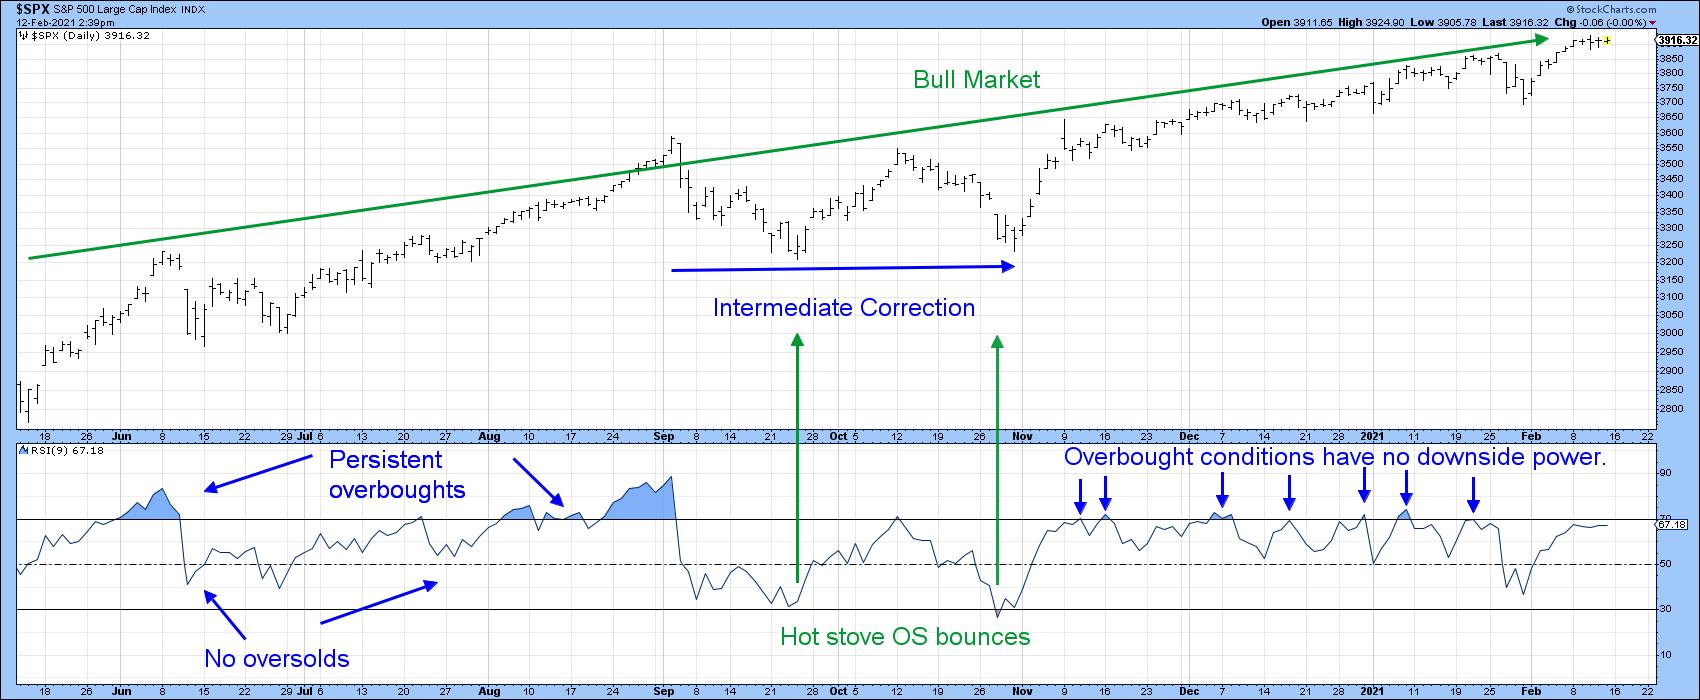
I Don't Know If the Correction Will Extend, But Here are Five Charts I'm Watching
by Martin Pring,
President, Pring Research
The Big Picture
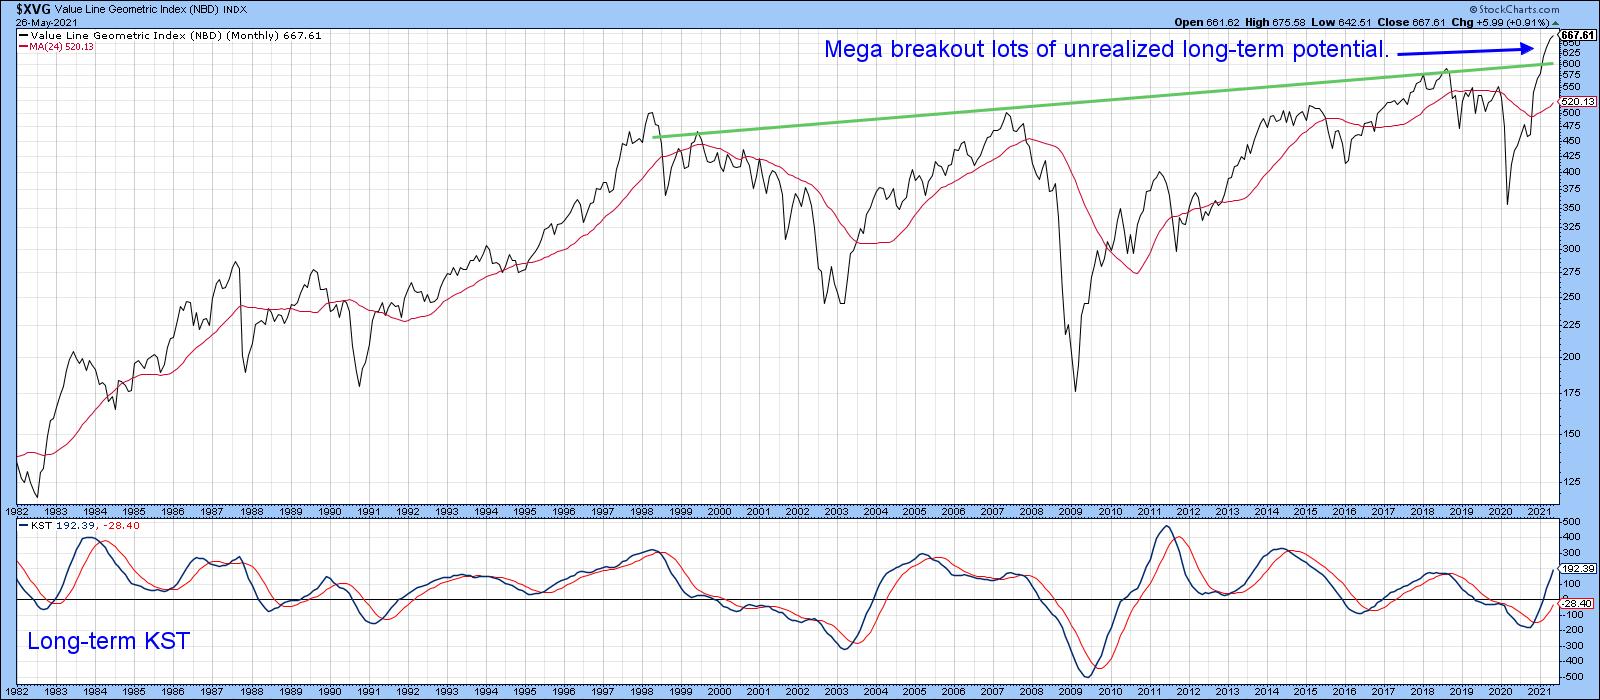
Before we get into the subject of corrections, it's important to make sure that we do not lose focus on the big picture. For instance, take Chart 1, which features the Value Line Geometric Average. It reflects the performance of the average stock, as opposed...
READ MORE
MEMBERS ONLY
I Don't Know If the Correction Will Extend, But Here are Five Charts I'm Watching
by Martin Pring,
President, Pring Research
The Big Picture
Before we get into the subject of corrections, it's important to make sure that we do not lose focus on the big picture. For instance, take Chart 1, which features the Value Line Geometric Average. It reflects the performance of the average stock, as opposed...
READ MORE
MEMBERS ONLY
Gold Starting to Look Interesting Again
by Martin Pring,
President, Pring Research
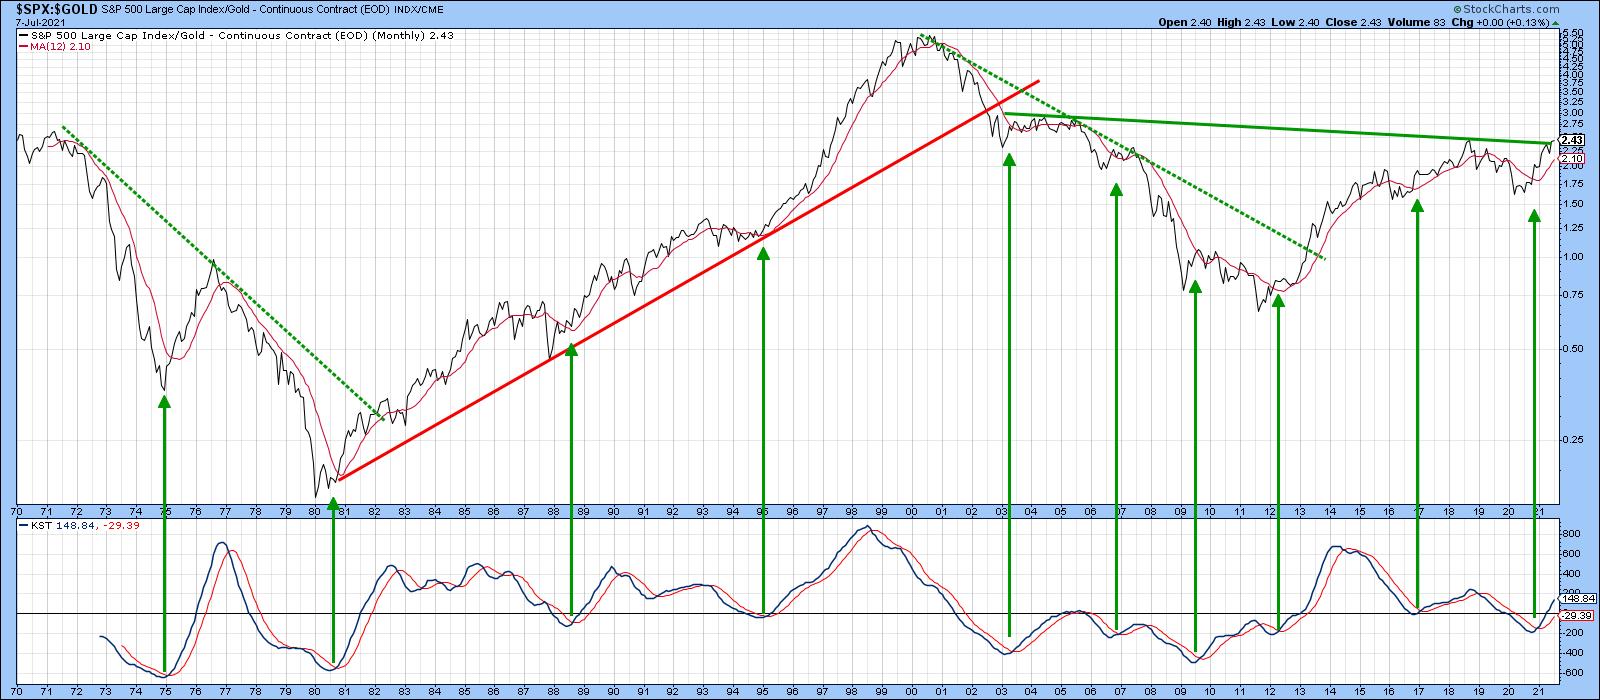
Gold has rallied nicely in the last few weeks, so the question naturally arises as to whether it's ready to resume its secular bull market. I'll get to that later, but first, a little perspective.
Longer-Term Perspective
Chart 1 plots the real price as adjusted...
READ MORE
MEMBERS ONLY
Monday's Falling Dominos May Be Enough to Tip the Short-term Trend to the Downside
by Martin Pring,
President, Pring Research
Many internal short-term indicators are overextended and starting to look vulnerable, but need some kind of a push to tip the near-term technical balance to the bearish side. That push may have been delivered with Monday's action, as several indexes gave the appearance of some selected...
READ MORE
MEMBERS ONLY
Putting Forward a Candidate to Take Over Tech Leadership
by Martin Pring,
President, Pring Research
A couple of weeks ago, I posted an articlequestioning whether the tech-dominated NASDAQ still had the mojo to lead the market higher. At the time, many sub-surface indicators, such as breadth, volume and relative action, looked weak. Several charts indicated that many of them had experienced multiple negative...
READ MORE
MEMBERS ONLY
Putting Forward a Candidate to Take Over from Tech Leadership
by Martin Pring,
President, Pring Research
A couple of weeks ago, I posted an article questioning whether the tech-dominated NASDAQ still had the mojo to lead the market higher. At the time, many sub-surface indicators, such as breadth, volume and relative action, looked weak. Several charts indicated that many of them had experienced multiple...
READ MORE
MEMBERS ONLY
Commodities are Breaking Out All Over
by Martin Pring,
President, Pring Research
The Fed has pumped a lot of money into the system -- and that liquidity has to go somewhere. We know a lot of it has already been flowing into stocks. Now it looks like it's time for commodities to participate. So much money, combined with bottlenecks in the...
READ MORE
MEMBERS ONLY
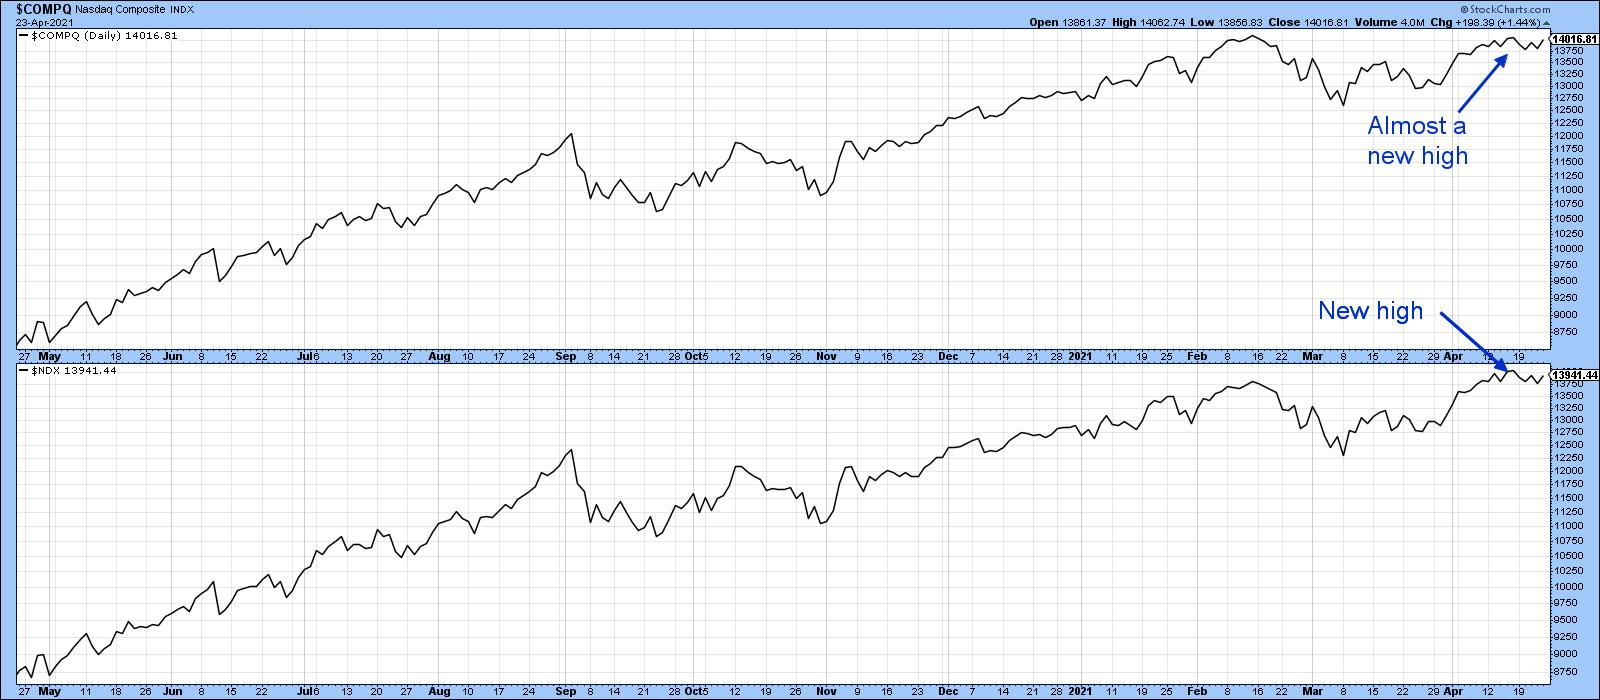
Has the NASDAQ Lost its Mojo?
by Martin Pring,
President, Pring Research
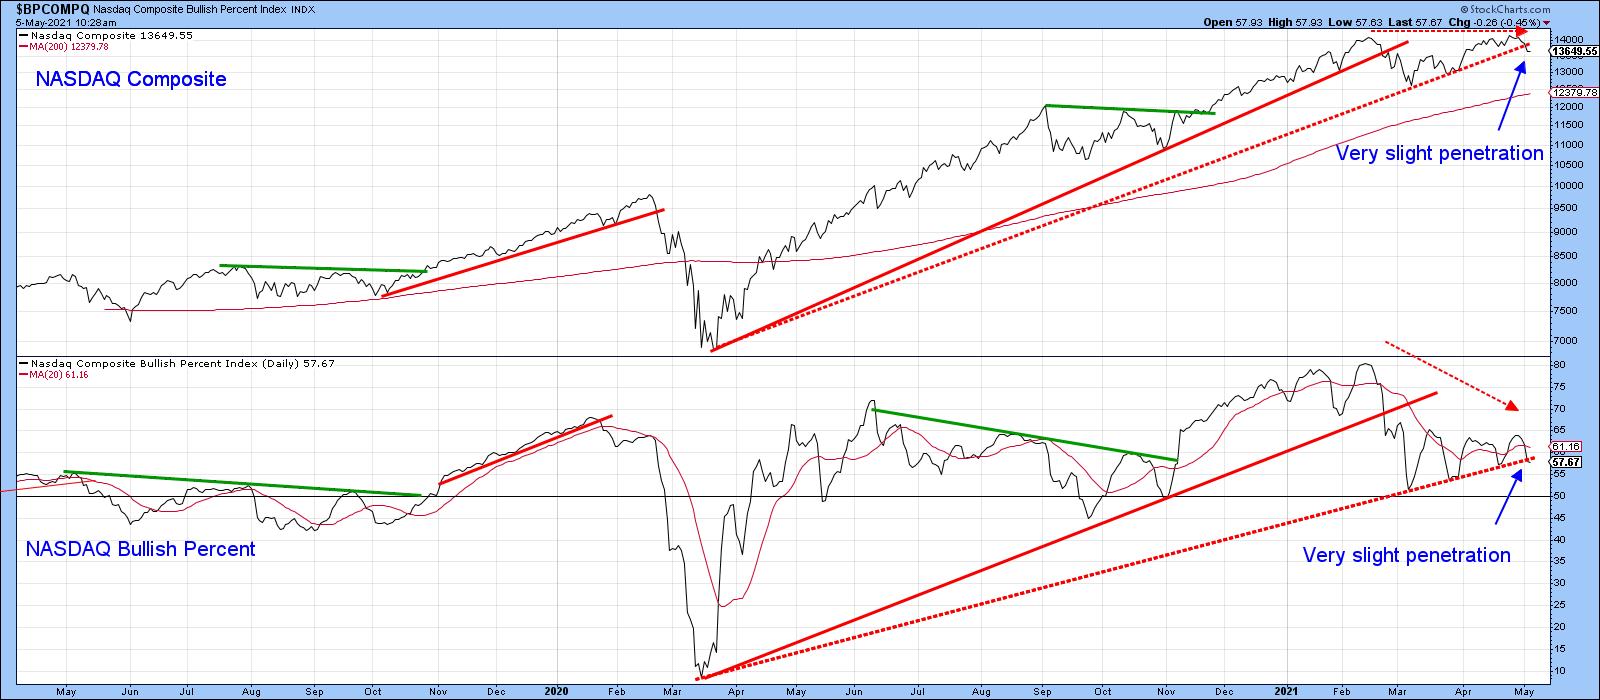
The NASDAQ Composite peaked on February 16, sold off and subsequently rallied back to the February high last week. Chart 1 shows that it just missed the earlier peak by a smidgen, whereas the NASDAQ 100 (in the lower window) did marginally take out its February high. Taken together, the...
READ MORE
MEMBERS ONLY
Has the NASDAQ Lost its Mojo?
by Martin Pring,
President, Pring Research
The NASDAQ Composite peaked on February 16, sold off and subsequently rallied back to the February high last week. Chart 1 shows that it just missed the earlier peak by a smidgen, whereas the NASDAQ 100 (in the lower window) did marginally take out its February high. Taken together, the...
READ MORE
MEMBERS ONLY
Dollar Hits a Crucial Fork in the Road
by Martin Pring,
President, Pring Research
The Dollar Index has been rangebound since 2015. During that period, it has experienced two mini bull and bear markets, as flagged by the dashed arrows in Chart 1. The latest bear has been in force for just over a year, as signaled by the Index trading below its 12-...
READ MORE
MEMBERS ONLY
Is it Time to Buy Gold?
by Martin Pring,
President, Pring Research
The gold price peaked last August and has been zig-zagging down ever since. The approximate loss from the high has so far been just north of 15%. During that period, sentiment numbers have been slowly eroding, but not to bearish extremes, so is now a good time to buy?...
READ MORE
MEMBERS ONLY
Trolling the StockCharts Economic Database for Useful Stock Market Indicators
by Martin Pring,
President, Pring Research
Many of you may be unaware of the fact that StockCharts has a small database of economic indicators. (You can find them by searching for symbols that begin with $$.) This week, I ran through a number of series to see if any could be useful from a long-term stock...
READ MORE
MEMBERS ONLY
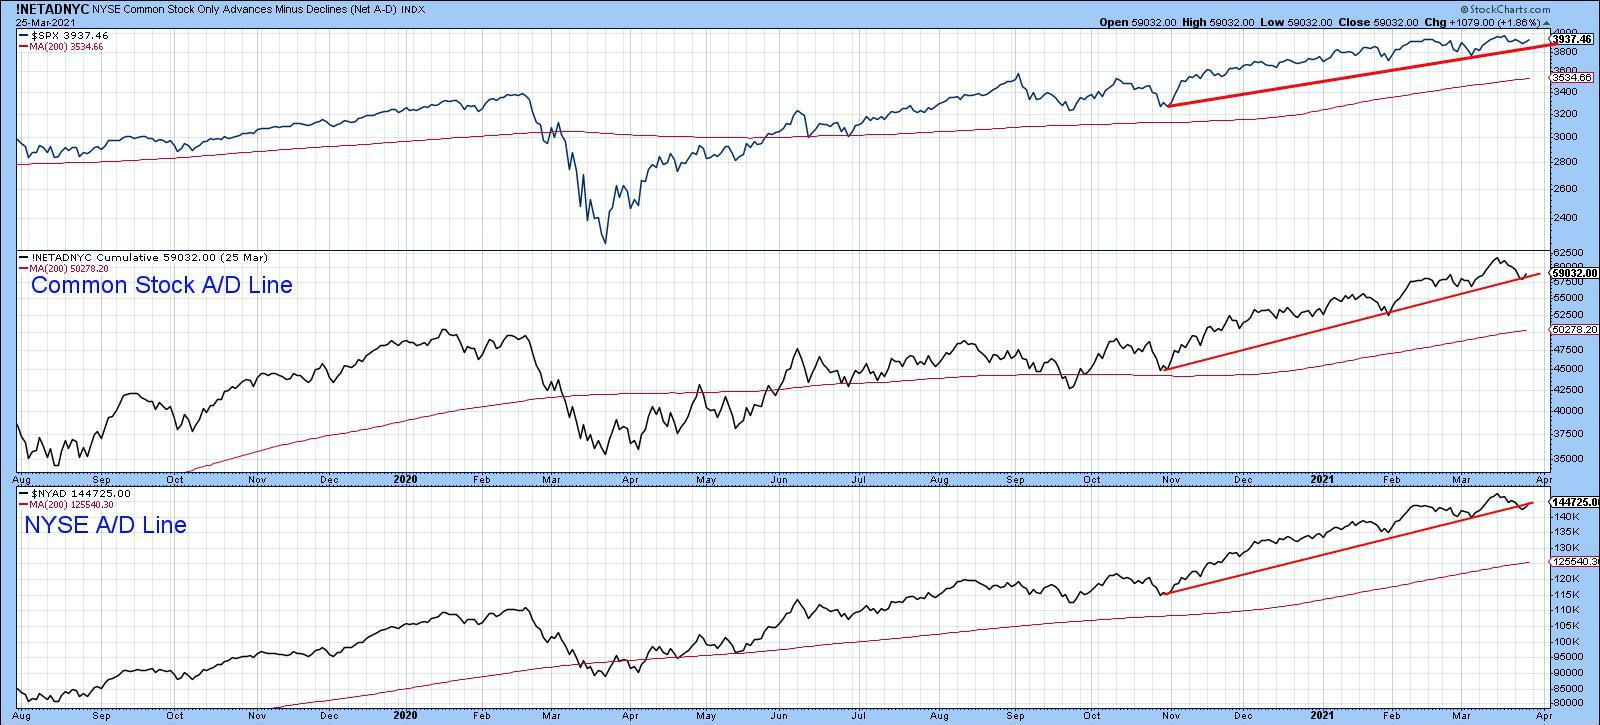
Several Key Indexes Testing Important Support
by Martin Pring,
President, Pring Research
It's never a good idea to try and predict contra-trend moves in a strong equity bull market, because the benefit of the doubt always goes with the prevailing trend. If false moves develop, they have a strong tendency to develop on the downside. That said, several key...
READ MORE
MEMBERS ONLY
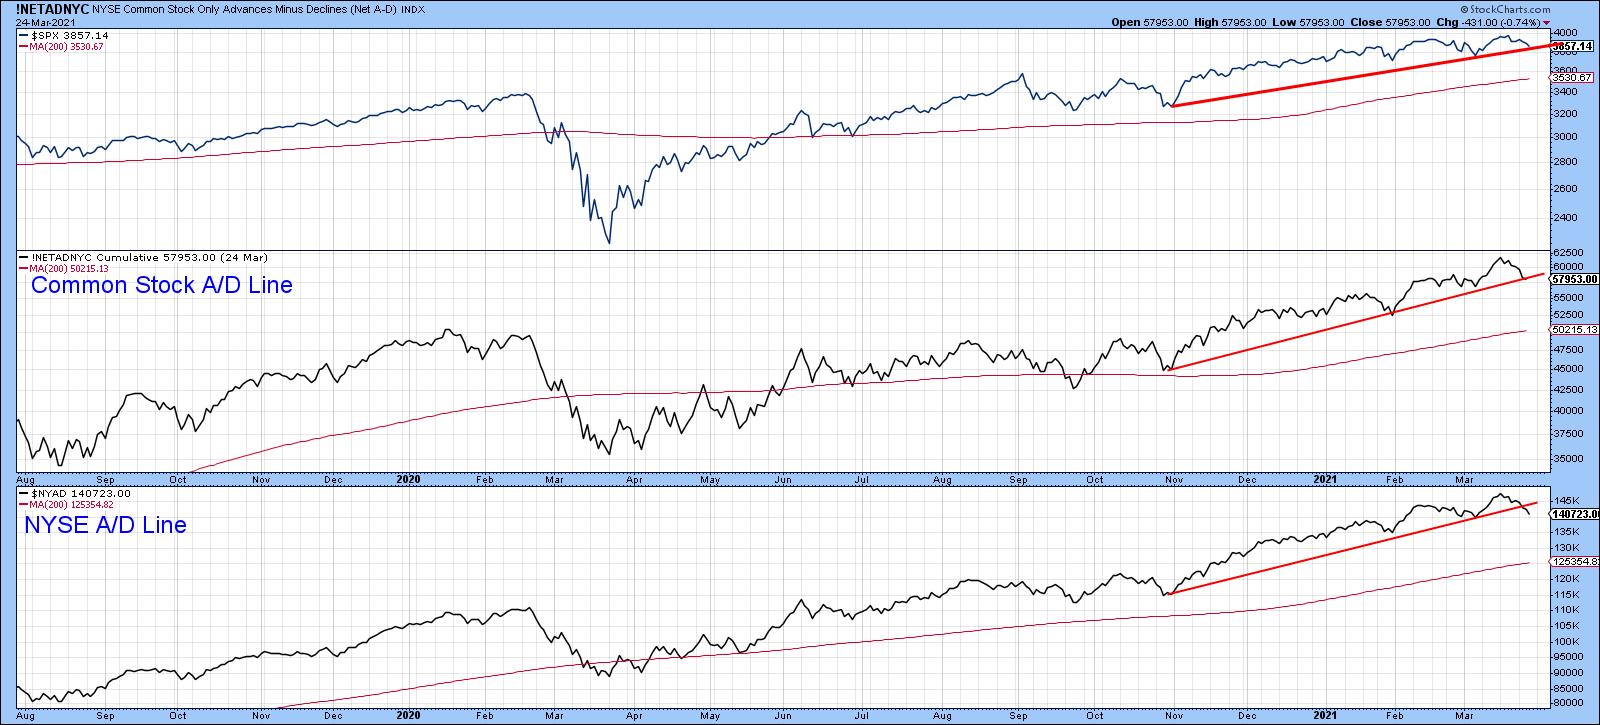
Several Key Indexes Testing Important Support
by Martin Pring,
President, Pring Research
It's never a good idea to try and predict contra-trend moves in a strong equity bull market, because the benefit of the doubt always goes with the prevailing trend. If false moves develop, they have a strong tendency to develop on the downside. That said, several key...
READ MORE
MEMBERS ONLY
The Idea of Rising Bond Yields May be Getting Too Popular
by Martin Pring,
President, Pring Research
The longer-term indicators have been bullish on bond yields (bearish on prices) for a while now. However, they are now being joined by a number of commentators offering a similar view, which makes me uncomfortable. Don't get me wrong, the indicators are still pointing to a primary...
READ MORE
MEMBERS ONLY
US Breaking Out Against the World, But the Stocks Doing it May Surprise You!
by Martin Pring,
President, Pring Research
Back in the opening week of the yearl I wrote an article entitled Four Charts and Four Themes of the First Half of 2021. Three of them - higher stocks, higher commodities and value starting to outperform growth - are so far on track, but my negative analysis concerning US equities versus...
READ MORE
MEMBERS ONLY
After 13 Years, a Key Multi-Year Sector Relationship May be Reversing - and Could Have Enormous Implications
by Martin Pring,
President, Pring Research
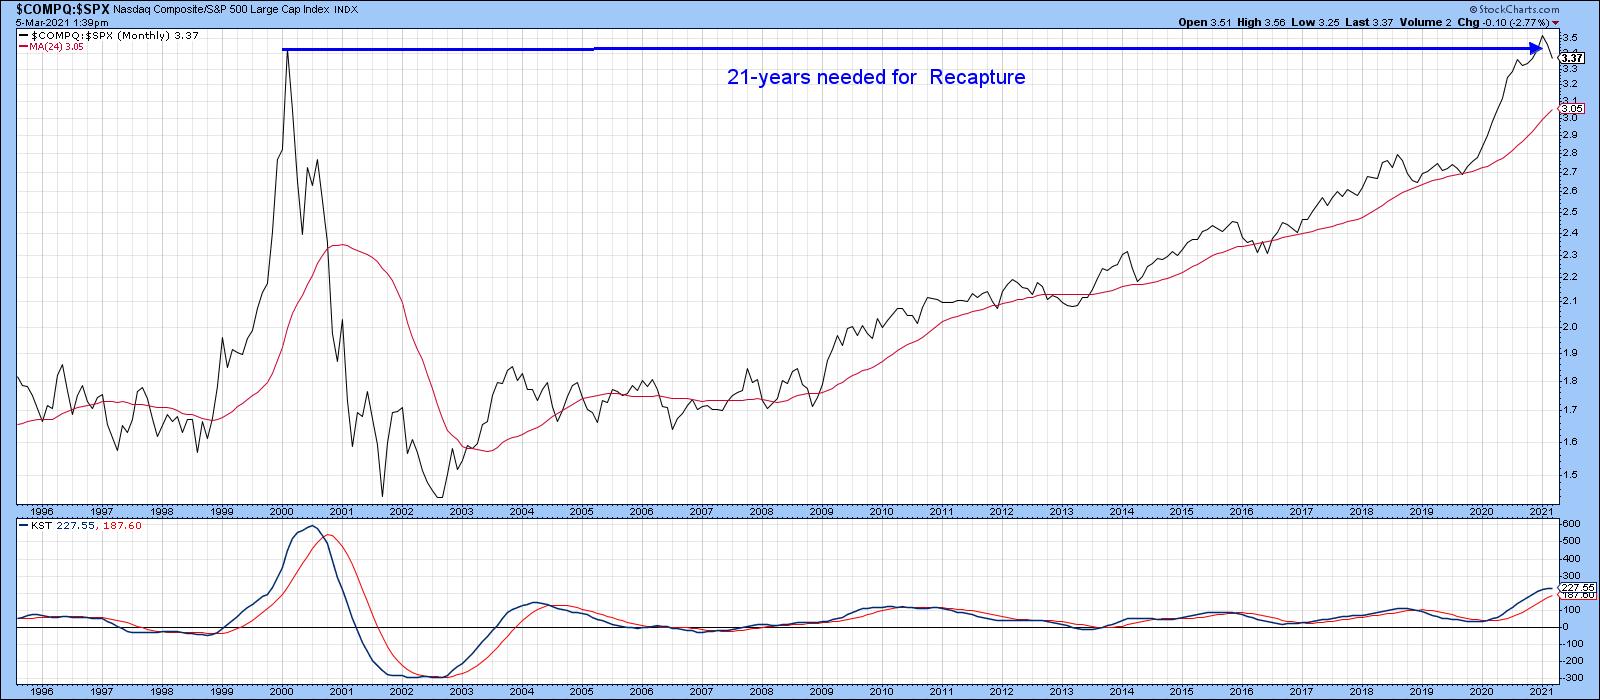
Technology, as reflected in the tech-dominated NASDAQ Composite, peaked as a group in 2000 and sank in popularity for the next 3 years. Since then, as shown by the relative graph in Chart 1, it has recaptured all of that lost ground. Now, its long-term KST may have...
READ MORE
MEMBERS ONLY
After 13 Years, a Key Multi-Year Sector Relationship May be Reversing - and Could Have Enormous Implications
by Martin Pring,
President, Pring Research
Technology, as reflected in the tech-dominated NASDAQ Composite, peaked as a group in 2000 and sank in popularity for the next 3 years. Since then, as shown by the relative graph in Chart 1, it has recaptured all of that lost ground. Now, its long-term KST may have...
READ MORE
MEMBERS ONLY
Five Confidence Relationships Hit Multi-Year Resistance; Breakout Would Signal Much Higher Stock Prices
by Martin Pring,
President, Pring Research
Many confidence relationships I follow have been confined to multi-year trading ranges, as investors have consistently swung between optimism and fear. The latest data show that many have rallied sharply and reached the upper region of this rangebound activity. That either means it's time to regroup and...
READ MORE
MEMBERS ONLY
Forget the Speculation and Uncertainty as these Short-Term Indicators are Bullish
by Martin Pring,
President, Pring Research
A few weeks ago I wrote an article entitled "Only a Fool Tries to Call a Correction in a Bull Market, So Here Goes!" Okay, so we did get a 4% drop in the Dow over a seven day period, but hardly anything worth worrying about. It reiterated...
READ MORE
MEMBERS ONLY
Using Short-Term Momentum to Define the Primary Trend Direction of Stocks, Bonds and the Dollar
by Martin Pring,
President, Pring Research
They say that a rising tide lifts all boats, and so it is with freely traded markets. In the boating world, you can spot a rising tide with a steadily rising boat, but, with markets, the simplest approach is to observe a series of rising peaks and troughs. However, there...
READ MORE
MEMBERS ONLY
Key Interasset Relationships are Bullish for Stocks and Commodities but Bearish for Bonds
by Martin Pring,
President, Pring Research
The business cycle approximates 41-months between the low points of slowdowns or recessions. For the record, a slowdown develops when the growth path of the economy declines, but not sufficiently to result in an actual recession, when economic momentum goes negative. The important point to bear in mind is...
READ MORE
MEMBERS ONLY
Long-Term Interest Rates Getting Close to an Upside Breakout
by Martin Pring,
President, Pring Research
The Fed has pledged to keep short-term rates around zero for an extended period. That's certainly in their power, and Chart 1, which features the 3-month Libor, indicates no sign of life. There is also quite a distance between the latest plot and its 12-month...
READ MORE
MEMBERS ONLY
Only a Fool Tries to Call a Correction in a Bull Market, So Here Goes!
by Martin Pring,
President, Pring Research
Last week, I recorded a 40-minute presentation with my friend Bruce Fraser on the 2021 outlook. It's currently being featured on StockCharts TVand calls for a significant extension to the bull market. We present a number of long-term charts featuring several indicators whose bullish signals have...
READ MORE
MEMBERS ONLY
Green Light Still Flashing for Higher Bond Yields, Stock & Commodity Prices
by Martin Pring,
President, Pring Research
Back in early November, I wrote an article entitled,Confidence is Breaking Out all Over, Which is Bullish for Stocks/Commodities and Bond Yields, where I examined several intermarket relationships that monitor confidence. Since then, all three markets have rallied, but a further review of some of these relationships presents...
READ MORE
MEMBERS ONLY
Five Charts and Four Themes for the First Half of 2021
by Martin Pring,
President, Pring Research
Prices are determined by the attitude of market participants to the emerging fundamentals. Fortunately for us technicians, these attitudes move in trends, and once a trend gets underway it tends to perpetuate. Provided it is not overstretched, we can reasonably assume that that trend will continue. It's in...
READ MORE
MEMBERS ONLY
Four Charts and Four Themes for the First Half of 2021
by Martin Pring,
President, Pring Research
Prices are determined by the attitude of market participants to the emerging fundamentals. Fortunately for us technicians, these attitudes move in trends, and once a trend gets underway it tends to perpetuate. Provided it is not overstretched, we can reasonably assume that that trend will continue. It's in...
READ MORE
MEMBERS ONLY
Why Gold Bugs Should Be Praying for the Demise of Commodities
by Martin Pring,
President, Pring Research
Last month, the gold price slipped down very closely towards its 12-month MA. This is not a perfect indicator, but most downside penetrations are followed by bearish action, so you could say that gold is at the crossroads. Chart 1 tells us that prices have bounced a bit since...
READ MORE
MEMBERS ONLY
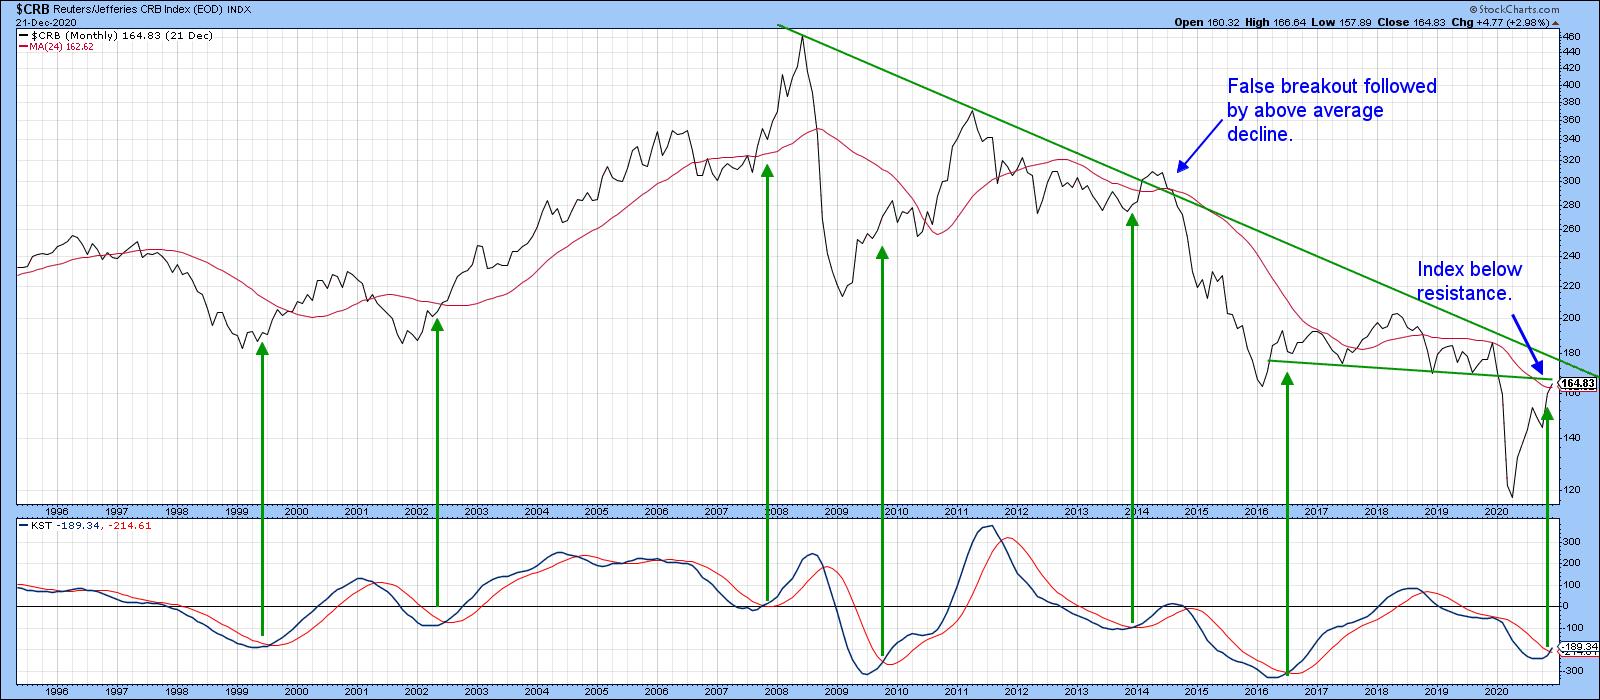
Bullish Commodities Run Into Resistance
by Martin Pring,
President, Pring Research
The global business cycle is nothing more than a chronological sequence of economic and financial market turning points. One of these involves a bottoming of commodity prices, as a new bull market gets underway. That reversal occurred several months ago and has recently been confirmed by numerous long-term indicators....
READ MORE
MEMBERS ONLY
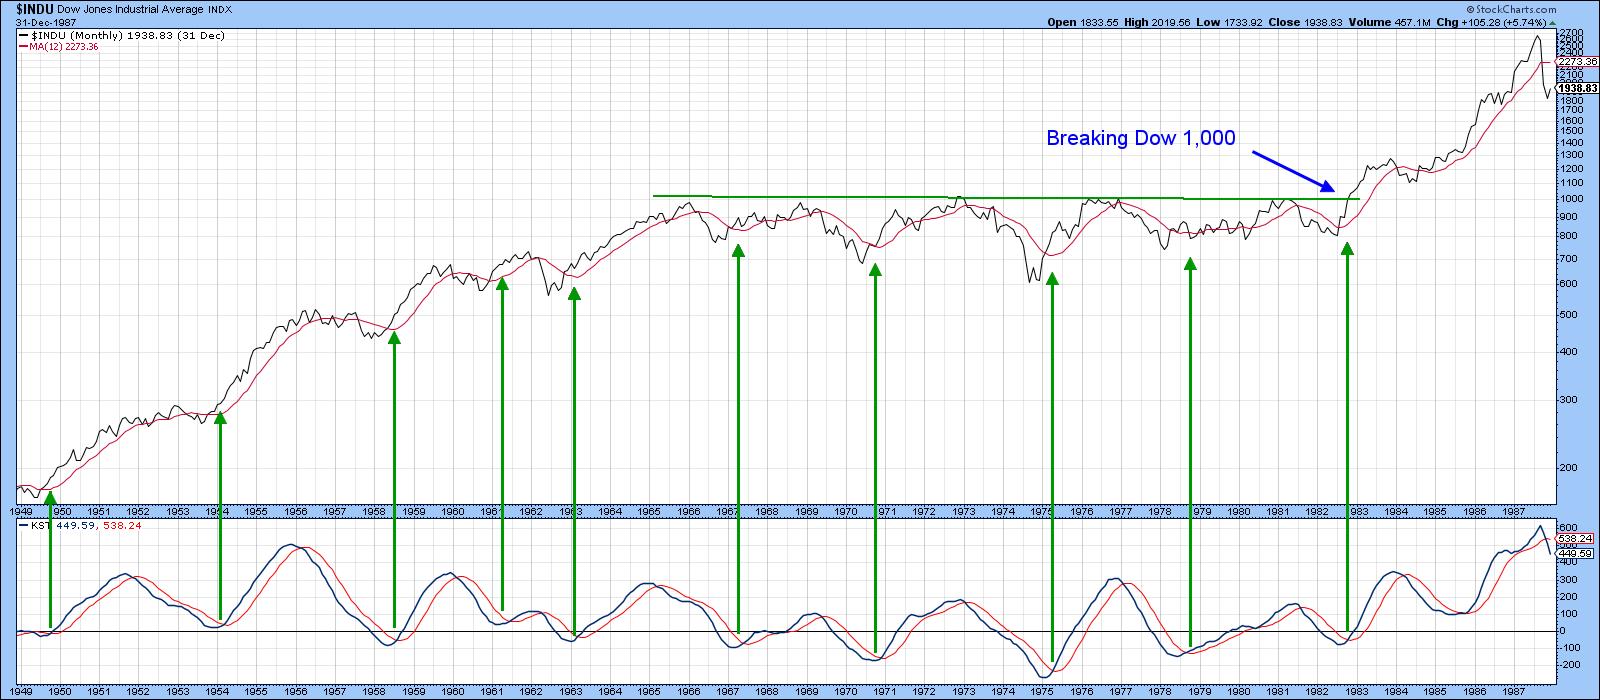
Numerous International Multi-Year Trading Ranges are Reminiscent of the 1982 Dow 1,000 Breakout
by Martin Pring,
President, Pring Research
Years ago, before online charting platforms were widely available, technicians resorted to chartbooks published on a weekly or monthly basis and received days later in the snail mail. Using their long-term perspective helped a lot of us to appreciate that surpassing Dow 1,000 (see Chart 1) was a...
READ MORE