MEMBERS ONLY
September 3, 1929 was the Peak; September 3, 2020 sees the NASDAQ Lose Almost 5%
by Martin Pring,
President, Pring Research
I don't think there is a connection between 1929 and 2020, but the headline seemed too good to pass up. Late last week, I mentioned that September is the weakest month of the year for stocks while October is prone to crashes. "Welcome to the bearish season,...
READ MORE
MEMBERS ONLY
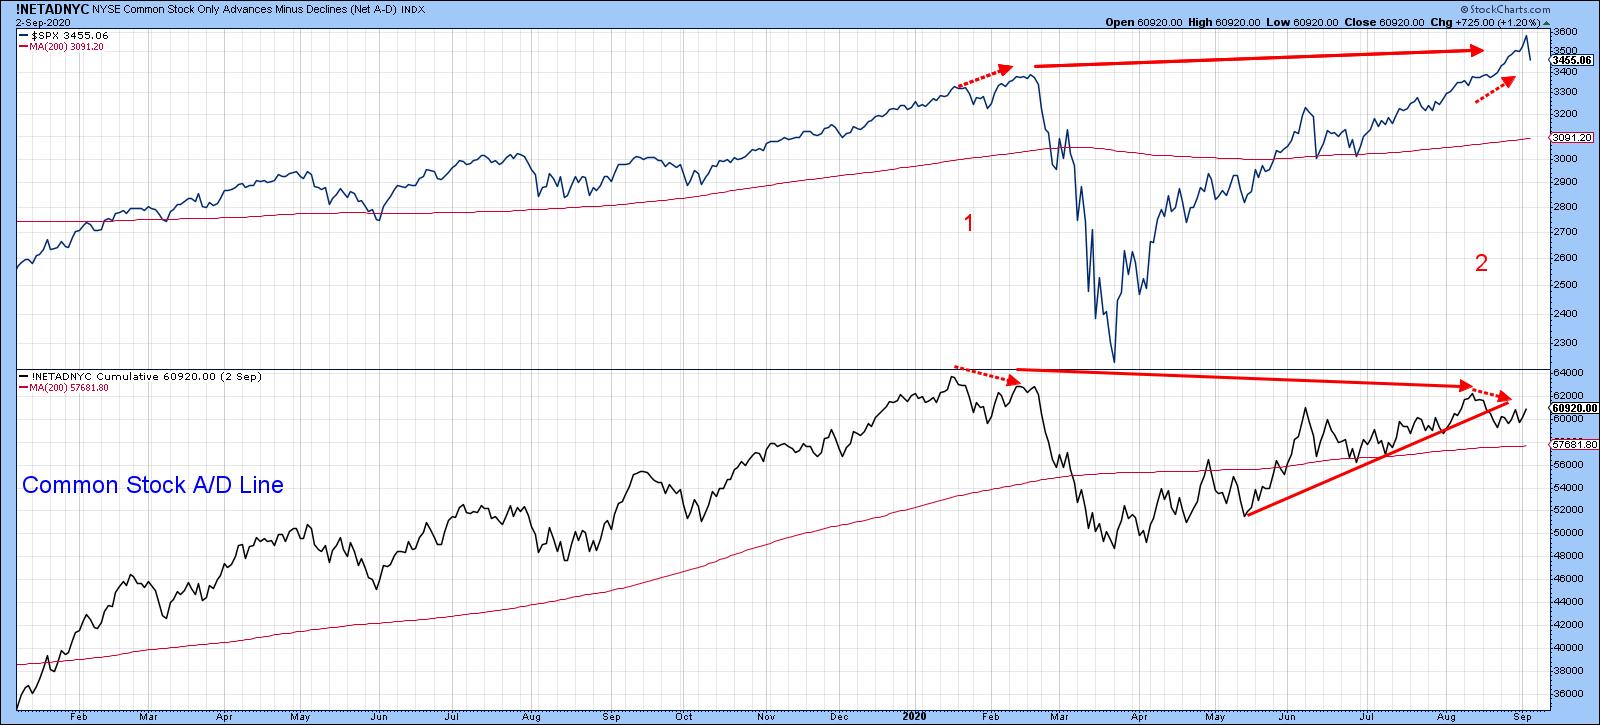
Eight Charts I Am Watching Closely Right Now
by Martin Pring,
President, Pring Research
Strong Bull Market Indications
We are all aware of the Shakespearian saying "Beware of the Ides of March," which didn't go so well for Julius Caesar. In market folklore, October is the season for crashes and September is the worst-performing month. Welcome to the bearish season!...
READ MORE
MEMBERS ONLY
Eight Charts I Am Watching Closely Right Now
by Martin Pring,
President, Pring Research
* Strong Bull Market Indications
* Short-Term Vulnerability?
Strong Bull Market Indications
We are all aware of the Shakespearian saying "Beware of the Ides of March," which didn't go so well for Julius Caesar. In market folklore, October is the season for crashes and September is the worst-performing...
READ MORE
MEMBERS ONLY
Dollar Bear to Take a Breather?
by Martin Pring,
President, Pring Research
* The Bear Market Case
* Time for a Counter-Cyclical Rally?
The Bear Market Case
By most methods and approaches, the Dollar Index is in a bear market. Take Chart 1, for instance, which compares the Index to its long-term KST. The pink-shaded areas tell us when it is below its 12-month...
READ MORE
MEMBERS ONLY
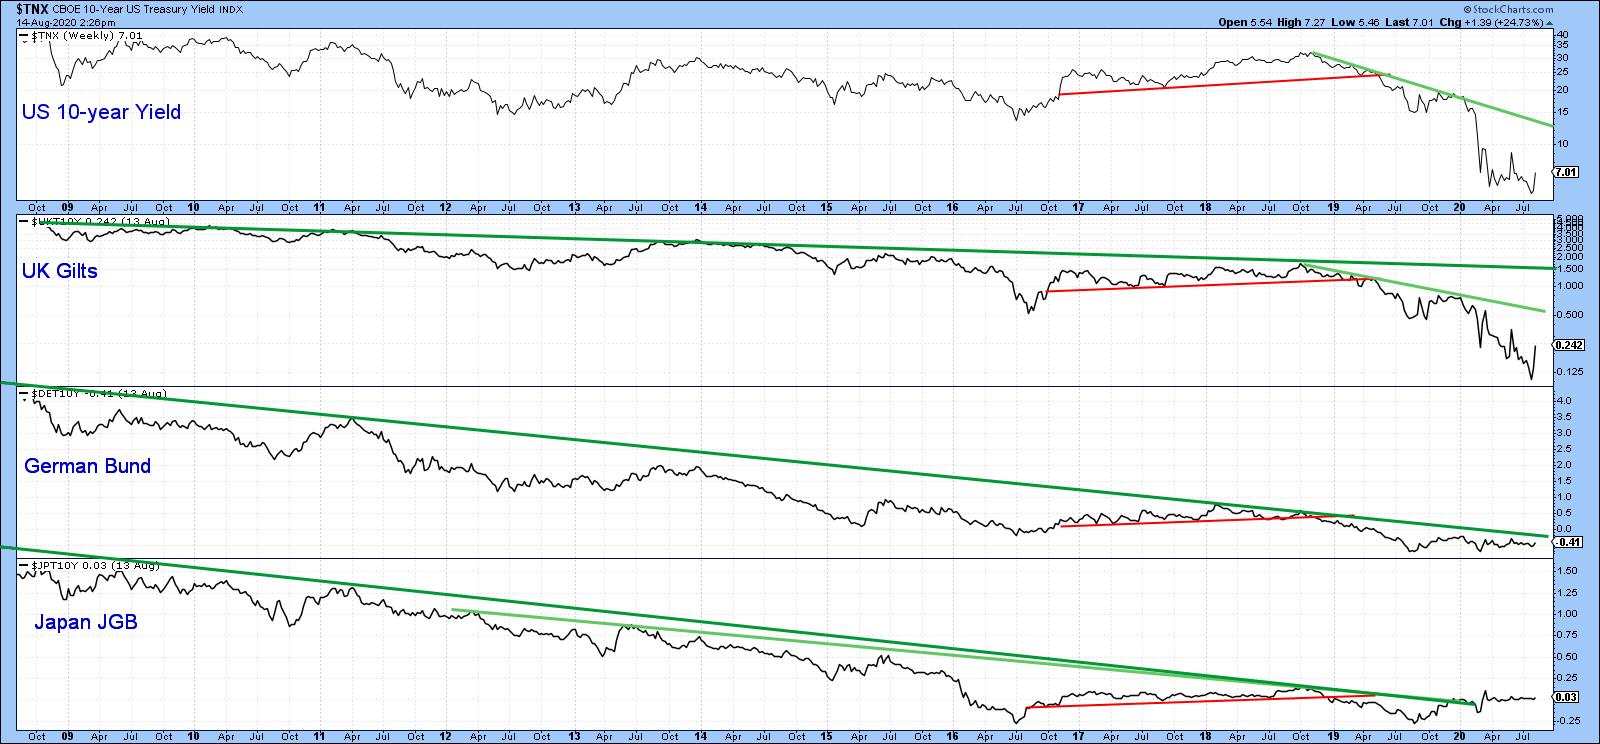
Time for a Little Firmness in Bond Yields?
by Martin Pring,
President, Pring Research
Chart 1 shows that the basic trend for bond yields around the world is still negative, as all series are in a clear-cut downtrend. The only exception is Japan, where the secular down trendline was violated earlier in the year. So far, though, the yield has only managed a sideways...
READ MORE
MEMBERS ONLY
Evidence of a Commodity Bull Market Continues to Grow
by Martin Pring,
President, Pring Research
I have written about commodities several times in the last four months or so as evidence of a major reversal had begun to appear. Now, more indicators are starting to turn. Near-term, things look overdone, but if this is really is a bull market, that will not matter, as short-term...
READ MORE
MEMBERS ONLY
Copper Could Hold the Key for the Next Leg Up in the Stock Market Rally
by Martin Pring,
President, Pring Research
Swings in commodity prices are both a market and an economic indicator. There are certainly exceptions, but when the economy is in a recovery phase, commodity prices generally rise. During the early phase of the business cycle, rising commodities are beneficial for stocks, not only for commodity-sensitive sectors such as...
READ MORE
MEMBERS ONLY
Copper Could Hold the Key for the Next Leg Up in the Stock Market Rally
by Martin Pring,
President, Pring Research
* Rising Commodity Momentum is Bullish for Stocks and the Economy
* Long-Term Technicals Look Promising for Copper
Swings in commodity prices are both a market and an economic indicator. There are certainly exceptions, but when the economy is in a recovery phase, commodity prices generally rise. During the early phase of...
READ MORE
MEMBERS ONLY
Where Do You Invest if the Trend Favoring the US Against the World Reverses?
by Martin Pring,
President, Pring Research
* The US versus the Rest of the World
* Europe
* Asia
The US versus the Rest of the World
Chart 1 shows that the up trend favoring the S&P Composite against the Vanguard All-World Ex-US ETF (the VEU) is intact. That's because the latest plot is above...
READ MORE
MEMBERS ONLY
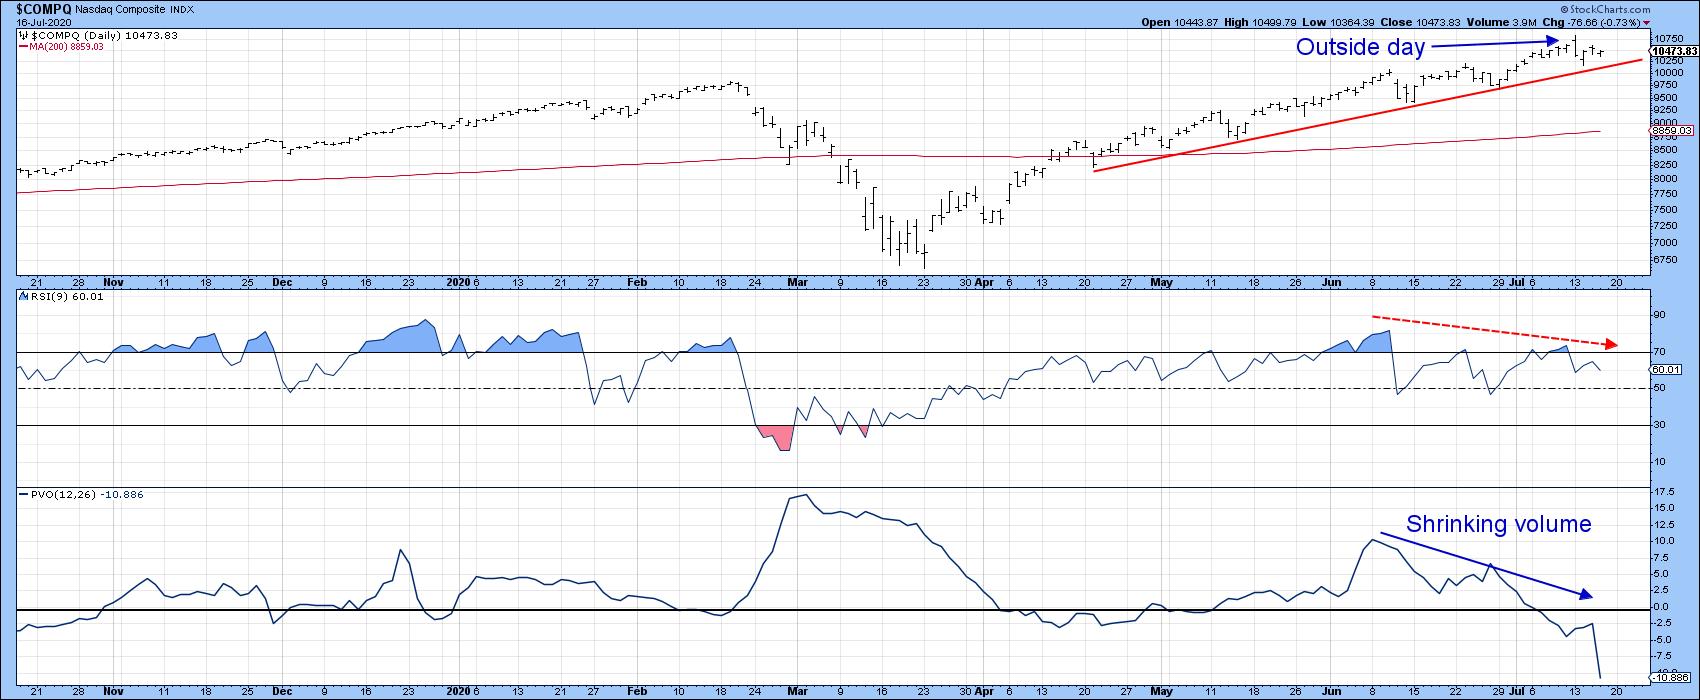
New Sector Leadership May Be Emerging
by Martin Pring,
President, Pring Research
Technology About to Pause?
The undisputed king of sectors so far this year has been technology. This week's price action from the tech dominated NASDAQ Composite ($COMPQ), though, suggests that this leadership may be rotating elsewhere. Take Chart 1, for instance; it shows that Monday's price...
READ MORE
MEMBERS ONLY
A Changing of the Guard? New Sector Leadership May Be Emerging
by Martin Pring,
President, Pring Research
* Technology About to Pause?
* New Blood is Starting to Emerge
* Two Fence Sitters
Technology About to Pause?
The undisputed king of sectors so far this year has been technology. This week's price action from the tech dominated NASDAQ Composite ($COMPQ), though, suggests that this leadership may be rotating...
READ MORE
MEMBERS ONLY
Silver May Be Close to a Major Breakout
by Martin Pring,
President, Pring Research
* Silver has been Range-Bound - But is That About to End?
* Silver Shares Starting to Perk Up
* Silver Bottoming Against Gold?
Silver has been Range-Bound - But is That About to End?
Gold has been in a strong bull market recently, which has eclipsed the performance of the gray metal....
READ MORE
MEMBERS ONLY
The Shanghai Composite Experiences A Historic Breakout
by Martin Pring,
President, Pring Research
* Shanghai Composite Ruptures Mega Trendline
* Chinese ETFs Breaking as Well
* Interesting Chinese Sector ETFs
Back in March, I wrote about the Chinese stock market, as it had started to improve in terms of relative action against the S&P. Since then, Chinese equities have moved higher with no net...
READ MORE
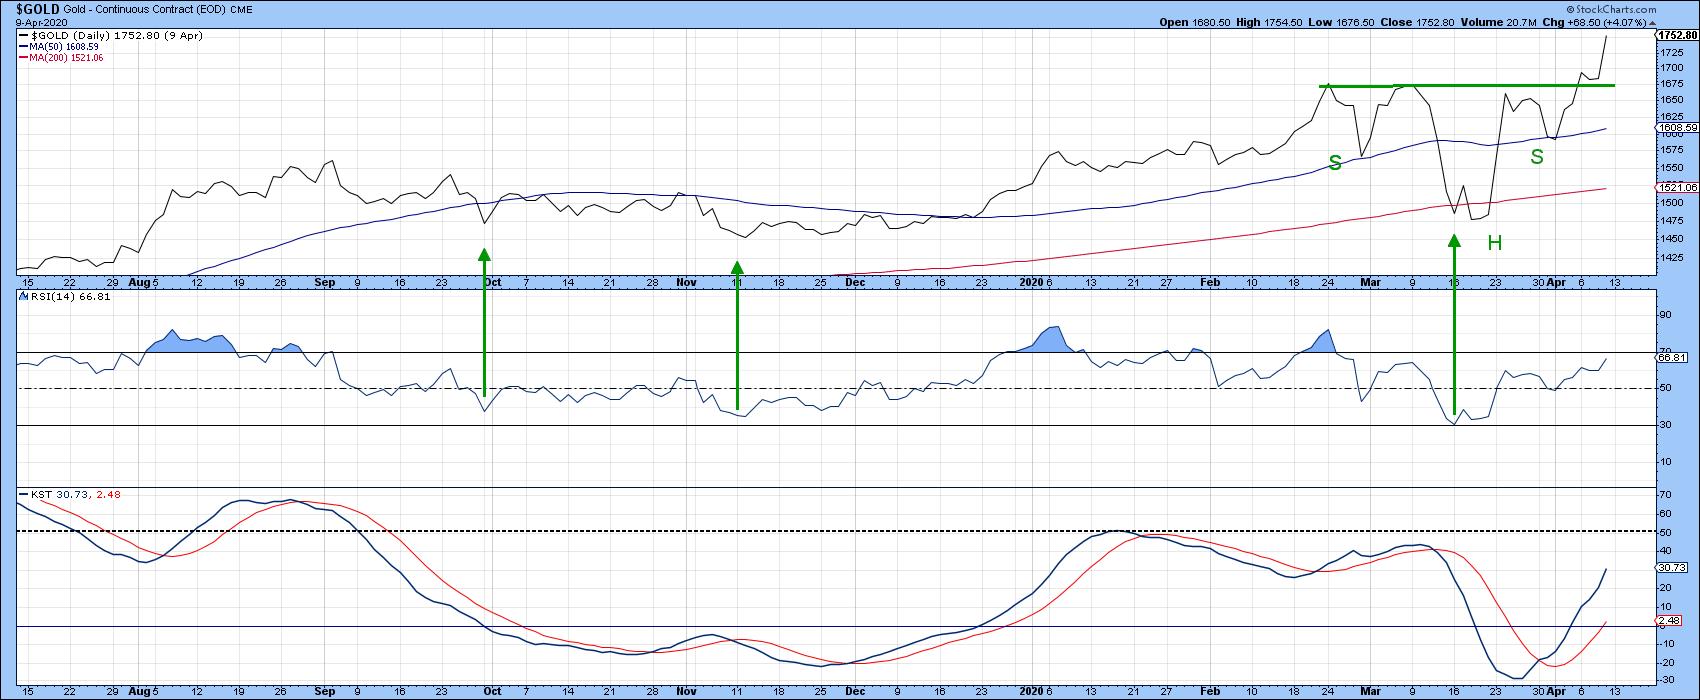
MEMBERS ONLY
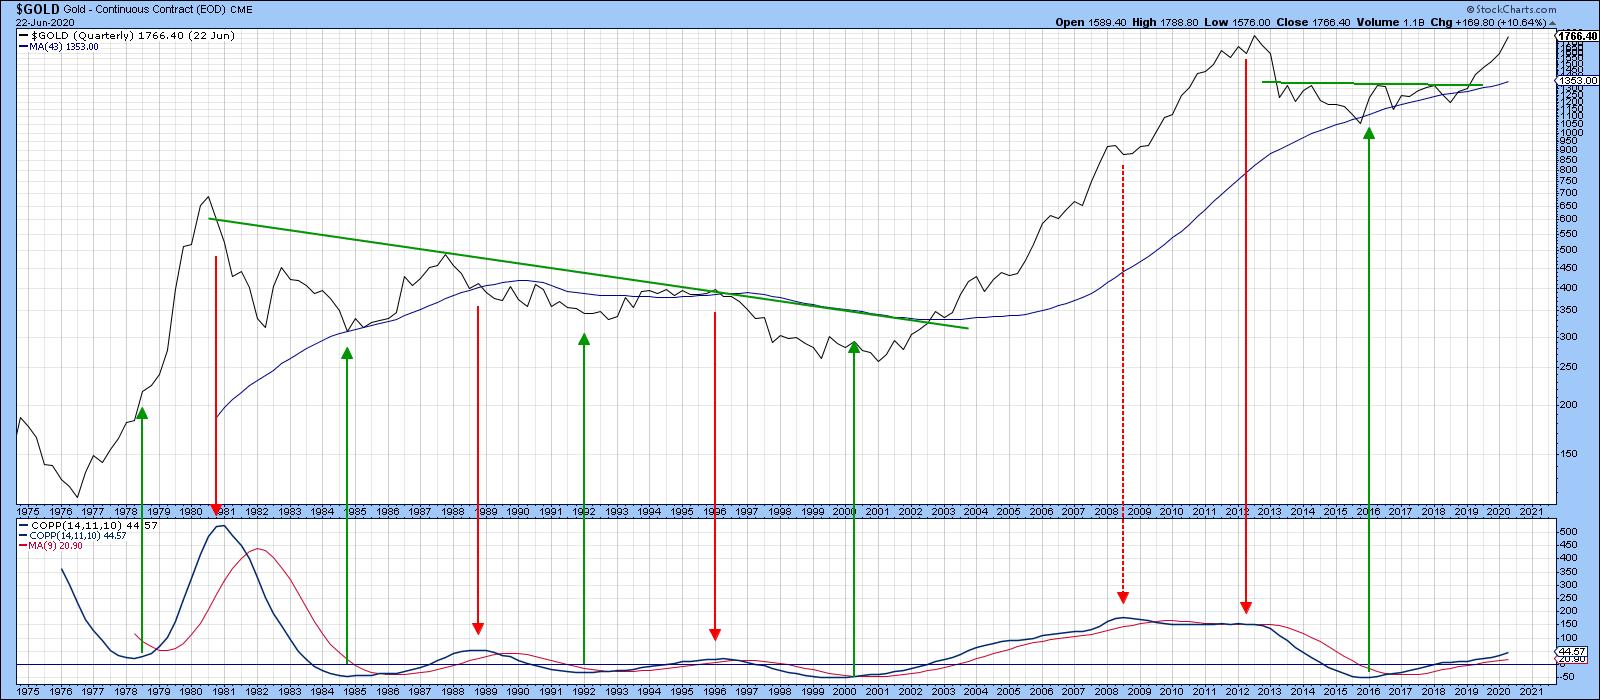
Gold Moves to a New High; Will the Breakout Hold?
by Martin Pring,
President, Pring Research
Long-Term Gold Charts Give Perspective
Gold broke out to a new recovery high on Tuesday and looks set to gain more ground, all with a favorable background from the long-term trend.
Chart 1 compares the quarterly gold price to a Coppock indicator and its 9-quarter moving average. This is not...
READ MORE
MEMBERS ONLY
Gold Moves to a New High; Will the Breakout Hold?
by Martin Pring,
President, Pring Research
* Long-Term Gold Charts Give Perspective
* Gold vs. the Dollar
* Gold vs. Gold Shares
* Short-Term Gold Position
* Conclusion
Long-Term Gold Charts Give Perspective
Gold broke out to a new recovery high on Tuesday and looks set to gain more ground, all with a favorable background from the long-term trend.
Chart 1...
READ MORE
MEMBERS ONLY
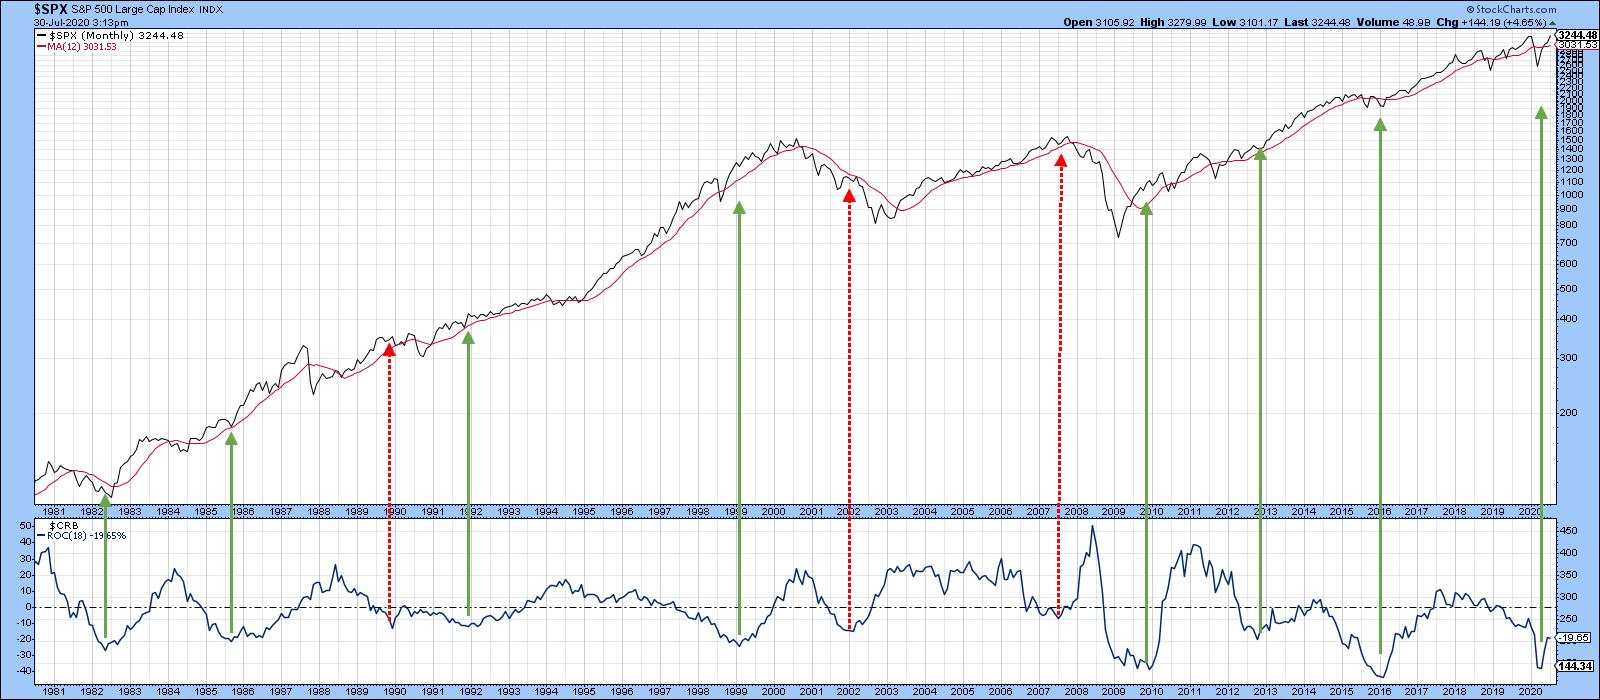
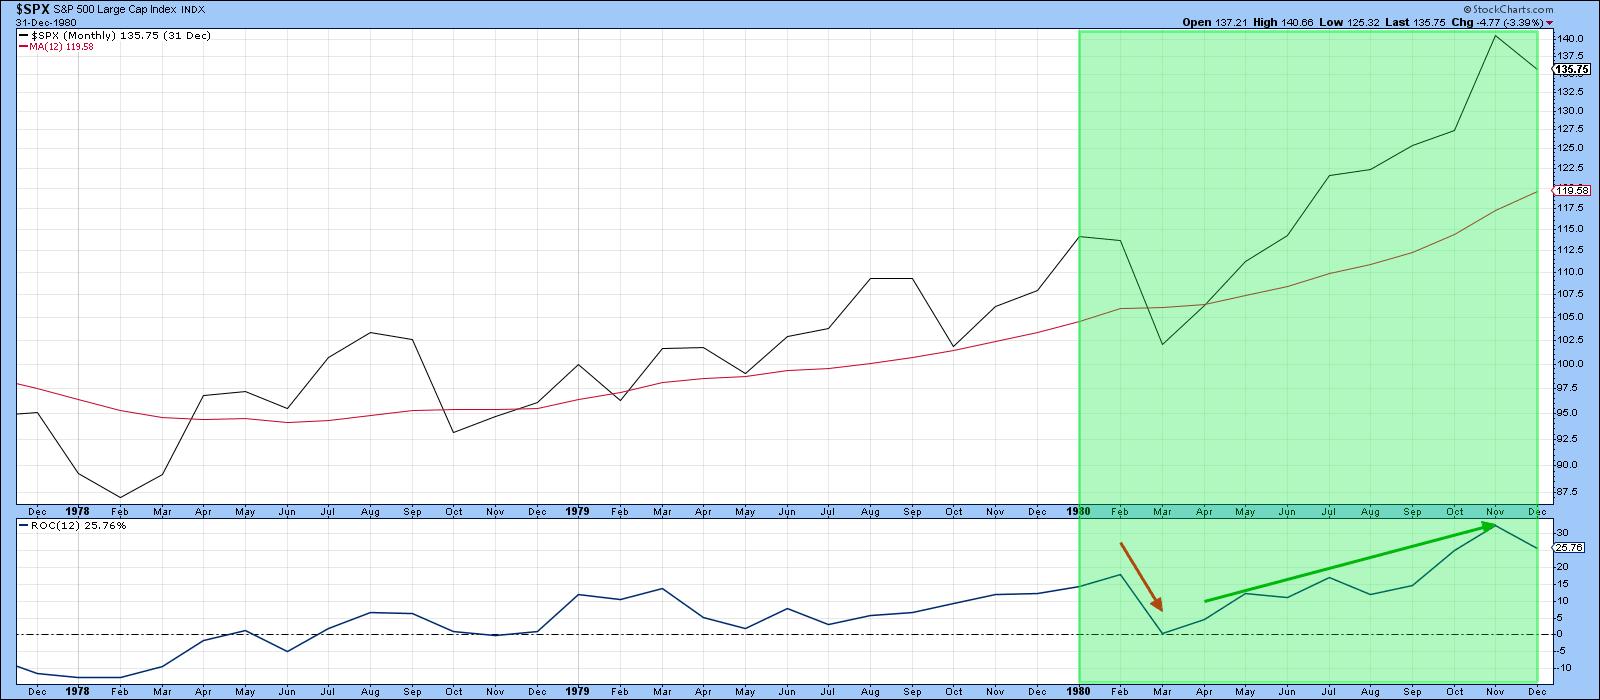
Is Twenty-Twenty Nineteen-Eighty Déjà vu All Over Again?
by Martin Pring,
President, Pring Research
The simple answer to the question posed in the title is "No!". However, there are a number of interesting parallels that have implications for 2020 and beyond. Let's see what they are.
The Decennial Cycle and Years Ending in a "0"
According to the...
READ MORE
MEMBERS ONLY
Is Twenty-Twenty Nineteen-Eighty Déjà vu All Over Again?
by Martin Pring,
President, Pring Research
* The Decennial Cycle and Years Ending in a "0"
* 1980 and 2020 Both Experienced Recessions
* Further Out, Things are More Problematic
* China Technology Breaks to the Upside
The simple answer to the question posed in the title is "No!". However, there are a number of interesting...
READ MORE
MEMBERS ONLY
Market Action Confirms the Employment Report
by Martin Pring,
President, Pring Research
* Market Gets a New Lease on Life
* Ten-Day Breadth Ratio Hits Bullish Extreme
* S&P Stocks Above 50-day MA Also Hit a Bullish Extreme
* Can Small-Caps Extend their Sharp Rally?
Usually, when a market rallies sharply and experiences an overbought condition, the probabilities favor corrective activity of some kind....
READ MORE
MEMBERS ONLY
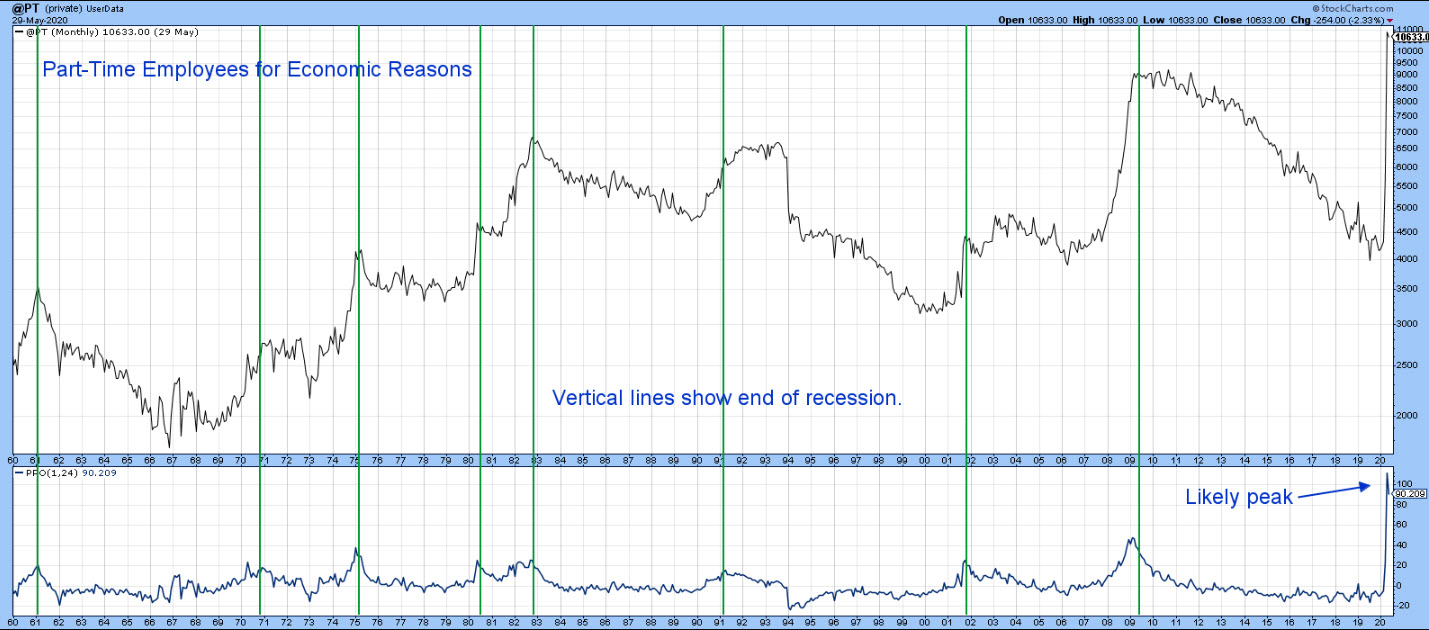
Did the May Employment Report Signal an End to the Recession?
by Martin Pring,
President, Pring Research
Part-Time Employees for Economic Reasons is a leading indicator of the labor market. That's because employers are more inclined to hire and fire temporary workers than permanent ones, where labor laws, contracts, pensions and other impediments get in the way. This indicator has been consistently useful in identifying...
READ MORE
MEMBERS ONLY
Commodities Reach Important Breakout Points, Part II
by Martin Pring,
President, Pring Research
* The Gold/CRB Ratio as a Commodity Indicator
* Close Correlation between Canadian/Australian Dollars and Commodities
* The Stock Market Votes for Commodities
* Short-Term Breakout Underway?
The Gold/CRB Ratio as a Commodity Indicator
A couple of weeks ago, I wrote an article on commodities suggesting that conditions were falling into...
READ MORE
MEMBERS ONLY
Nasdaq Closes a Major Gap
by Martin Pring,
President, Pring Research
March Was a Really Strong Bottom
Tuesday's action looks bullish on the surface, but may signal the end of the rally. I emphasized the word "may" not because I am trying to hedge my bets, but more because the March bottom, by historical standards, was a...
READ MORE
MEMBERS ONLY
S&P Fails at its 200-Day MA and NASDAQ Closes a Major Gap
by Martin Pring,
President, Pring Research
* March Was a Really Strong Bottom
* NASDAQ Closes a Gap
* S&P Fails at its 200-Day MA
* Conclusion
March Was a Really Strong Bottom
Tuesday's action looks bullish on the surface, but may signal the end of the rally. I emphasized the word "may" not...
READ MORE
MEMBERS ONLY
Commodity Indexes Reach Important Breakout Points
by Martin Pring,
President, Pring Research
The Stock Market is Forecasting Higher Commodity Prices
[One big] thing going positive for commodities is my Inflation/Deflation ratio. This series pits equities sensitive to swings in commodity prices, such as natural resource stocks, to those that do better when interest rates are falling, such as utilities, consumer staples,...
READ MORE
MEMBERS ONLY
Commodity Indexes Reach Important Breakout Points
by Martin Pring,
President, Pring Research
* Gold Has Done its Work as a Leading Commodity Indicator
* The Stock Market is Forecasting Higher Commodity Prices
* Commodities on the Verge of a Breakout
* Oil VIX Signals a Major Bottom in Oil Prices
Three weeks ago, I raised the question as to whether commodities had begun to embark on...
READ MORE
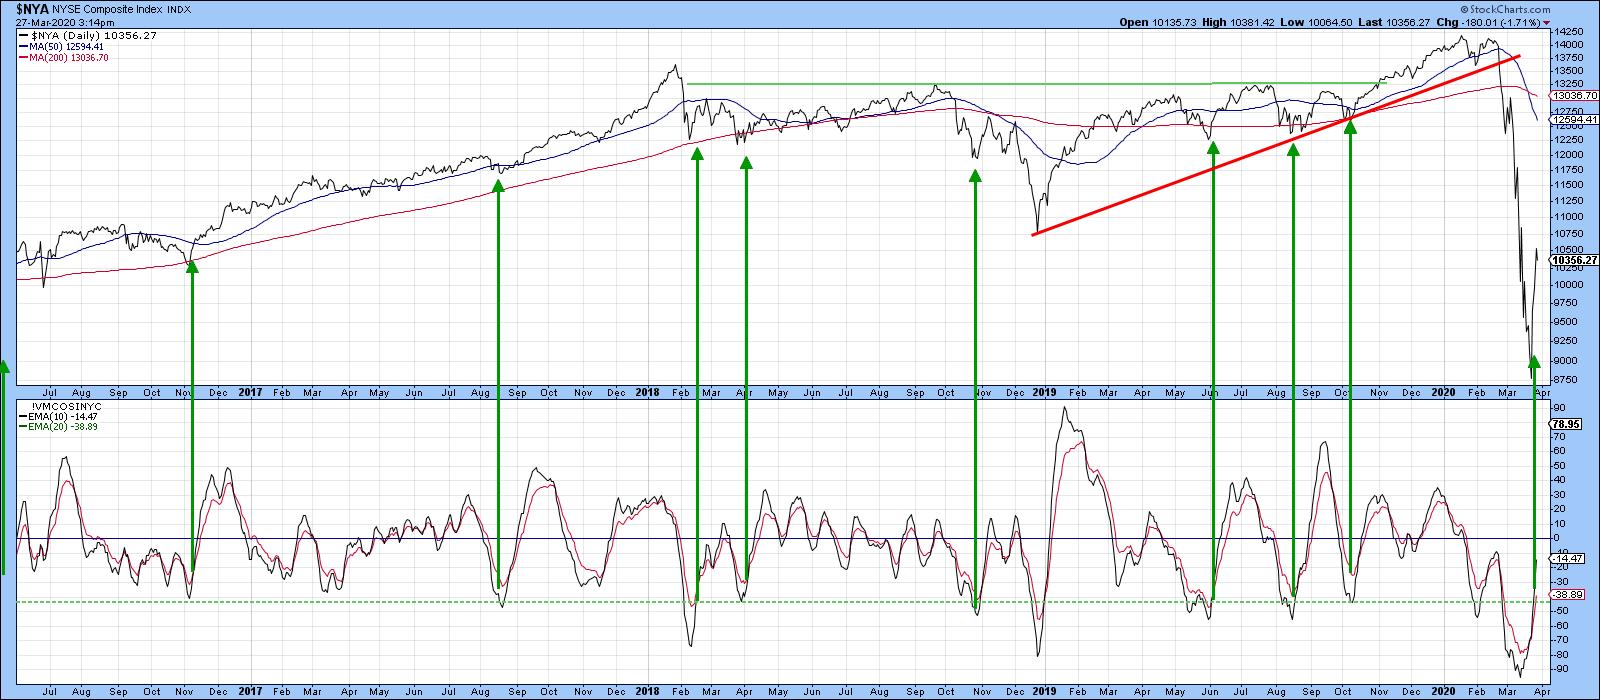
MEMBERS ONLY
S&P Struggling Below Its 200-Day MA; Watch Those Financials!
by Martin Pring,
President, Pring Research
Last week, I pointed out that the S&P Composite, despite the strong rally off the March low, had failed to touch an overbought condition. That presented a problem, since a security that is unable to reach an overstretched reading is usually suffering from some kind of a bear...
READ MORE
MEMBERS ONLY
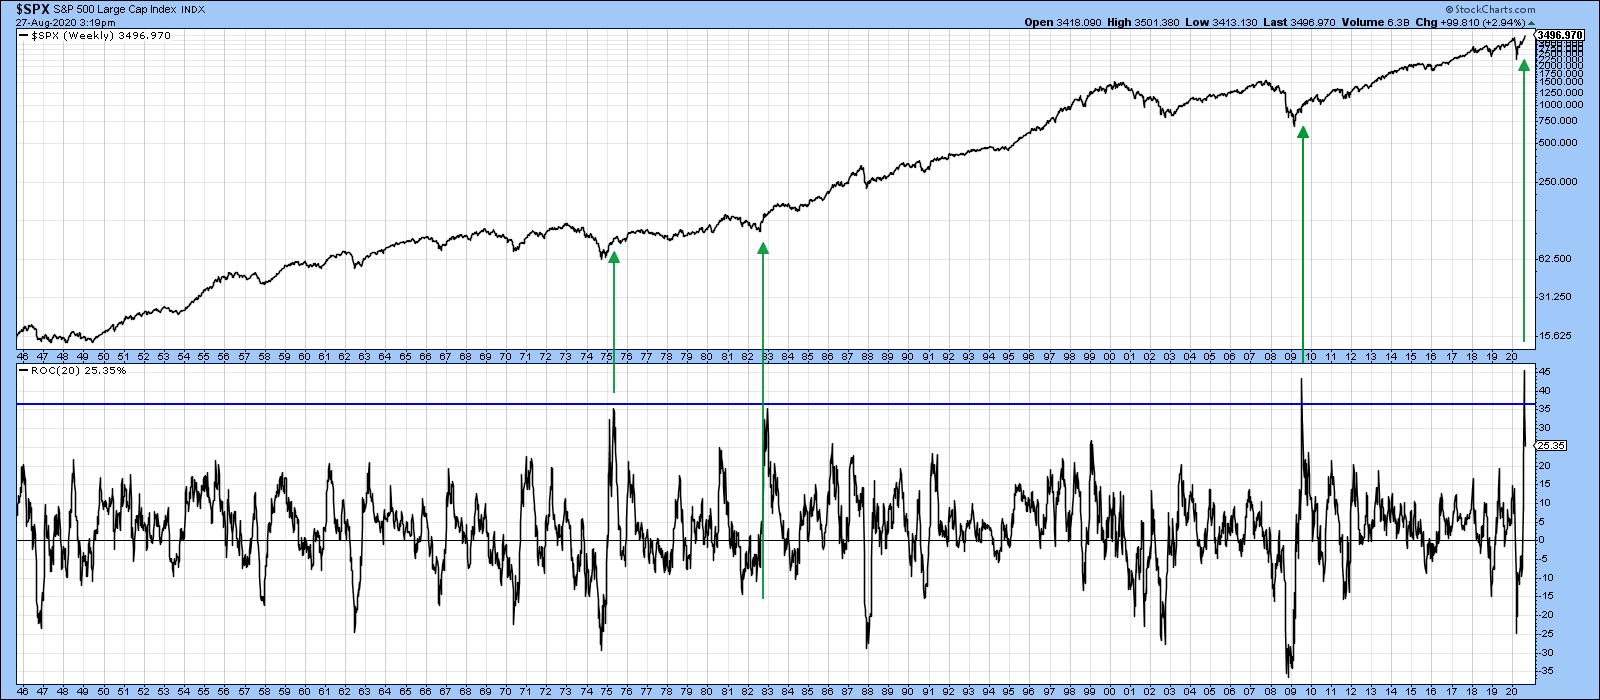
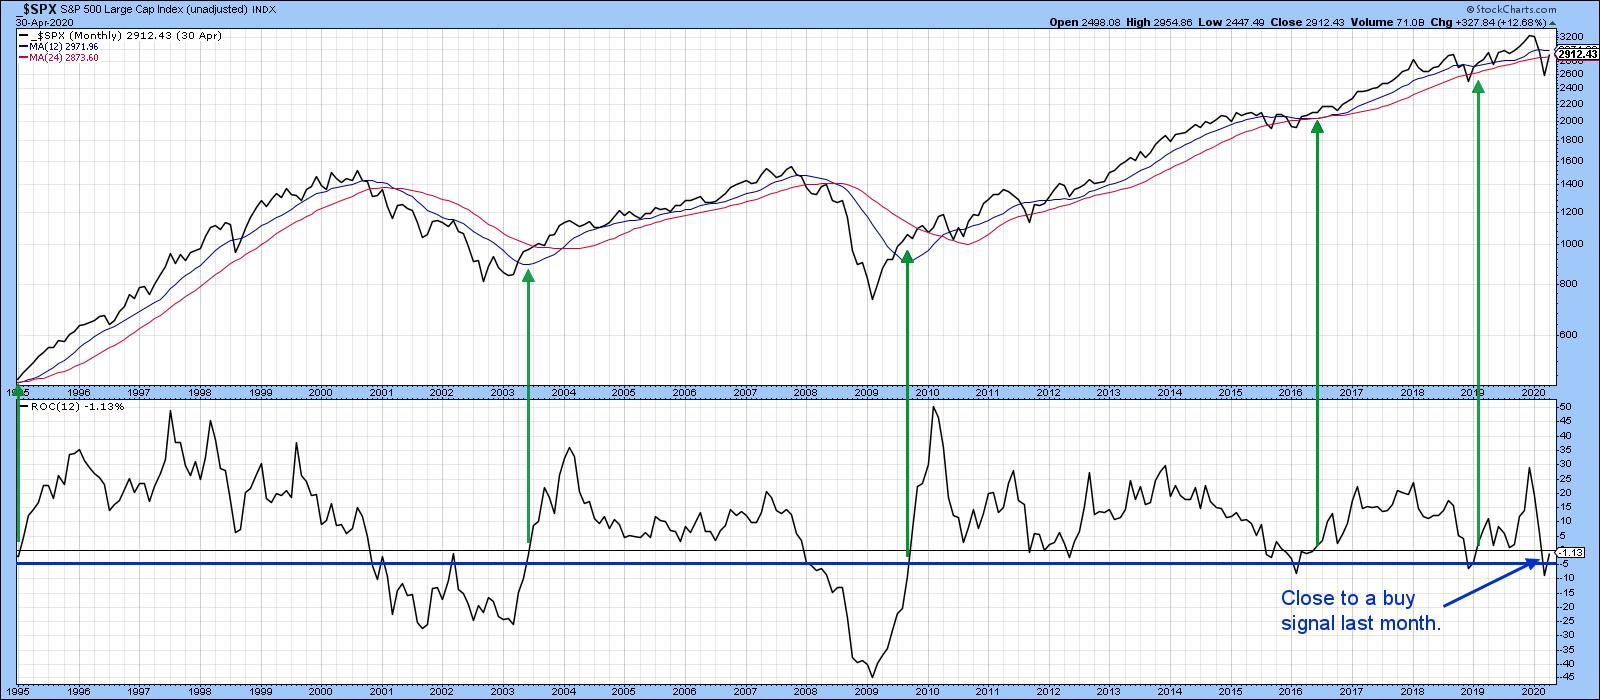
This Reliable Long-Term Indicator Could Go Bullish at the End of the Month
by Martin Pring,
President, Pring Research
Sixty-Five Year Record of Success
One of my favorite long-term indicators involves the 12-month ROC of the S&P Composite falling below the -5% level and subsequently rallying back above zero. This approach is shown in Chart 1, which illustrates the period from 1995 through April 30 of this...
READ MORE
MEMBERS ONLY
Is It Time For a Commodity Rally?
by Martin Pring,
President, Pring Research
Commodities have been badly beaten up in the last few months, but no market goes down for ever, so it's natural to ask the question of whether it's time for an upside reversal. The evidence for that is not conclusive yet, but there are some very...
READ MORE
MEMBERS ONLY
Trendline Violations Suggest The Rally Is Losing Momentum
by Martin Pring,
President, Pring Research
Editor's Note: This is an updated version of an article originally posted on Martin Pring's Market Roundup on April 21, 2020.
In recent articles, I have pointed out that quite a few of the short-term indicators reached well beyond their normal oversold readings at the March...
READ MORE
MEMBERS ONLY
Trendline Violations Suggest The Rally Is Losing Momentum
by Martin Pring,
President, Pring Research
In recent articles, I have pointed out that quite a few of the short-term indicators reached well beyond their normal oversold readings at the March lows. Historically, this is has been a very bullish characteristic, often signaling the end of a bear market. The difference between now and most of...
READ MORE
MEMBERS ONLY
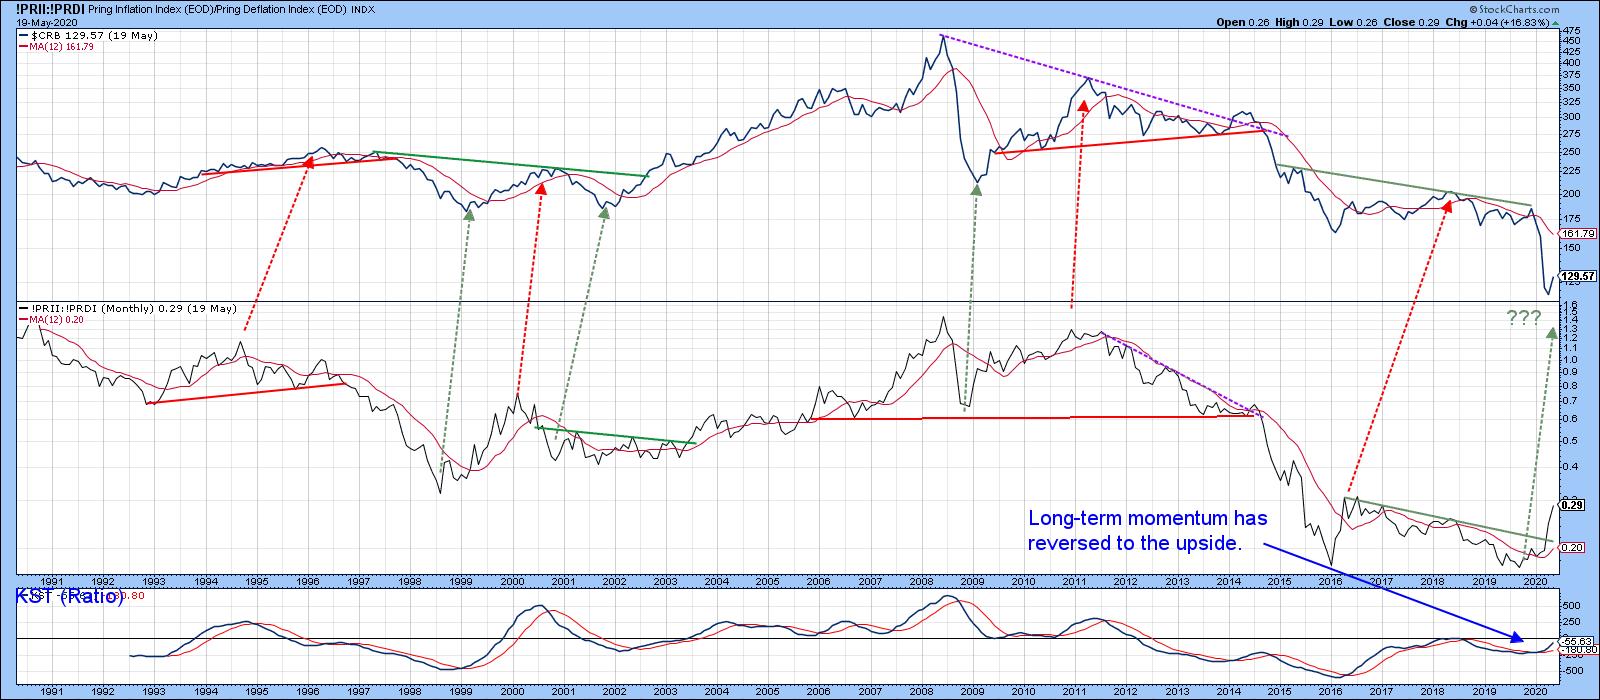
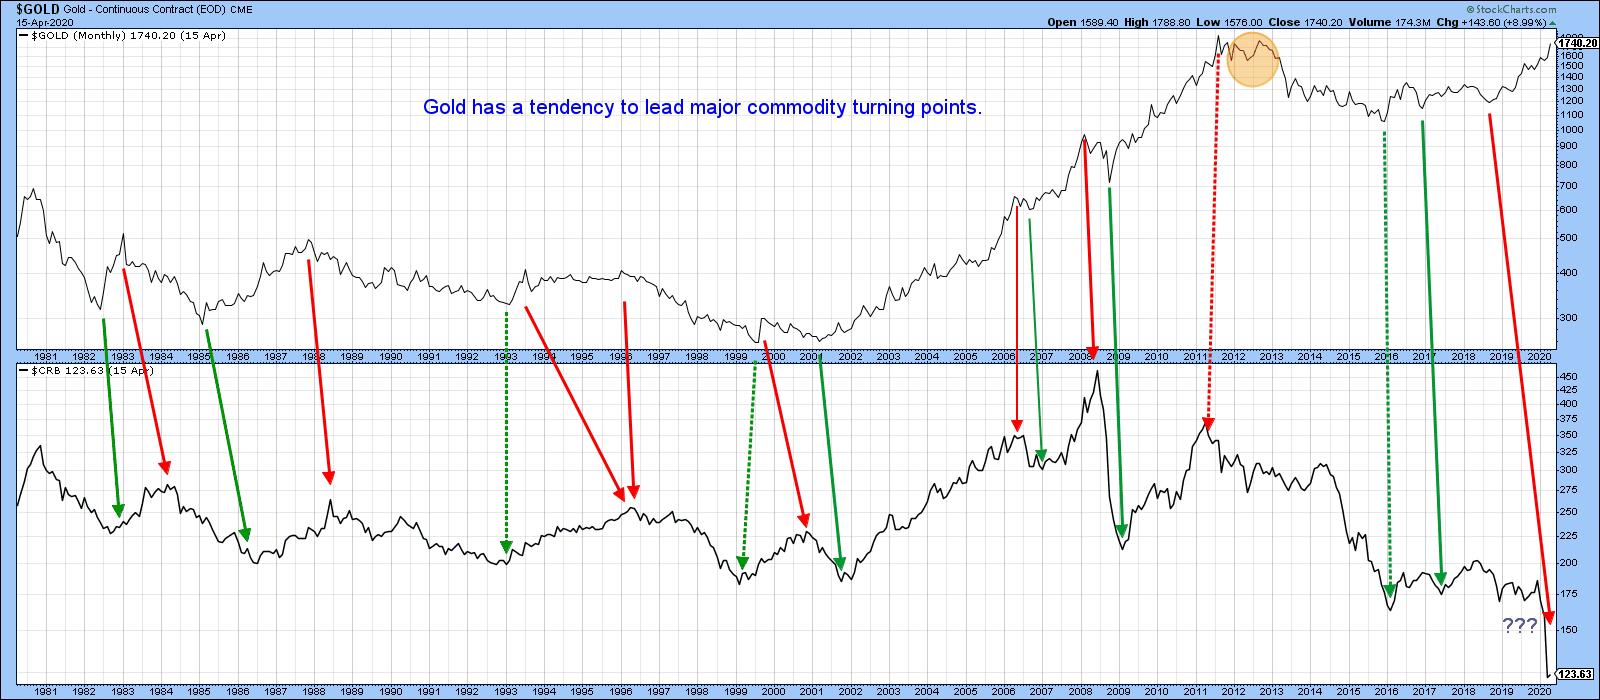
A Rising Gold Market Says It May Soon Be Time to Cover Those Commodity Shorts
by Martin Pring,
President, Pring Research
History tells us that, at major turning points for commodities, there is a strong, albeit imprecise, tendency for the gold price to have preceded that reversal. Gold generally leads because a rising price anticipates inflation, while a falling one anticipates deflation. This idea is represented by the rightward sloping solid...
READ MORE
MEMBERS ONLY
Gold is Breaking to the Upside - What Does That Mean for the Stock Market?
by Martin Pring,
President, Pring Research
Chart 1 shows that last week, based on daily data, the gold price quietly broke out from a reverse head-and-shoulders pattern. It's certainly a little overstretched on a short-term basis and may need to pause for a couple of sessions or so, but the longer-term indicators are pointing...
READ MORE
MEMBERS ONLY
Tuesday's Bearish Key Reversals May Have Trouble Working
by Martin Pring,
President, Pring Research
Whenever a specific technical event is repeated widely in many different stocks, it gets my attention, as it often signals a reversal in the prevailing trend. We call it the principle of commonality. Alternatively, you could think of it as the principle of strength in numbers.
Tuesday's Action...
READ MORE
MEMBERS ONLY
Is It Nineteen Twenty-Nine or Nineteen Eighty-Seven? Which Sectors are Out-Perfoming?
by Martin Pring,
President, Pring Research
In my monthly Intermarket Review this month, I pointed out that, using a 6-week ROC for perspective, the DJIA dropped by 36% on March 20 -before then, there had only been two other instances where the market had fallen by a similar amount from an all-time-high. Based on the DJIA...
READ MORE
MEMBERS ONLY
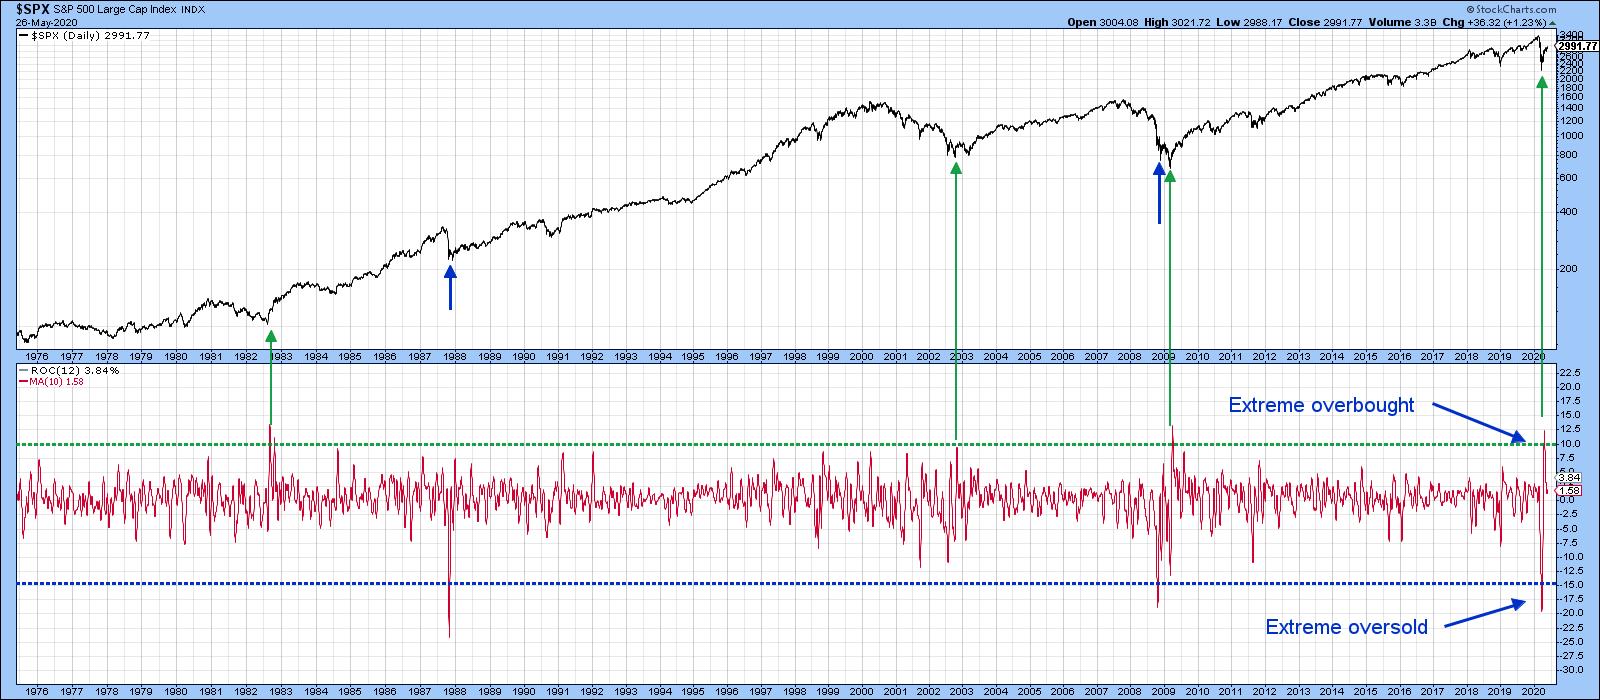
Lots of Short-Term Indicators Reversing from Bearish Extremes - What Does It Mean?
by Martin Pring,
President, Pring Research
I wrote earlier in the week that, whenever the market rallies by 8-9%, it's obvious that some form of bottom has taken place (however fleeting), so I don't want to state the obvious. It is apparent, though, that some of the short-term indicators have finally begun...
READ MORE
MEMBERS ONLY
Lots of Short-Term Indicators Reversing from Bearish Extremes - What Does It Mean? (UPDATED)
by Martin Pring,
President, Pring Research
Editor's Note: This is an expansion of a previous Market Roundup article written on Tuesday, March 24th, now with updated charts and commentary. For the original article, click here.
I wrote earlier in the week that, whenever the market rallies by 8-9%, it's obvious that some...
READ MORE
MEMBERS ONLY
Lots of Short-Term Indicators Reversing from Bearish Extremes - What Does It Mean?
by Martin Pring,
President, Pring Research
* Indicators Start to Flash Buy Signals
* What Happened in the 1929-32 Bear Market?
* Longer-Term Perspective
Whenever the market rallies by 8-9%, it's obvious that some form of bottom has taken place (however fleeting), so I don't want to state the obvious. It is apparent, though, that...
READ MORE