MEMBERS ONLY
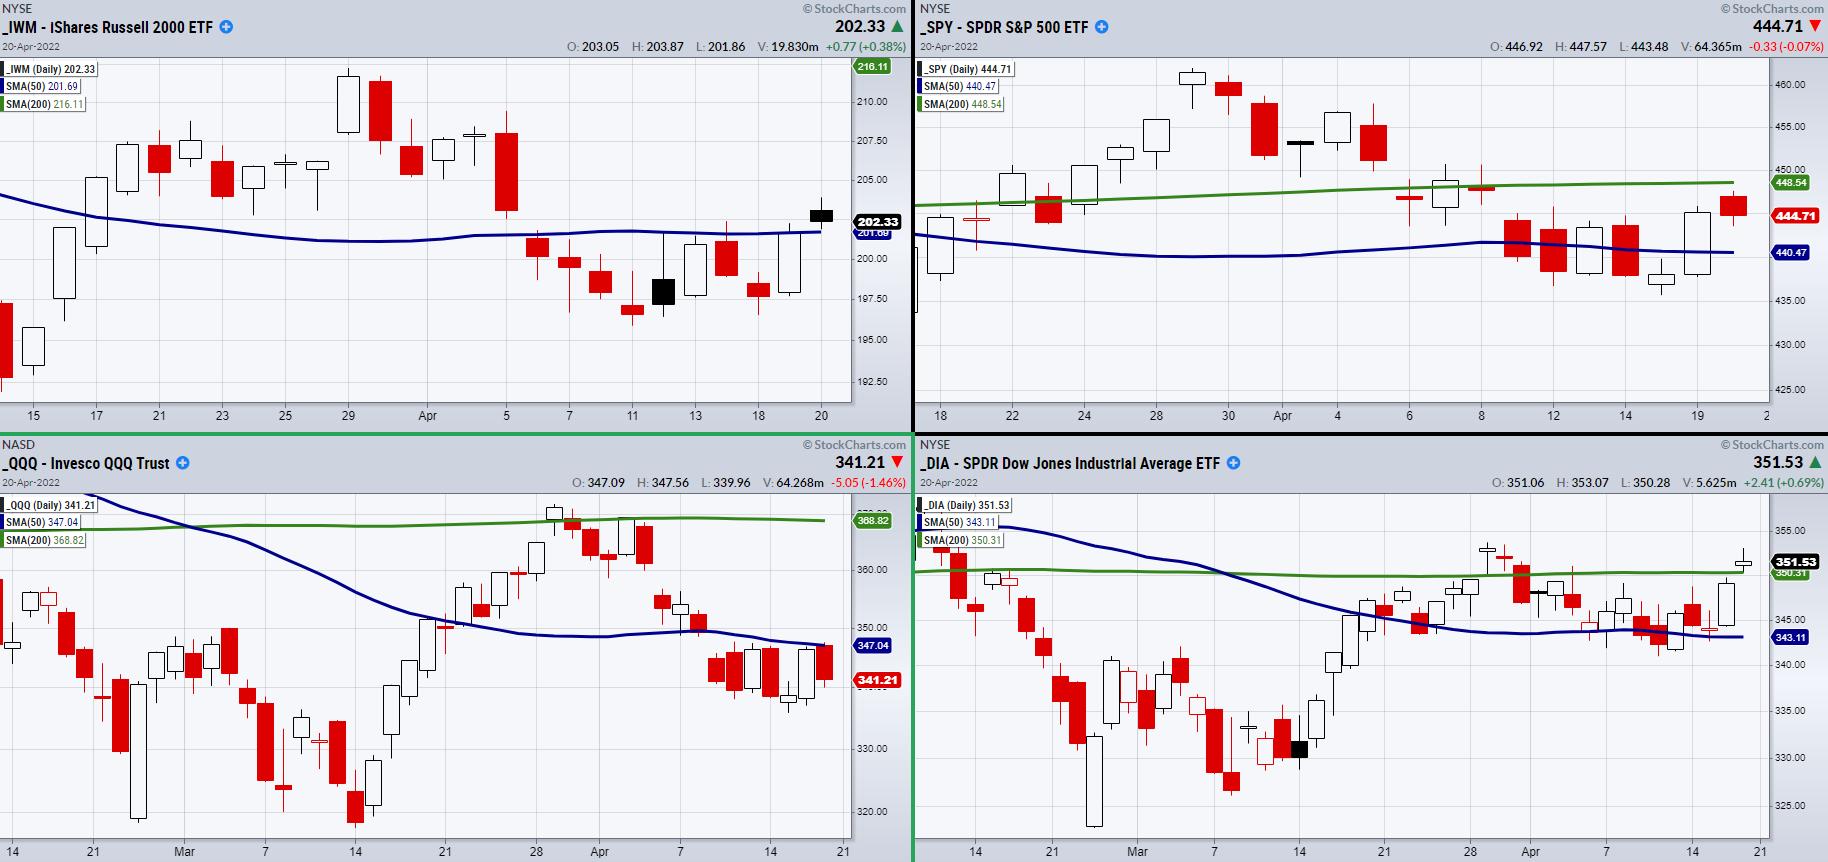
Does the Nasdaq 100 Index Have a Chokehold on the Stock Market?
On Wednesday, the stock market stuck with its choppy trend.
After Tuesday's rally into resistance, we watched for either a reversal to the downside or a potential break to the upside as momentum had grown since last week. However, the market tends to play out differently than expected,...
READ MORE
MEMBERS ONLY
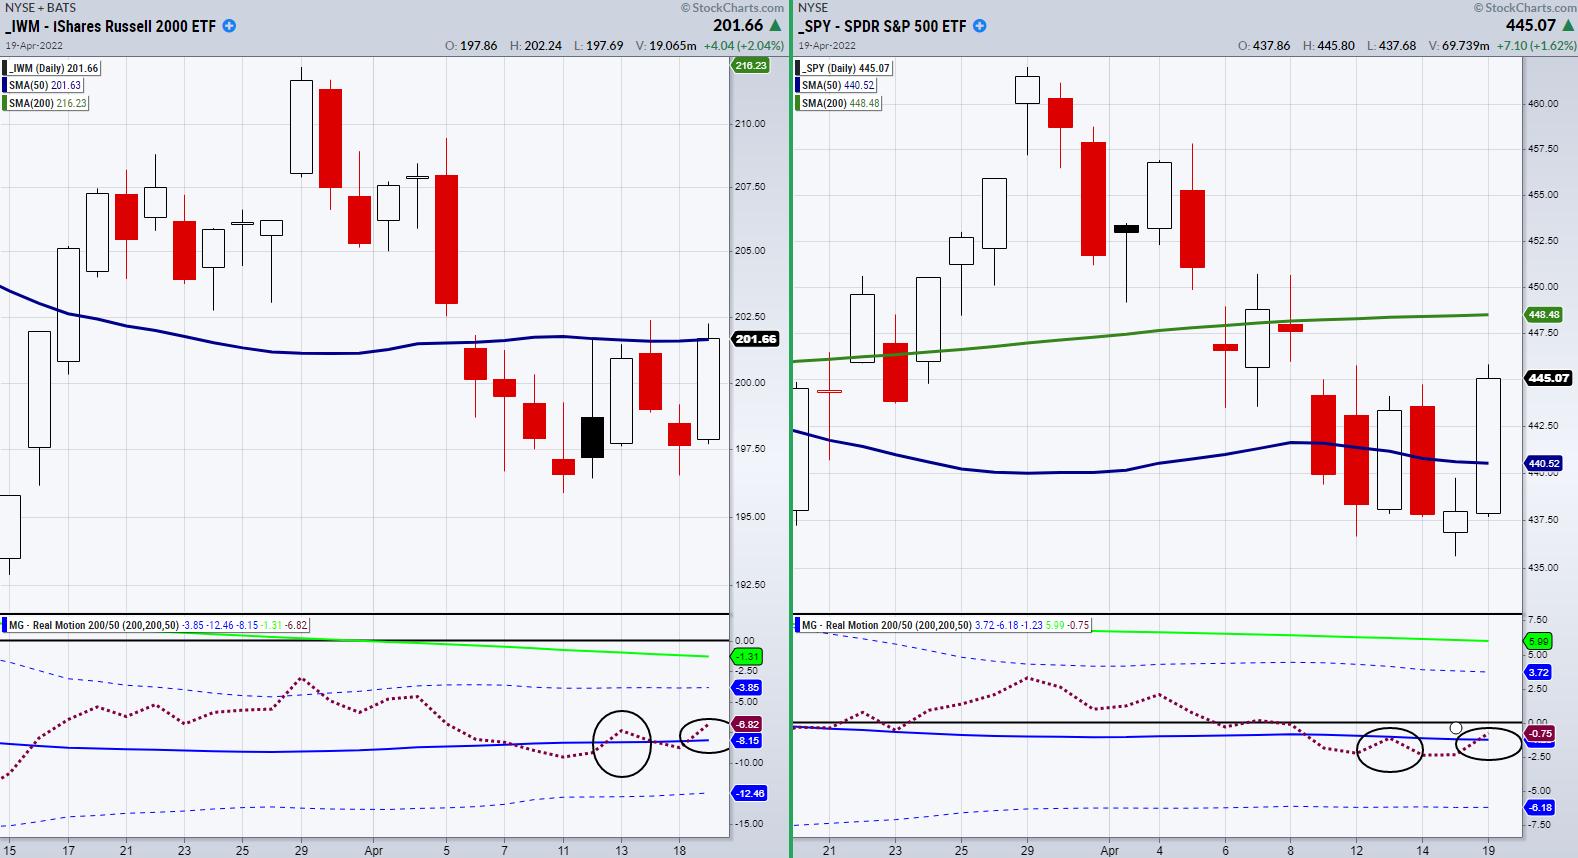
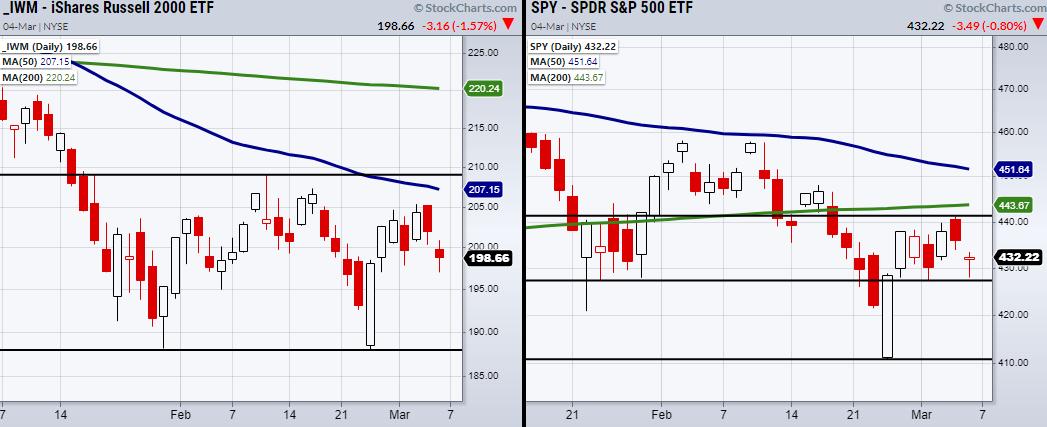
Real Motion Shows Hidden Momentum in the Russell 2000 and S&P 500
On Tuesday, the stock market rallied right into resistance from its major moving average; however, this time could be different. While the market is choppy and traders should be extra careful, if Wednesday shows follow-through in both price and momentum, we can watch for Tuesday's rally to continue....
READ MORE
MEMBERS ONLY

Why We are Watching Wells Fargo (WFC) and National Bank Holdings (NBHC)
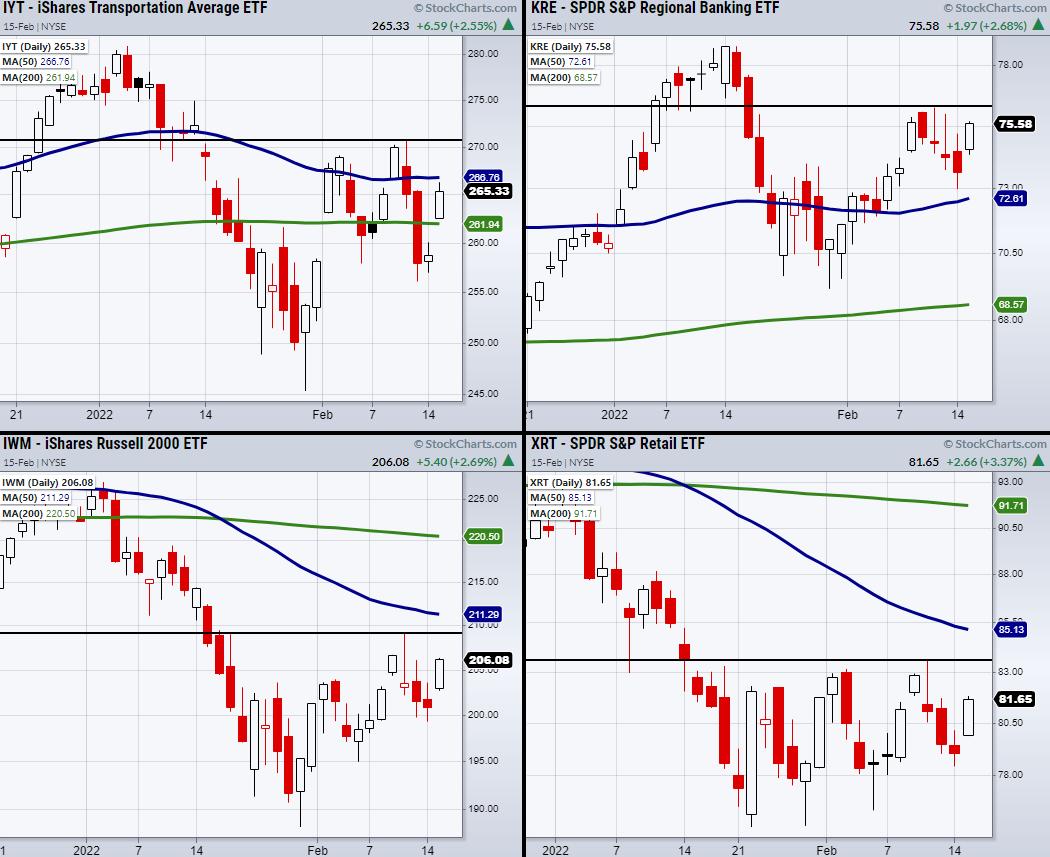
Earnings season is upon us and the banks have been kicking it off. However, the kickoff has been weak, as seen in the above chart of the regional banking ETF (KRE).
With that said, if KRE can clear and hold over its 10-day moving average on both price and our...
READ MORE
MEMBERS ONLY
Is the Stock Market Setting a Trap?
For the past two weeks, the market has been trending lower. With certain sectors sitting in oversold territory, we could be ready for a pop-up in price. However, this is a tricky spot, since a rally would be right into a resistance area.
As seen in the above chart, two...
READ MORE
MEMBERS ONLY

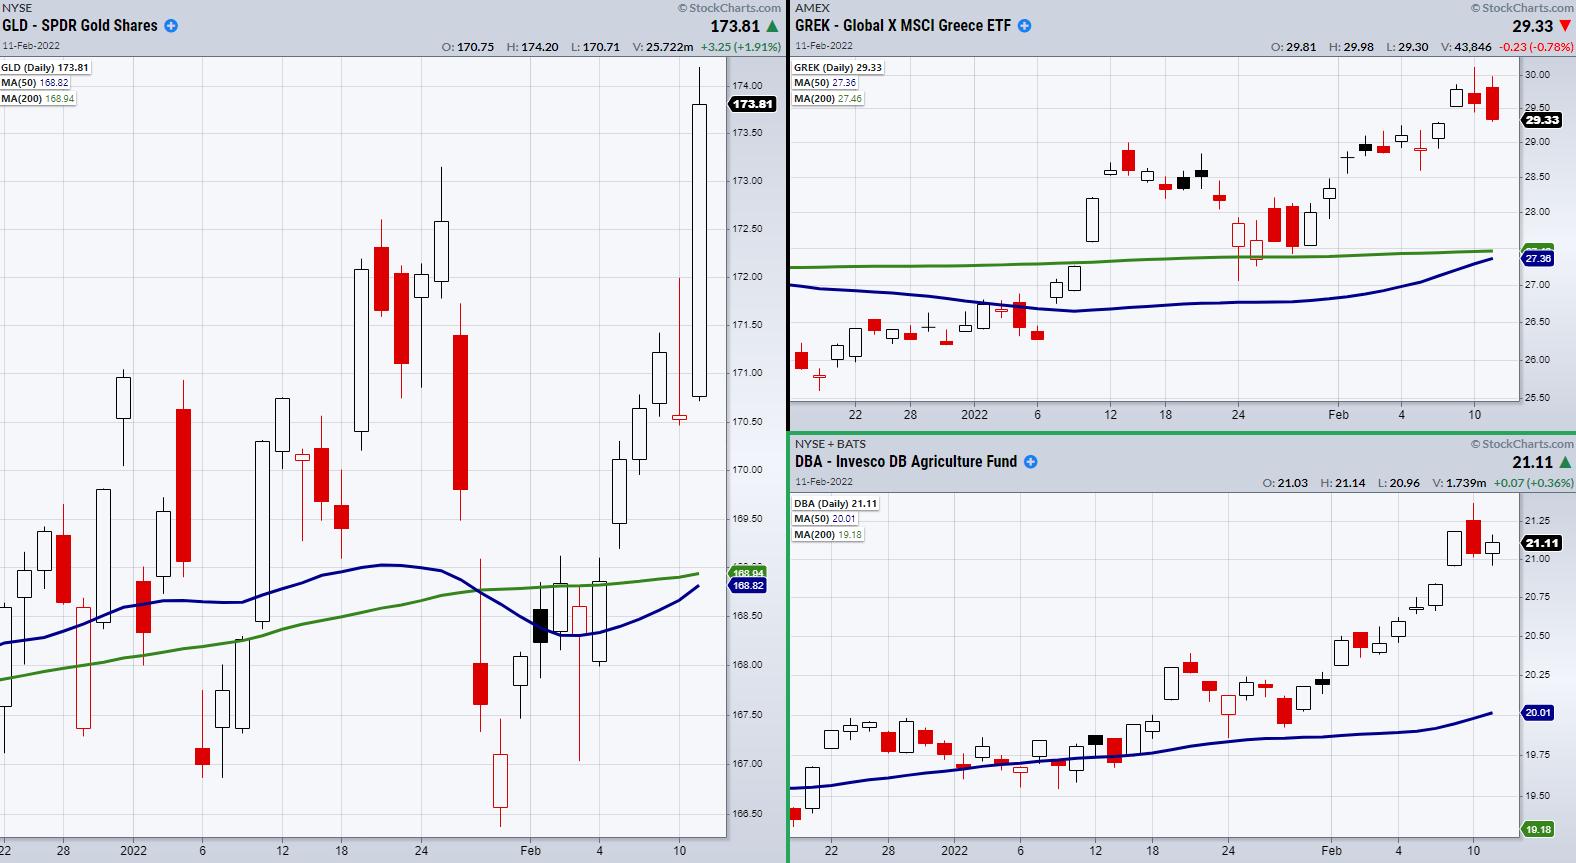
Why We Bought Invesco Agricultural Fund (DBA)
Last Friday, we bought the Invesco Agricultural Fund based on a breakout from a consolidation area. With inflation continuing higher, we see food prices joining for the ride.
One problem with soft commodities is that, when countries need more food, there is no instant fix, as it takes time to...
READ MORE
MEMBERS ONLY

Bitcoin Scare Tactics and Where It Needs to Hold
As of writing this article, Bitcoin is trading just under 40k. It has failed 3 key points and now people are getting scared. With that said, is this just a quick spook before it gets back on track, or should people give Bitcoin more caution?
In the above chart, there...
READ MORE
MEMBERS ONLY

How to Watch for Countertrend Trades Using the Russell 2000 (IWM)
Recently, we have focused on the Russell 2000 (IWM) small-cap index. Since IWM shows a large variety of companies, it gives a great picture of where the overall market is trading and where it could go next.
With that said, paired with our indicators, IWM gives us an edge when...
READ MORE
MEMBERS ONLY
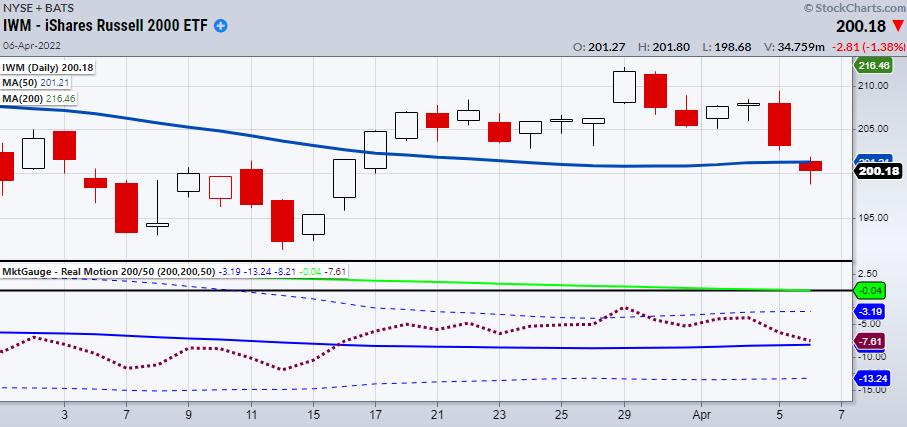
Keep Eyes on Momentum in the Small-Cap Index and the Biotech Space
On Wednesday, the Russell 2000 (IWM) made a divergence in price and our momentum indicator Real Motion (RM). In the above chart, we can see that, while the price has broken underneath the 50-day moving average (blue line), it has yet to break the 50-day moving average in Real Motion...
READ MORE
MEMBERS ONLY
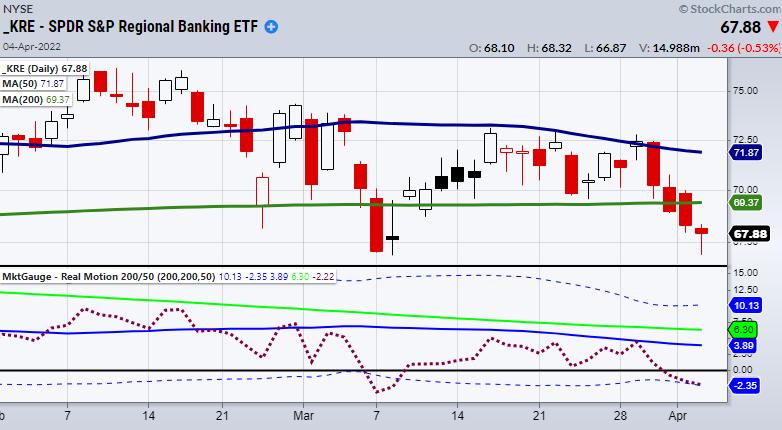
Regional Banking (KRE) Holds onto Support and Momentum
Last Friday, the Regional Banking Sector ETF (KRE) closed underneath its 200-day moving average. This can be seen in the above chart, with the green line showing the 200-DMA.
However, while this was a key area to hold, KRE has now dipped into a support area illustrated by the black...
READ MORE
MEMBERS ONLY

If the Market Holds, Watch Bitcoin and the Biotech Space
The past week was a chop fest in the major indices, with large intraday price swings. While the 3 major indices closed roughly flat on Friday, the Russell 2000 (IWM) made a late-day turnaround, ending up over 0.8% on the day. Although IWM closed under its pivotal $209 level,...
READ MORE
MEMBERS ONLY

Has the Small-Cap Index (IWM) Tricked Us?
Recently, we talked about the volatility fund standing its ground in price. While the market has been trending higher, the short-term volatility fund S&P 500 VIX (VXX) was able to stay mostly over its 200-day moving average near 24. Then, on Tuesday, many commodities rallied into the close....
READ MORE
MEMBERS ONLY
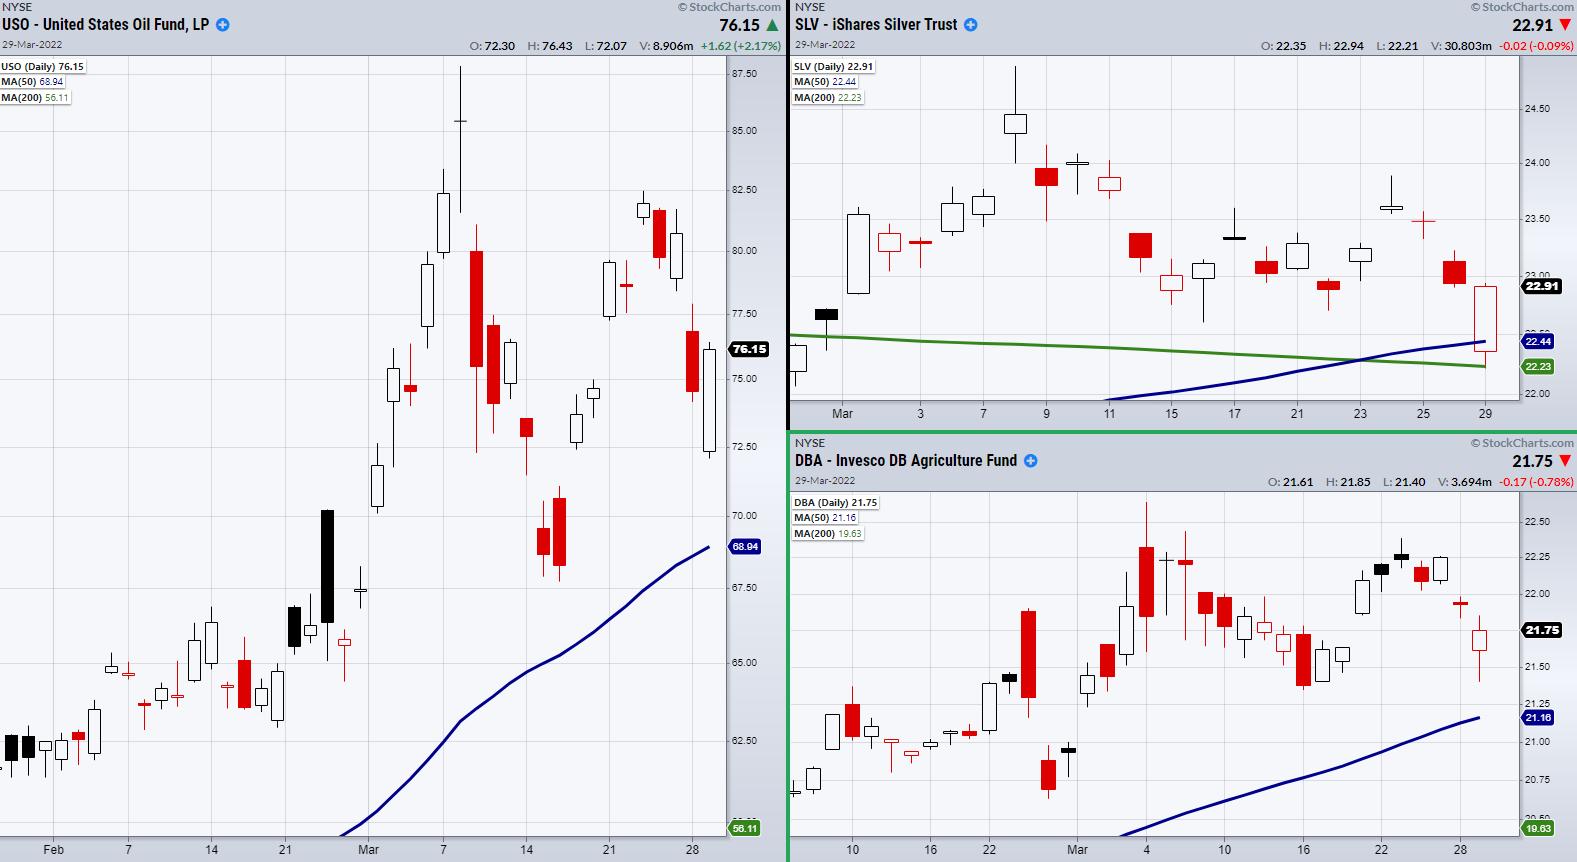
Commodities Make a Quick Turnaround!
On Tuesday, many commodity ETFs gapped lower while the major indices gapped up. Additionally, the Russell 2000 (IWM) finally cleared its pivotal price level at $209. However, while the indices made a nice close on the day, ETFs such as Oil (USO), Agricultural Fund (DBA), and Silver (SLV) regained a...
READ MORE
MEMBERS ONLY
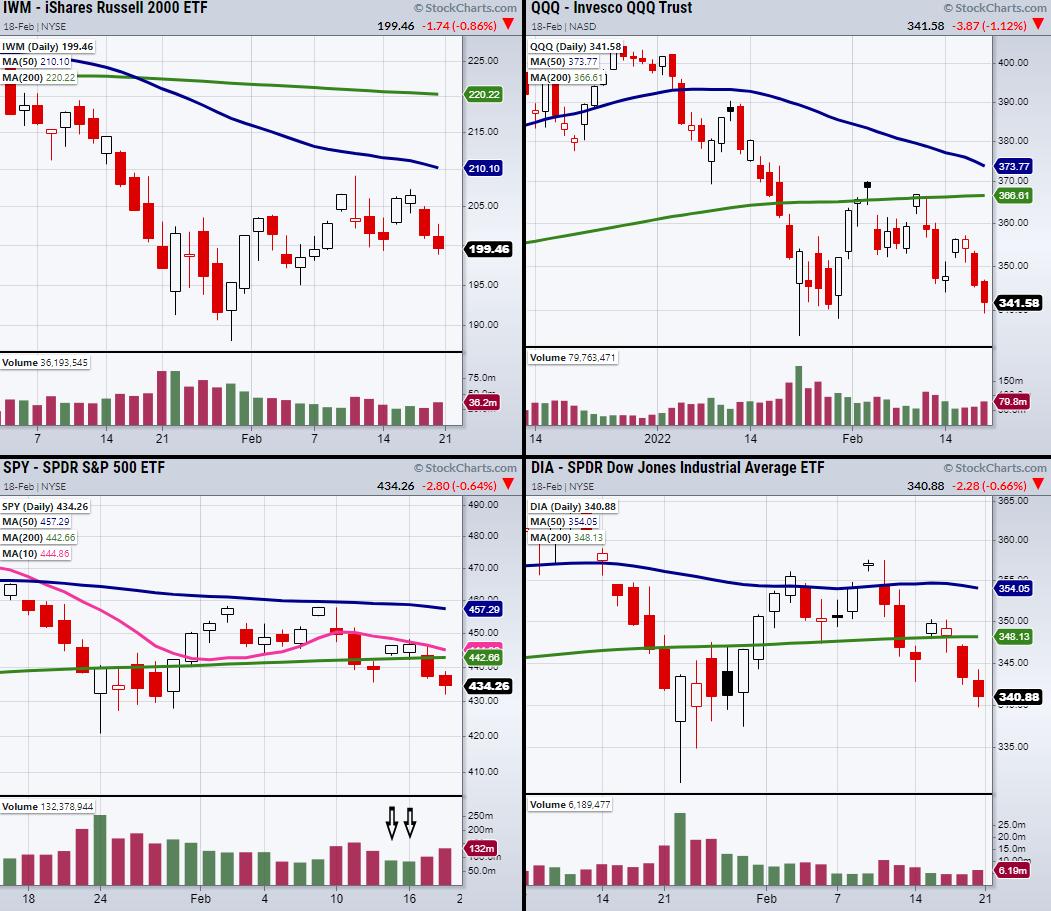
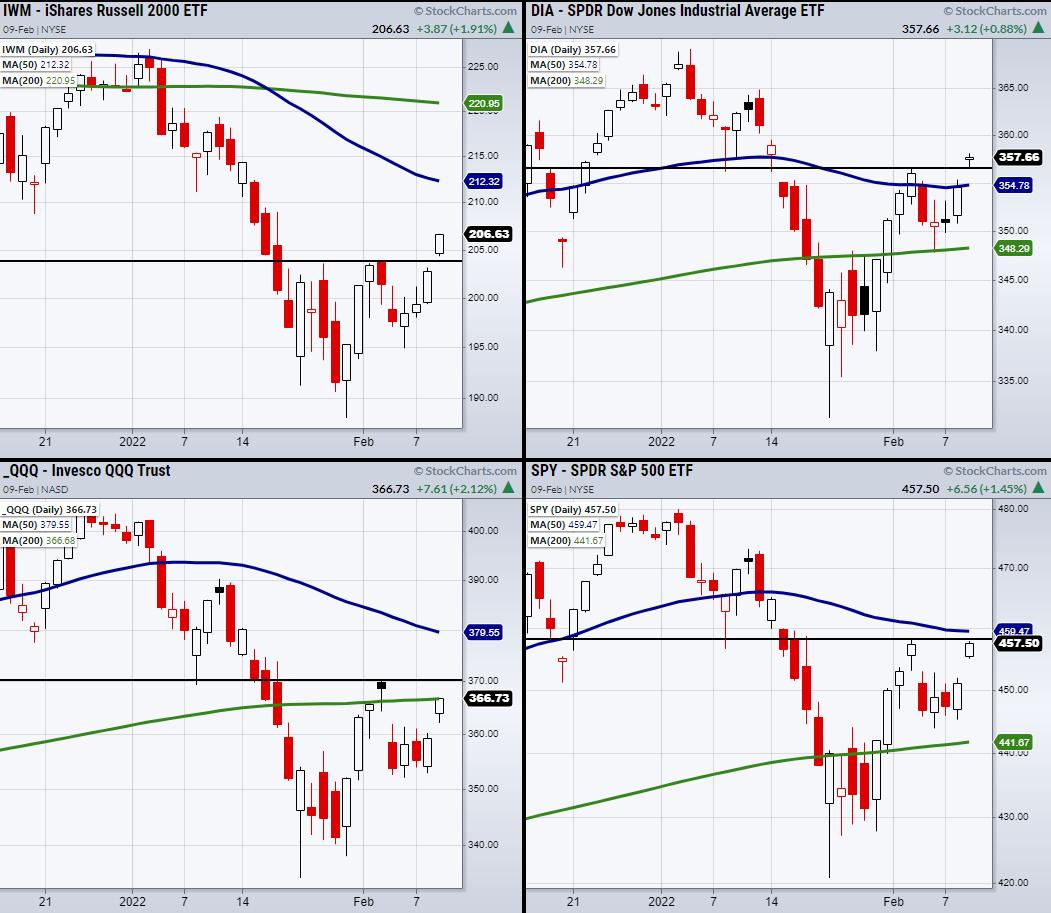
S&P 500 (SPY) Leads a Mixed Market Higher
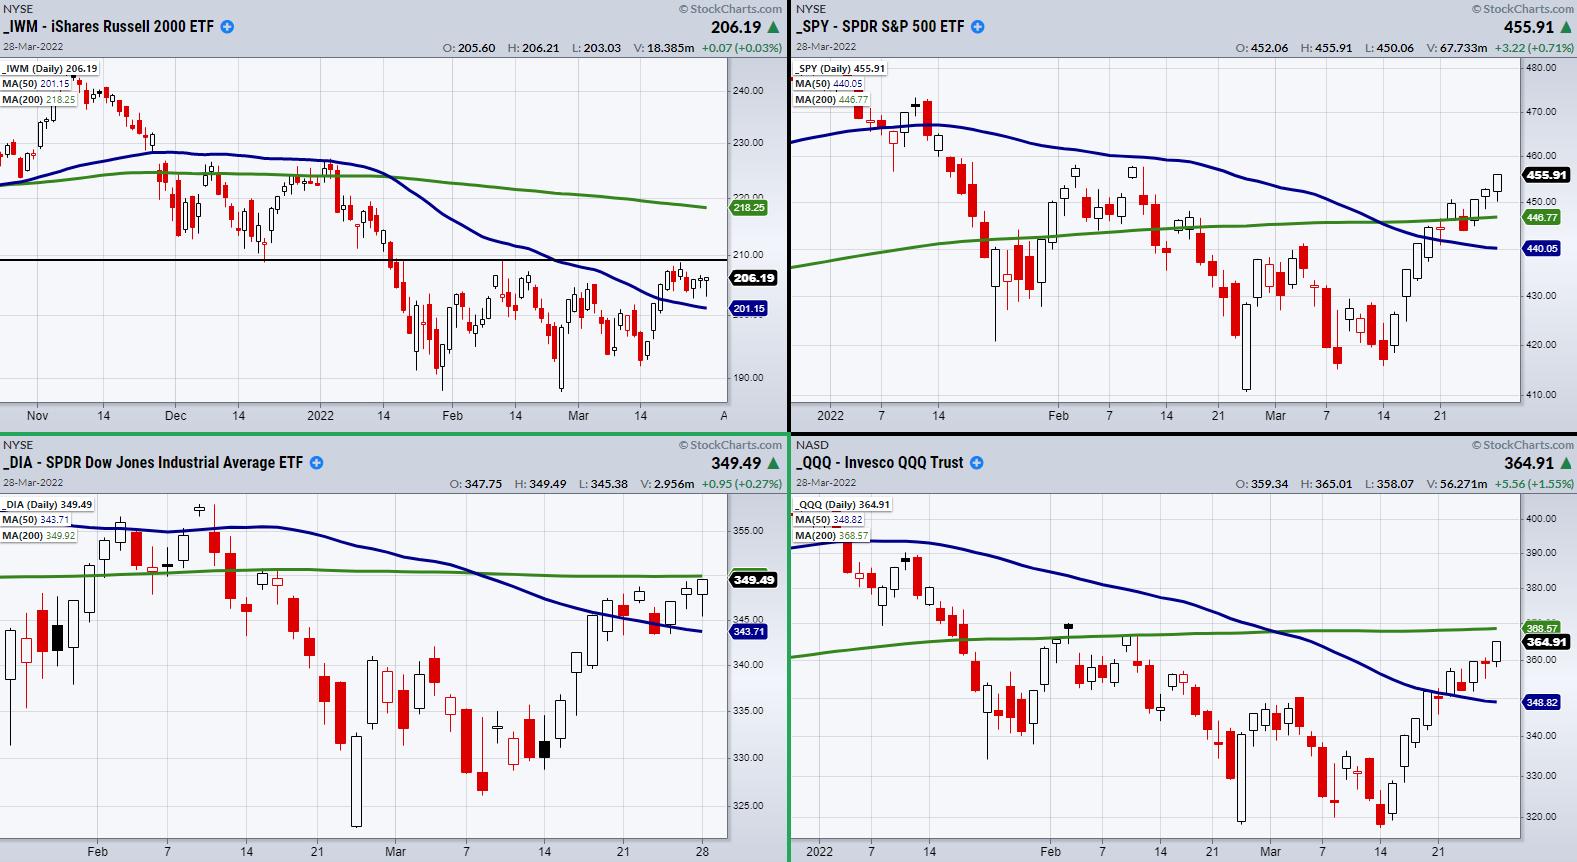
The S&P 500 (SPY) and the Nasdaq 100 (QQQ) continue to trek upwards, along with the Dow Jones (DIA). While the DIA and QQQ still need to clear their 200-DMA, the 4th major index is flashing a warning sign.
When watching the major index, it is always important...
READ MORE
MEMBERS ONLY
Two Trade Ideas Along with Key Levels for the Stock Market to Hold
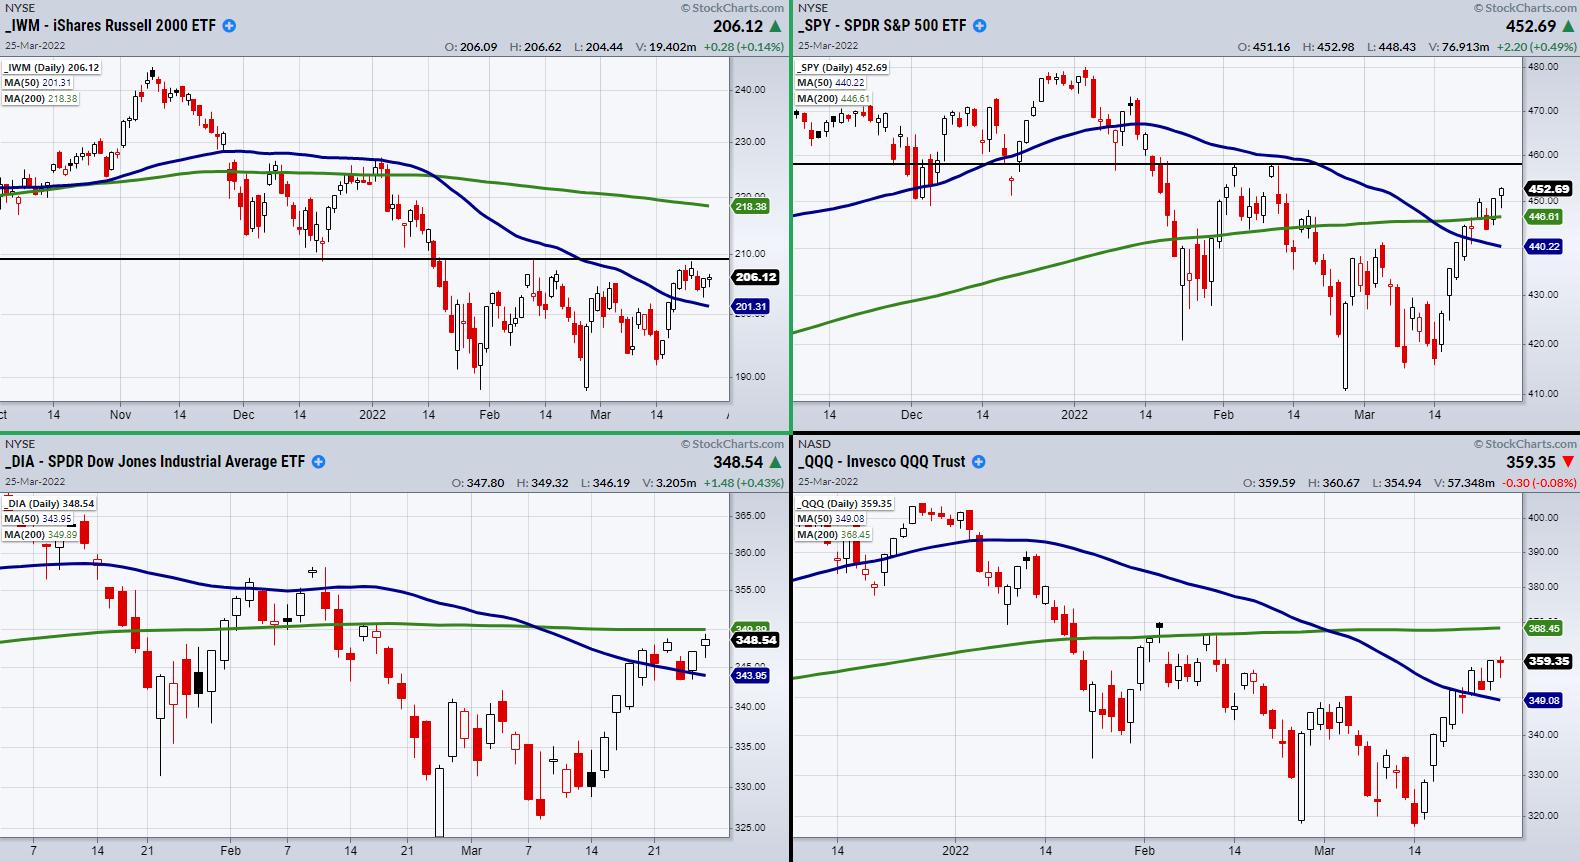
Although we've had a choppy week in the market, key areas held in the major indices, showing upside potential for Monday. Currently, the main support levels are near the 50-day moving average (blue line) in the Dow Jones (DIA), Russell 2000 (IWM), Nasdaq 100 (QQQ) and the S&...
READ MORE
MEMBERS ONLY
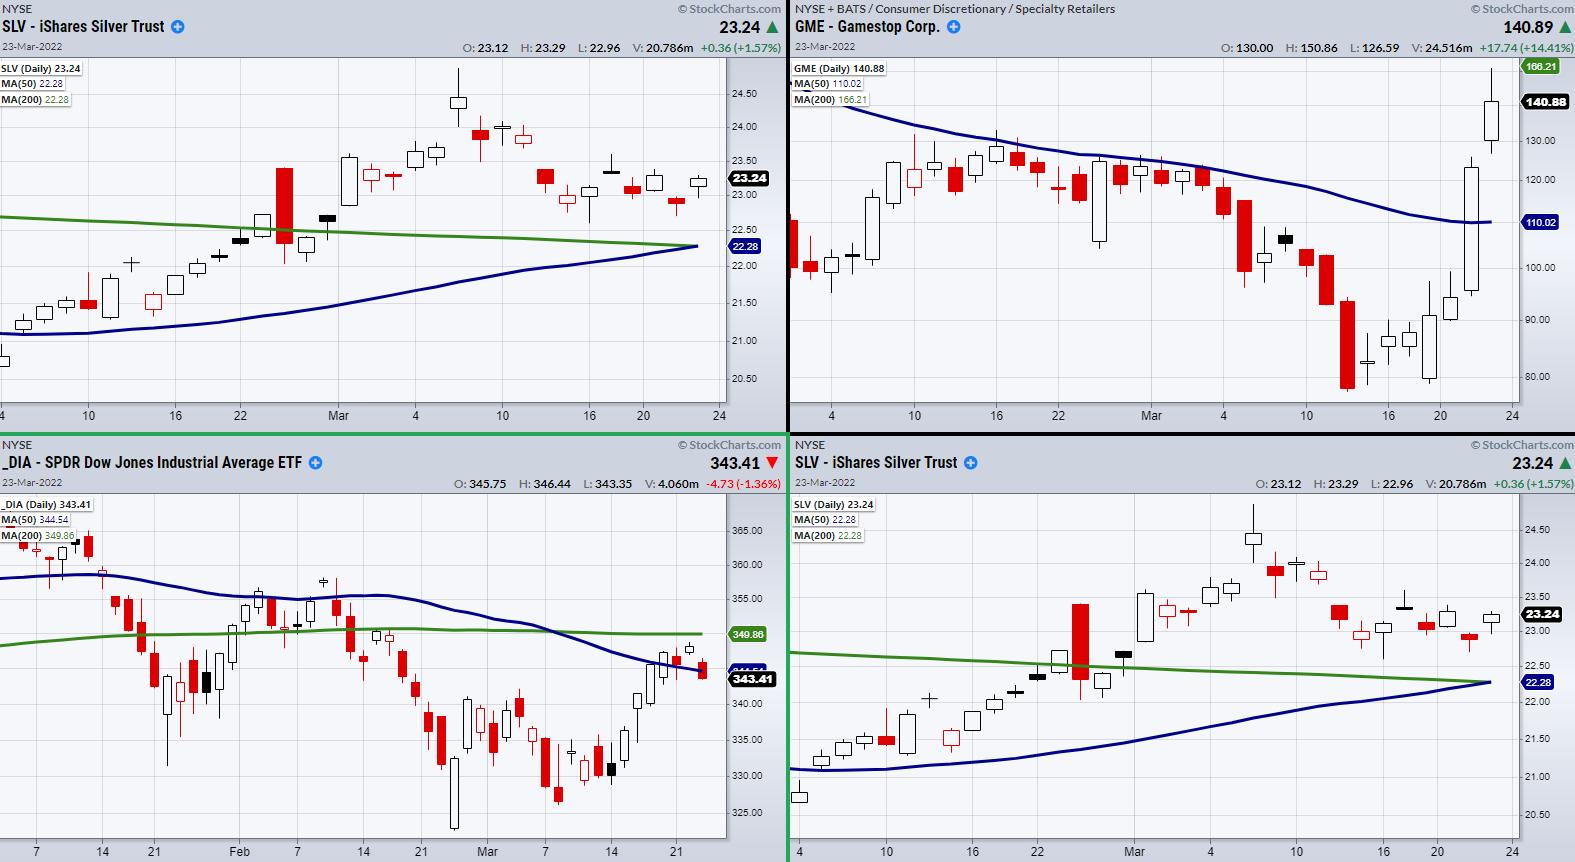
Can Silver (SLV) Follow Meme Stocks Higher?
Though it's easy to forget about meme stocks, as they've been out of focus for a while, the big two have made a comeback over their 50-day moving average.
GameStop (GME) and AMC Theatres (AMC), as seen in the above chart, cleared their 50-DMA on Tuesday...
READ MORE
MEMBERS ONLY
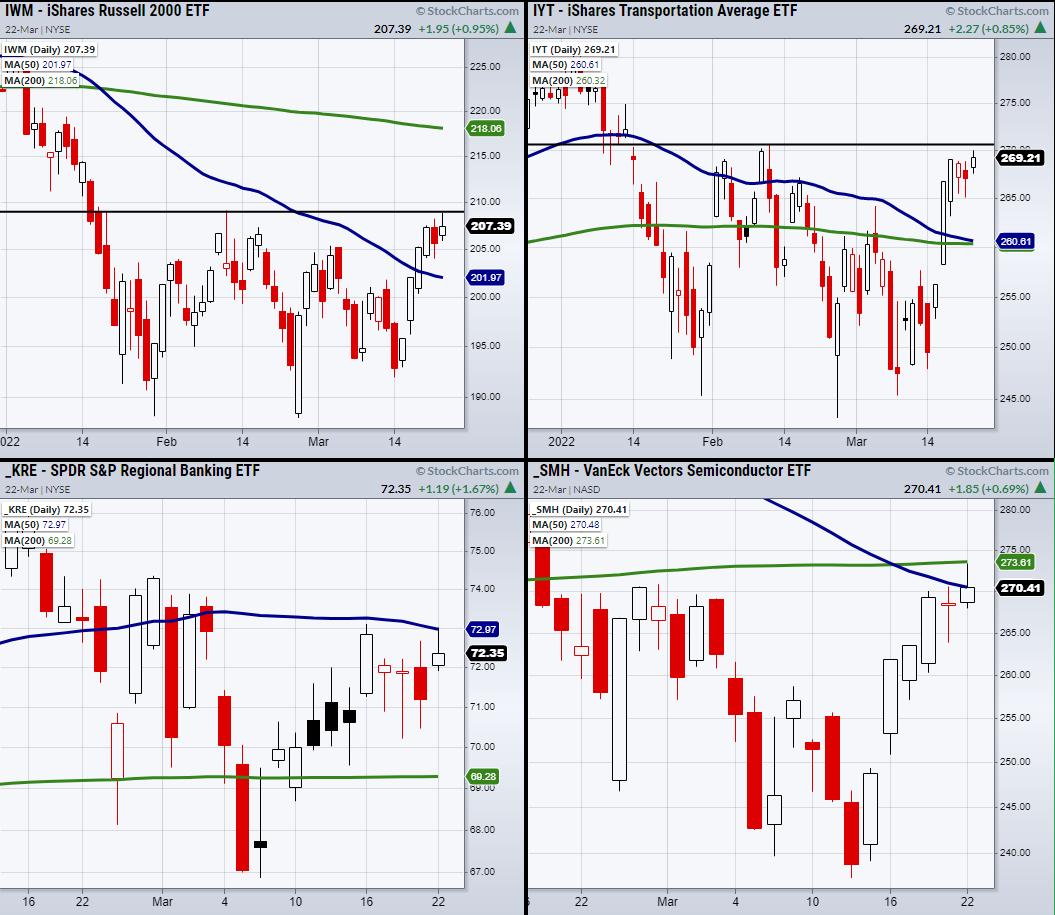
Mish's Economic Modern Family Needs to Clear Resistance
We have and continue to use Mish's Economic Modern Family to successfully navigate through the pandemic and now, in 2022, we use its insights to guide us through a year that has three main overhead pressures: geopolitical stress from the current Russian/Ukraine war, inflation and, finally, rising...
READ MORE
MEMBERS ONLY

Mish: The Best Potential Trade Setup Looking Ahead - FXE Euro Trust
As Forrest typically writes the Daily commentary, and quite well I might add, today please consider me a guest host to my own blog. As such, I want to wrote about a setup that is not quite ready, but one that should be kept on your radar.
The Euro is...
READ MORE
MEMBERS ONLY
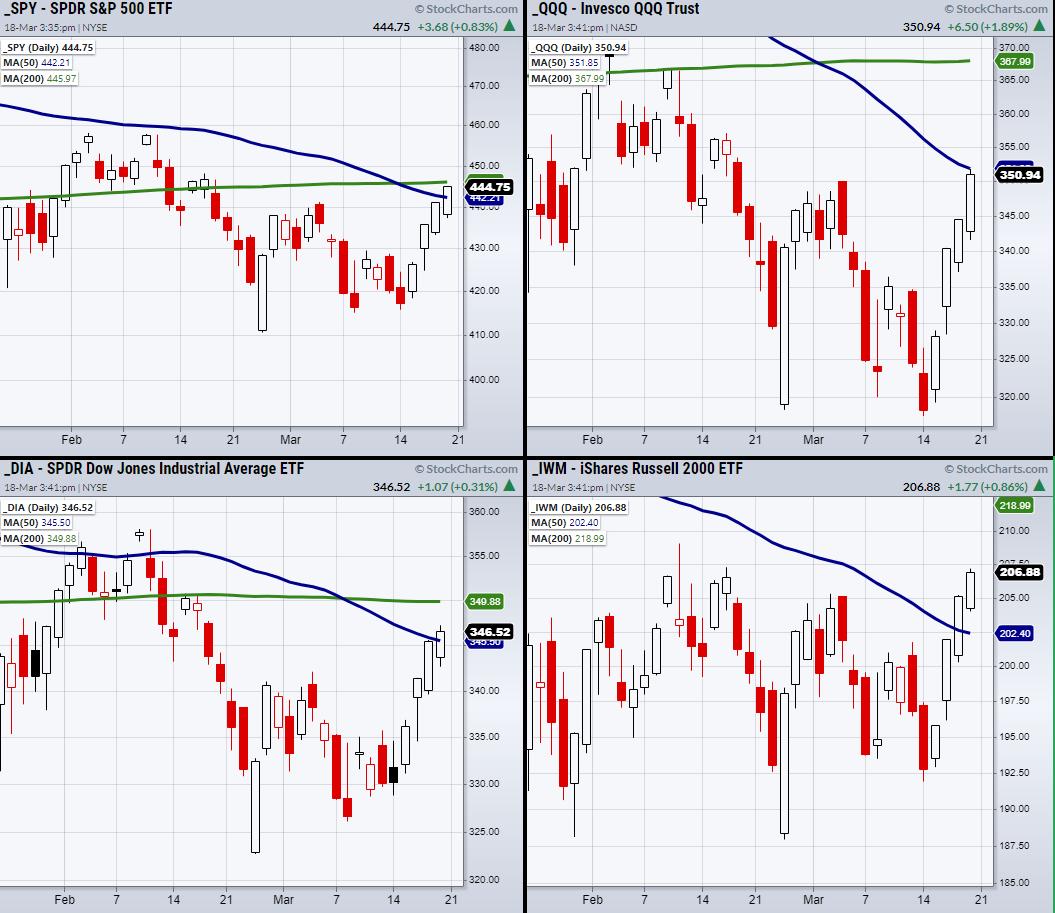
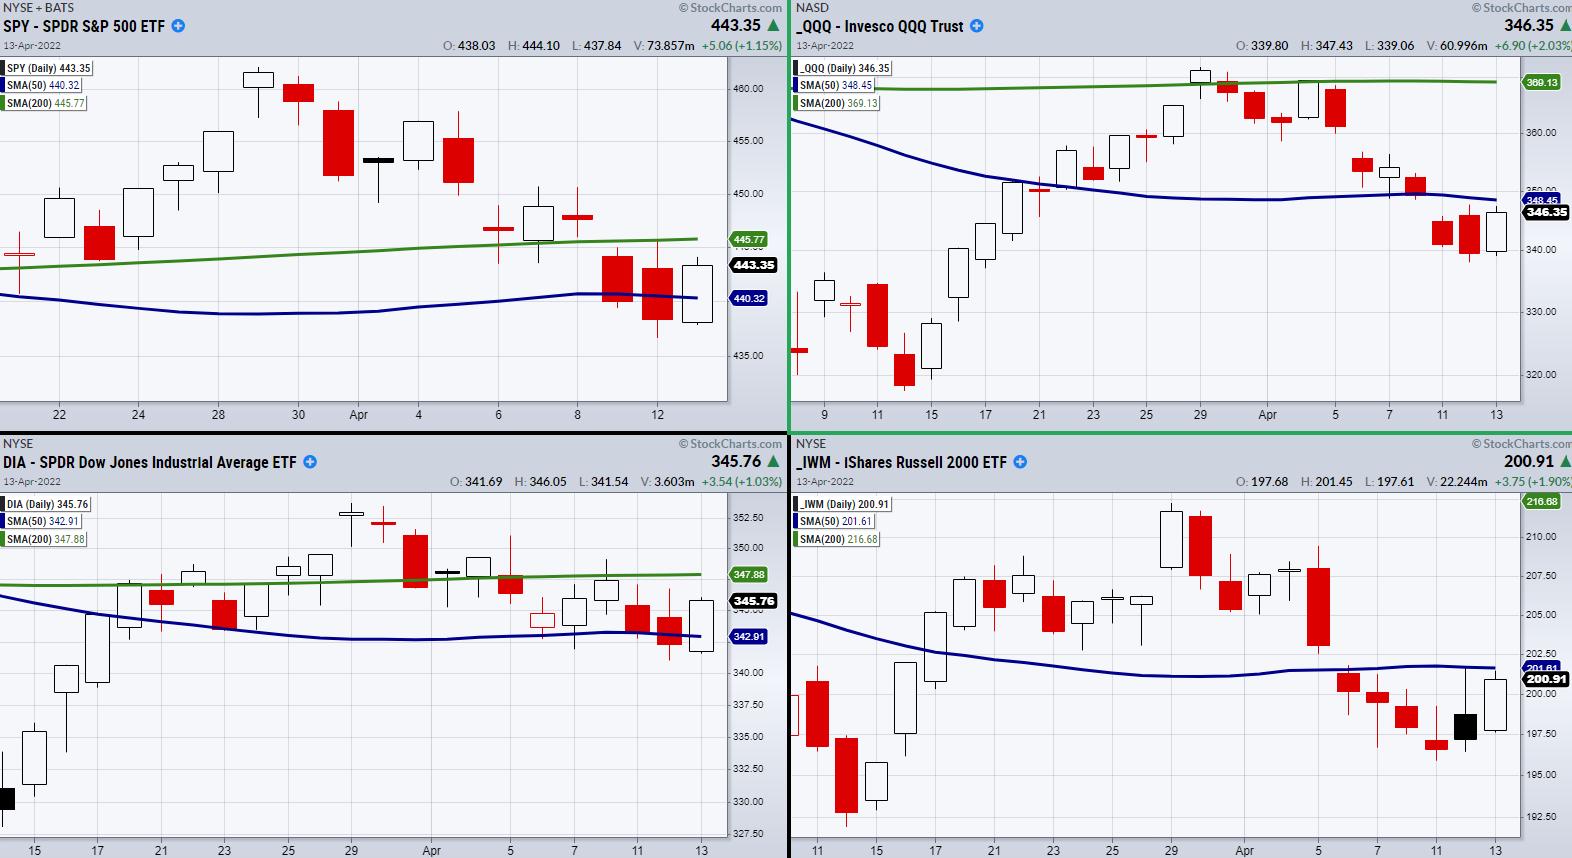
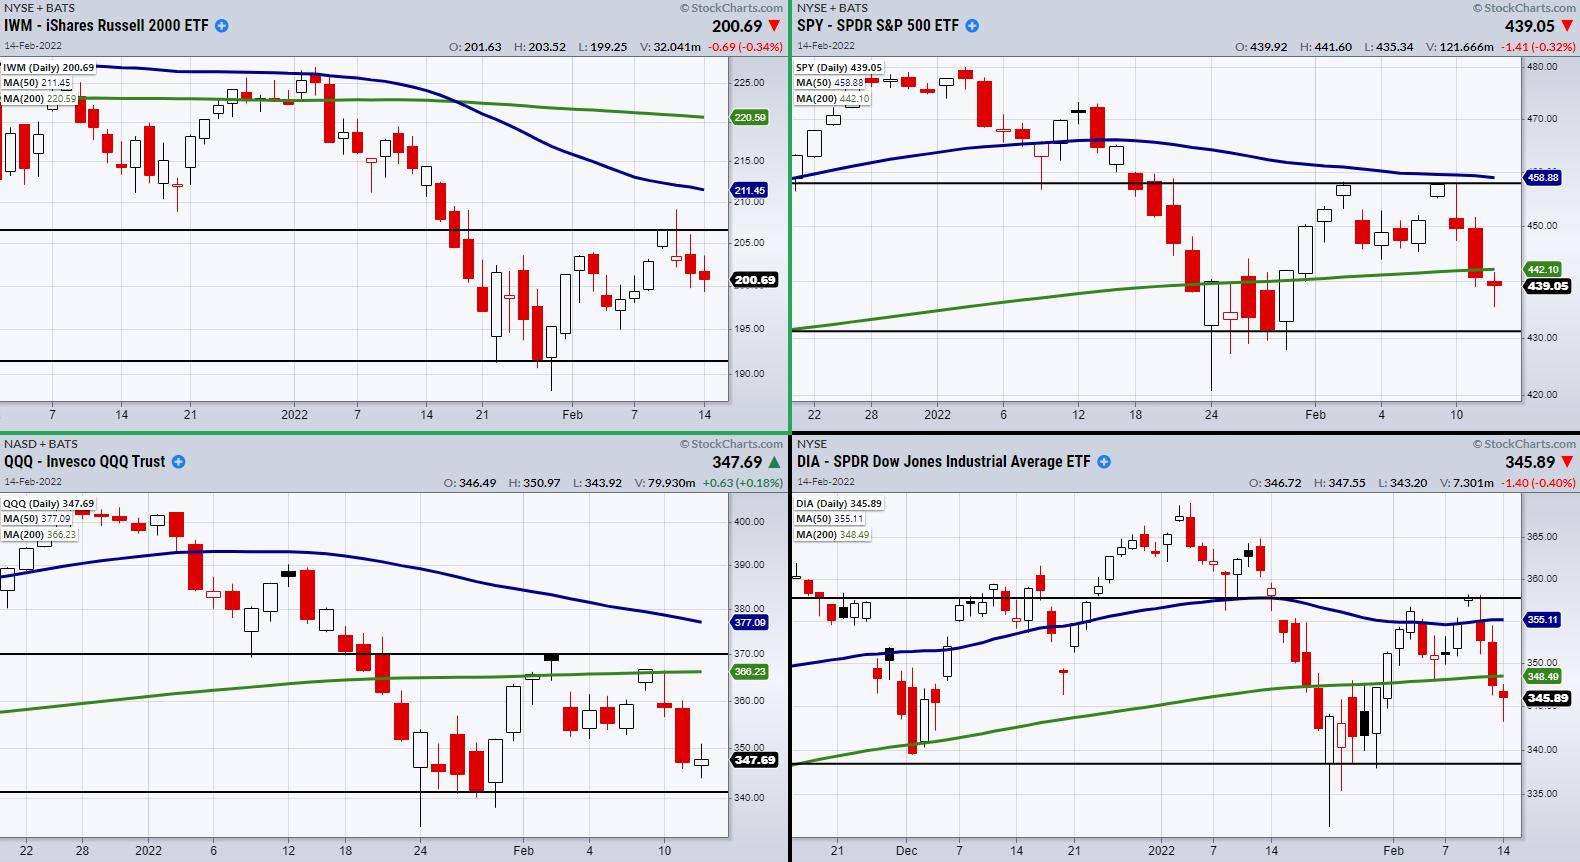
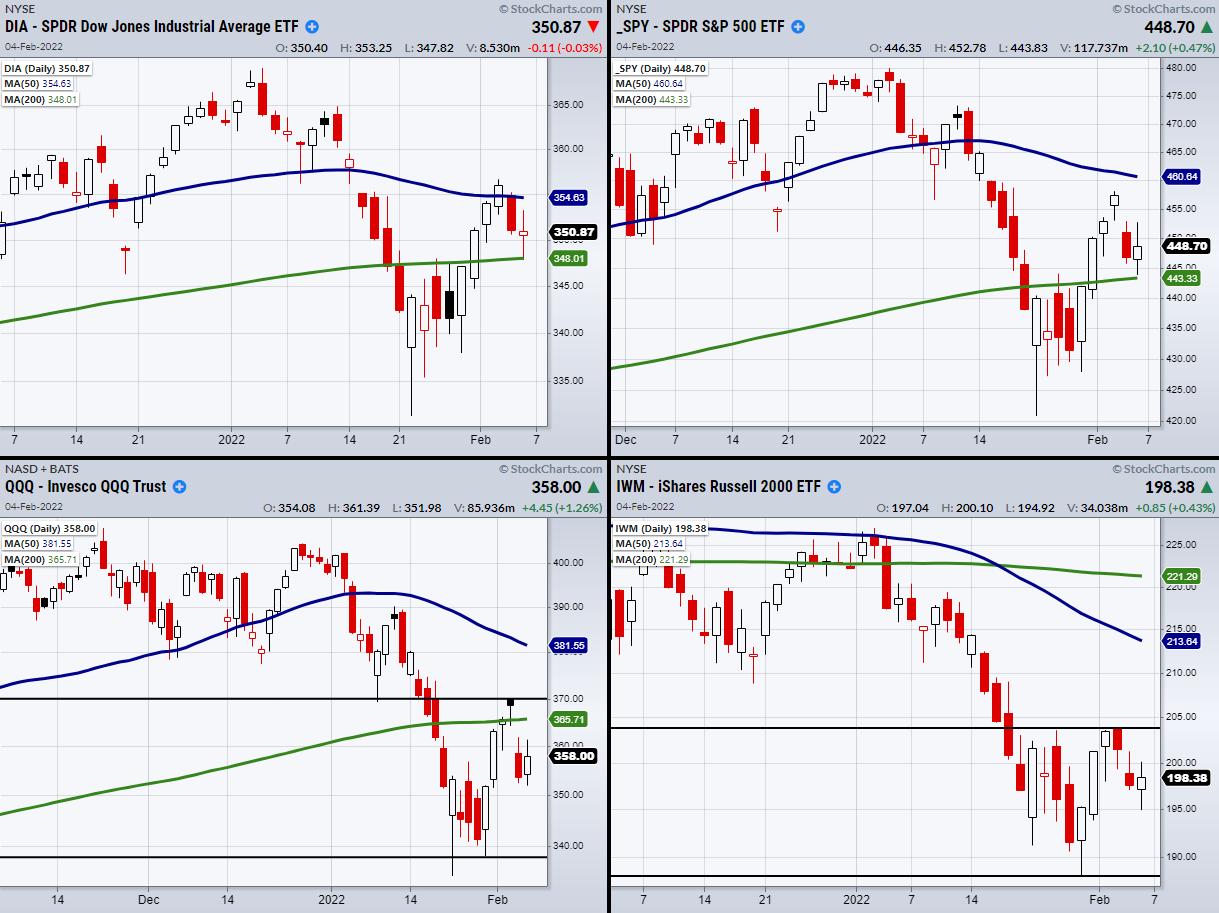
The 50-Day Moving Average Must Hold in the Major Indices
After the quarter-percent rate increase, the market continues to rally off recent lows. Now, all the major indices besides the Nasdaq 100 (QQQ) have cleared resistance from their 50-day moving average as seen in the above chart. So far, the Russell 2000 (IWM) is leading the way with a second...
READ MORE
MEMBERS ONLY
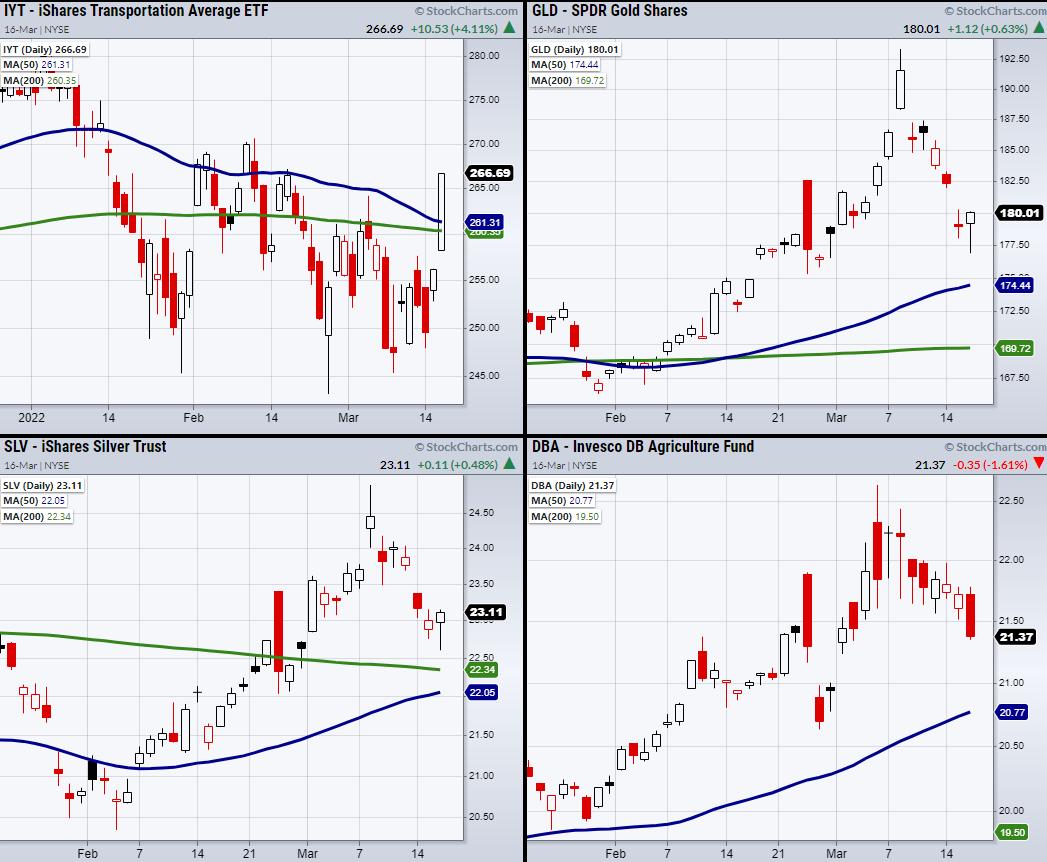
Rates Increase and Transportation (IYT) Clears Its Major Moving Averages
On Wednesday, the market rallied into the Fed's rate announcement, showing speculator's optimism given the current downward trend. It also helped that, on Monday, the Nasdaq 100 (QQQ) held key support at $318, sparking a rally on Tuesday.
Now, with a rate increase of 0.25%...
READ MORE
MEMBERS ONLY

Reaching the Breaking Point in the Nasdaq 100 (QQQ)
The overall trend in the major indices is downward. Though we've had small rallies, our last jump in price was minor and right into resistance. Specifically looking at the QQQs, we have reached a key support level in which many traders are watching for a price break. However,...
READ MORE
MEMBERS ONLY
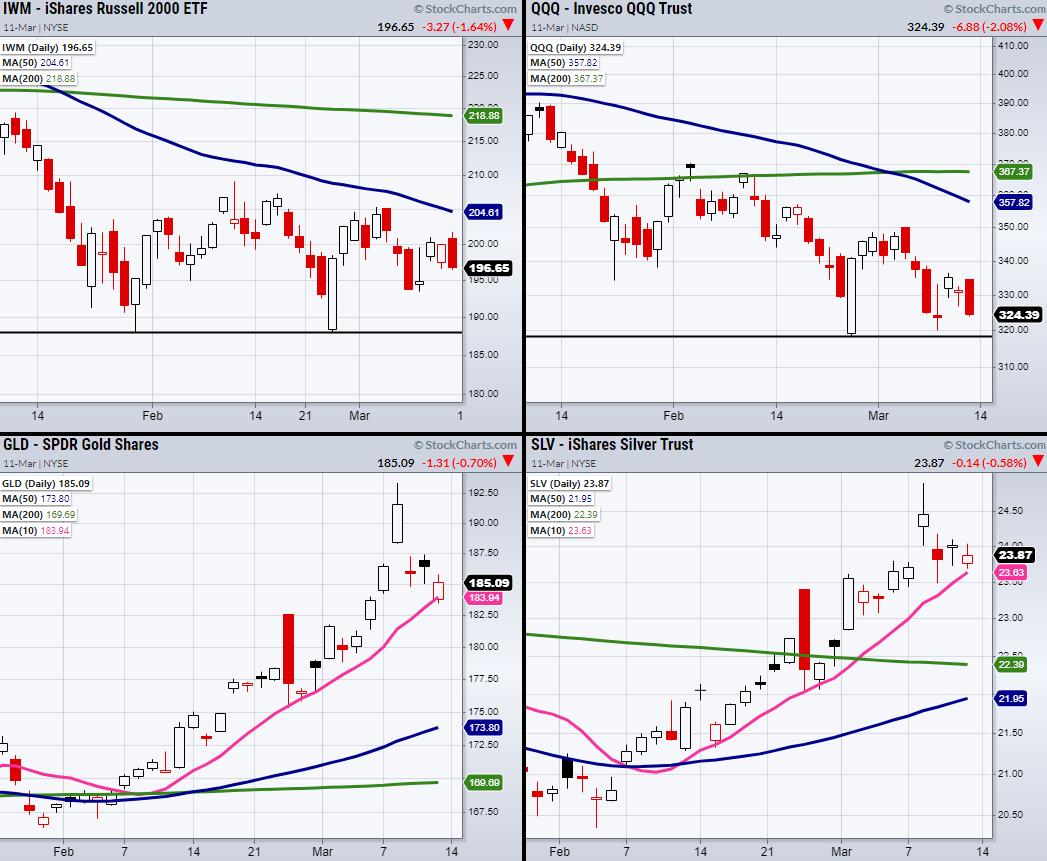
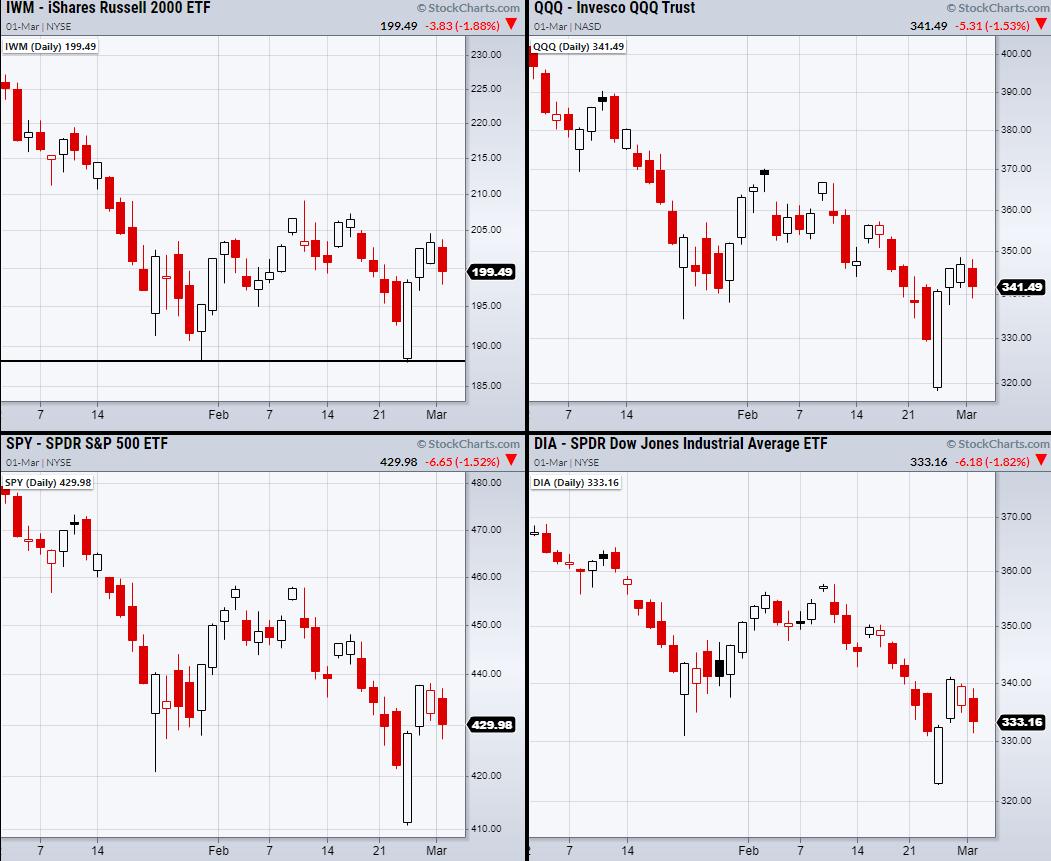
Strength in Commodities Ends the Week
Major indices end on a weak note, with the Russell 2000 (IWM) and the Nasdaq 100 (QQQ) closing down 1.5%. With that said, gold (GLD) and silver (SLV), while down half a percent, are holding a strong uptrend over their 10-day moving average. Soft commodities are also sitting in...
READ MORE
MEMBERS ONLY
Oil Drops and the Russell 2000 (IWM) Rallies Towards Resistance
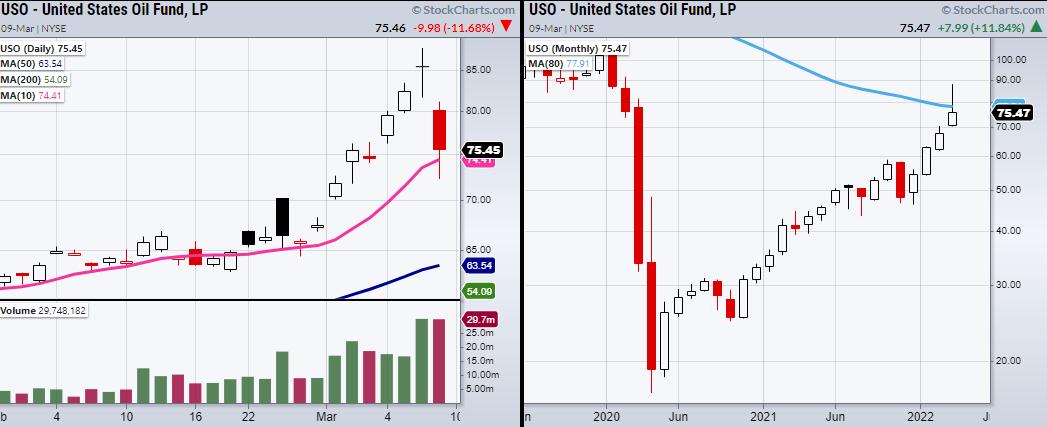
Oil is making a reversal pattern and rejecting its 80-month moving average; however, will the overall trend stay intact, or has Wednesday signified an end to the crazy oil rally?
Looking at the above chart of the United States Oil Fund (USO), we can see a large amount of volume...
READ MORE
MEMBERS ONLY
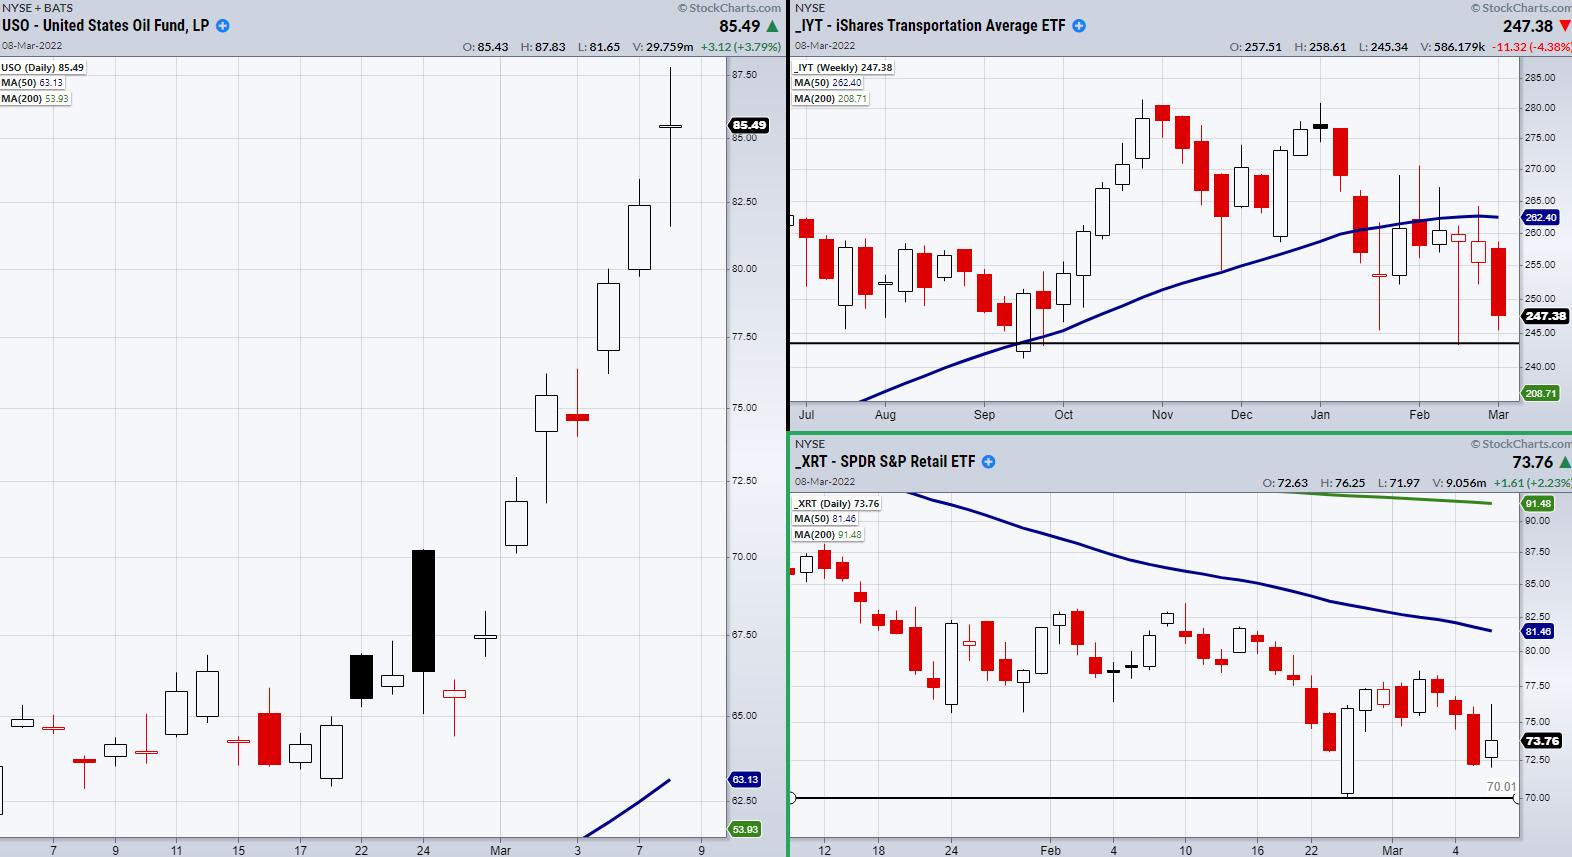
Are Transportation and the Retail Space in Danger? + See Mish on The Pitch and More!
After oil surges in volume from the U.S import ban on Russian oil, the Oil ETF (USO) closed roughly unchanged from its opening price. This makes USO interesting to watch for Wednesday's trading session, since the price action shows a large battle between buyers and sellers remains...
READ MORE
MEMBERS ONLY
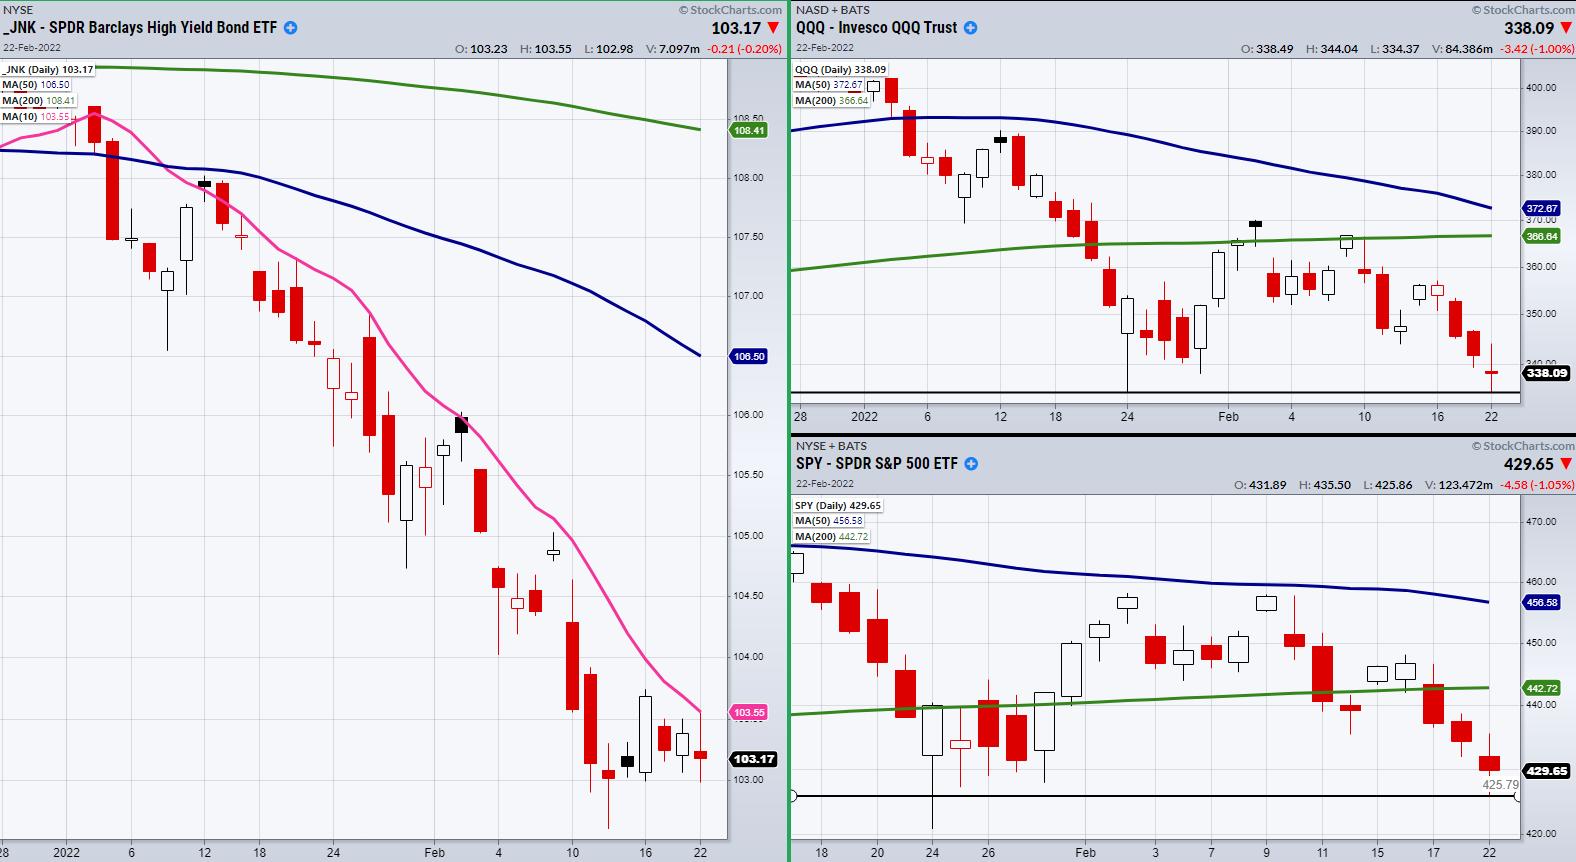
Are U.S Treasury Bonds (TLT) a Lagging Safety Play?
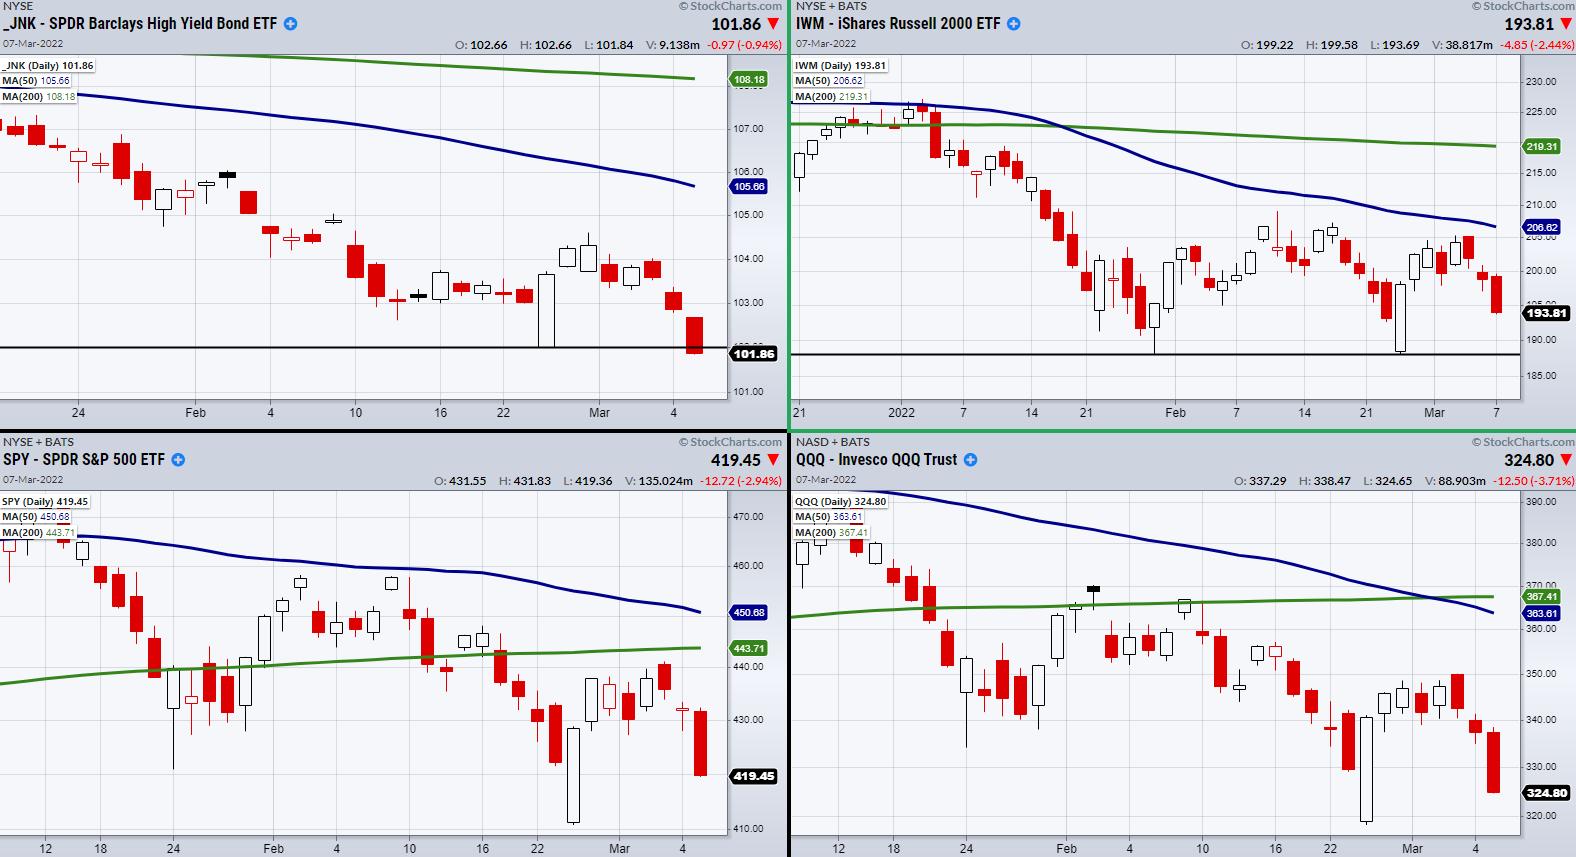
The U.S stock market continues to display pressure from the Russian—Ukraine war.
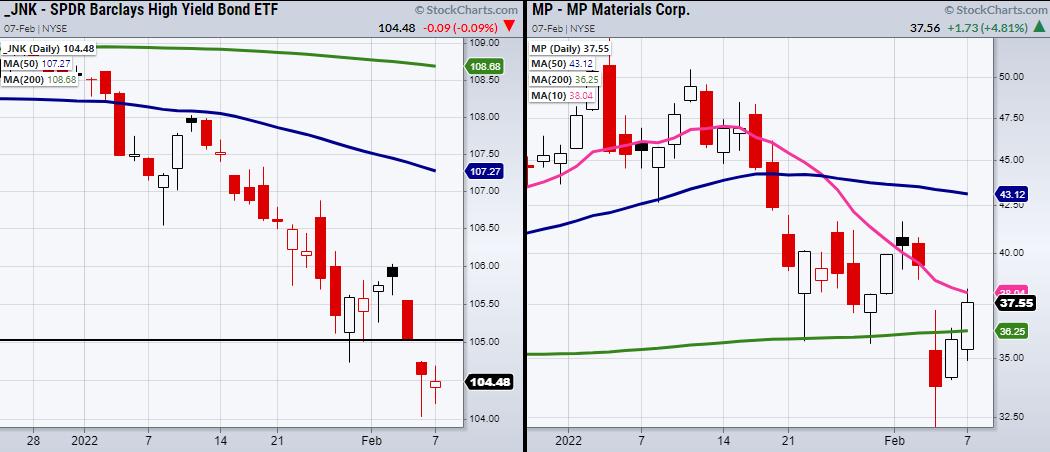
Additionally, High Yield Corporate Debt (JNK) broke support from its recent lows at $101.99.
Because we frequently use JNK as a risk on/off indicator, next we should watch for the major indices to break...
READ MORE
MEMBERS ONLY
Timing Entries for Fast-Paced Hot Sectors
The past couple of weeks have given us a new range to watch in the stock market.
A positive jobs report has been seemingly muted by indecision within the major indices. Therefore, we can look at the new ranges the Russell 2000 (IWM) has formed, along with watching the S&...
READ MORE
MEMBERS ONLY

How These 3 Symbols Can Guide Us Through the Trading Week
Geopolitical stress from the Russia/Ukraine situation piles onto the market and the Fed, which is now faced not only with worries of the U.S inflation numbers, but also extra price surges in energy. Though the Fed has already scheduled rate increases through this year, the development and quick...
READ MORE
MEMBERS ONLY
Can the Stock Market Hold Up if Commodities Soar?
Last week, the major indices made a successful rally back into a short-term support area. However, many see the price move as a rally back into a volatile resistance zone, leading people to believe we could again see the market break lower.
While this could be the case, as the...
READ MORE
MEMBERS ONLY

Regional Banking ETF (KRE) Confirmed a Bullish Phase Change
The Regional Banking ETF (KRE) has made two consecutive closes over its 50-day moving average, confirming a bullish phase change. KRE is also the only ETF in Mish's Economic Modern Family that is holding a bullish phase on a daily chart. Therefore, we should keep an eye on...
READ MORE
MEMBERS ONLY
Question the Crowd and Look for the Market's Hints
At the beginning of the week, investors worried as the market sold off. Then, on Thursday, the major indices made a large gap lower, igniting many to believe we had entered the beginning of a bear market. Though investors are still worried about geopolitical pressure, along with worries about rising...
READ MORE
MEMBERS ONLY

Why you Must Choose a Trading Timeframe
Many traders actively watch the market and believe there are always opportunities to make money. It can seem that way, as there is almost always a symbol sitting in the new 52-week high list or another symbol making a great intra-day move. However, this type of thinking can be dangerous,...
READ MORE
MEMBERS ONLY
Where to Watch for a Market Buy Signal
By the end of Tuesday, the S&P 500 (SPY) and the Nasdaq 100 (QQQ) were able to rally off support from lows found in late January. If they can hold their current prices, we can next watch for each to run back towards their range highs near $370...
READ MORE
MEMBERS ONLY
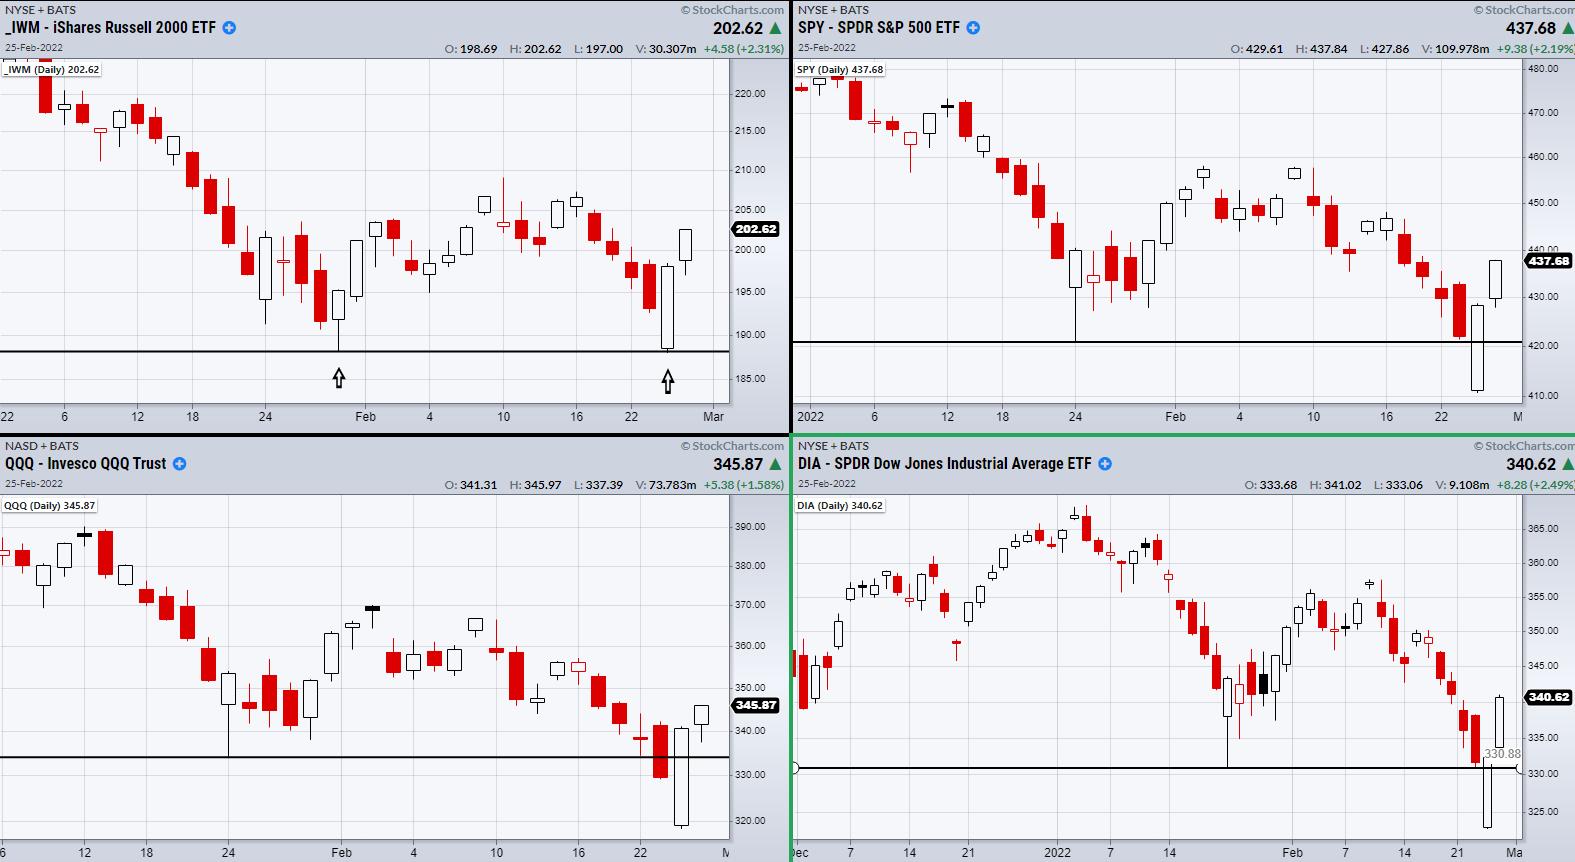
Can the Major Indices Hold Key Support Levels?
The Russell 2000 (IWM), S&P 500 (SPY), Dow Jones (DIA) and the Nasdaq 100 (QQQ) have all broken their previous minor support levels from Monday, February 14th's low as seen in the above chart. While the break under Monday's low makes the market look...
READ MORE
MEMBERS ONLY

Let's Build a Shopping List of Stocks and Areas to Watch
Wednesday's FOMC minutes release sparked a late-day rally in the stock market. If the rally continues into Thursday, this could be a great area to watch for trade setups in some of our favorite sectors.
Even with the market in a pivotal area, we need to stay quick...
READ MORE
MEMBERS ONLY
Is This Another Rally Into Resistance?
Mish's Economic Modern Family, which consists of 7 symbols that help guide us through the market, has many of the same problems the major indices are stuck with currently; namely, fairly tight trading ranges that keep investors worried about quick selloffs and volatile market conditions. With that said,...
READ MORE
MEMBERS ONLY
What to Do Next With No Clear Stock Market Direction
Currently, the market is digesting last Friday's big move and is not giving us any clear directional signs. After the major indices failed to clear key resistance levels last week, the market began to sell off.
Though Monday is showing a continuation from the previous Friday with a...
READ MORE
MEMBERS ONLY
Taking Profits While the Market Tanks
Both the S&P 500 (SPY) and the Nasdaq 100 (QQQ) failed to clear key resistance areas this past week.
Additionally, the CPI reported that inflation is yet again on the rise, sitting over 7% on a year-over-year basis as talks of war continue to heat up.
None of...
READ MORE
MEMBERS ONLY
Support and Resistance Levels to Watch for Thursday's Trading Session
Two of the major indices, including the Russell 2000 (IWM) and the Dow Jones (DIA), have cleared key resistance levels. However, the S&P 500 (SPY) and the Nasdaq 100 (QQQ) have yet to clear recent highs or major moving averages. Although Wednesday's price action looks hopeful,...
READ MORE
MEMBERS ONLY

Is the Biotech Space Looking for a Major Price Move?
The past four trading days have held roughly the same price areas within the major indices. Specifically, the S&P 500 (SPY) and the Nasdaq 100 (QQQ) have similar tight price action.
When watching for larger than average price moves, tight or consolidative price action can often lead to...
READ MORE
MEMBERS ONLY
Watch for a Breakout Above Monday's Inside Day Chart Pattern
Monday mainly showed consolidation within the major indices. The Russell 2000 (IWM) spent most of its time within Friday's price range, along with the S&P 500 (SPY) and the Nasdaq 100 (QQQ) having inside day chart patterns. Along with the stock markets' inconclusive price action,...
READ MORE
MEMBERS ONLY
Why High Yield Corporate Debt (JNK) Needs to Fill the Gap
Friday ends on a positive note, with the Dow Jones (DIA) and the S&P 500 (SPY) holding over their 200-day moving averages. Alongside them, Bitcoin has cleared 40k and is currently looking for 41k next. However, High Yield Corporate Debt (JNK) gapped lower Friday, creating a key area...
READ MORE
