MEMBERS ONLY
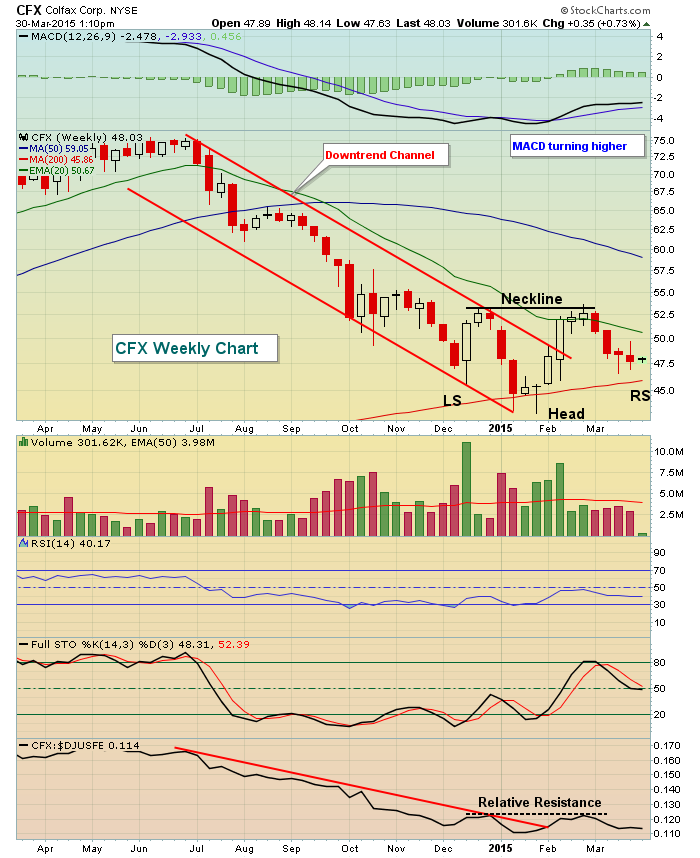
Colfax (CFX) Bottoming in Reverse Head & Shoulders Fashion?
by Tom Bowley,
Chief Market Strategist, EarningsBeats.com
Industrial machinery ($DJUSFE) stocks have been consolidating in what some technicians might argue is a bullish inverse head & shoulders pattern. If the group does eventually see money rotate back into it, Colfax Corp (CFX) could be a direct beneficiary. CFX lost 40% of its market capitalization in the second...
READ MORE
MEMBERS ONLY
Can You Time The Stock Market?
by Tom Bowley,
Chief Market Strategist, EarningsBeats.com
Well, I suppose it depends on your view and what you believe in. For me, there's no question about it. The stock market can be timed as history repeats itself over and over and over again. The stock market timing that I'm talking about, though, isn&...
READ MORE
MEMBERS ONLY
Lexmark (LXK) Challenges Wedge Resistance On Increasing Volume
by Tom Bowley,
Chief Market Strategist, EarningsBeats.com
Lexmark (LXK) announced after the closing bell on Tuesday that it was acquiring enterprise software company Kofax (KFX) for $1 billion, its largest acquisition in its history. Traders were initially excited by the announcement, driving LXK's stock price higher by more than 11% and LXK cleared bullish wedge...
READ MORE
MEMBERS ONLY
Flying High With Aerospace ($DJUSAS) and United Technologies (UTX)
by Tom Bowley,
Chief Market Strategist, EarningsBeats.com
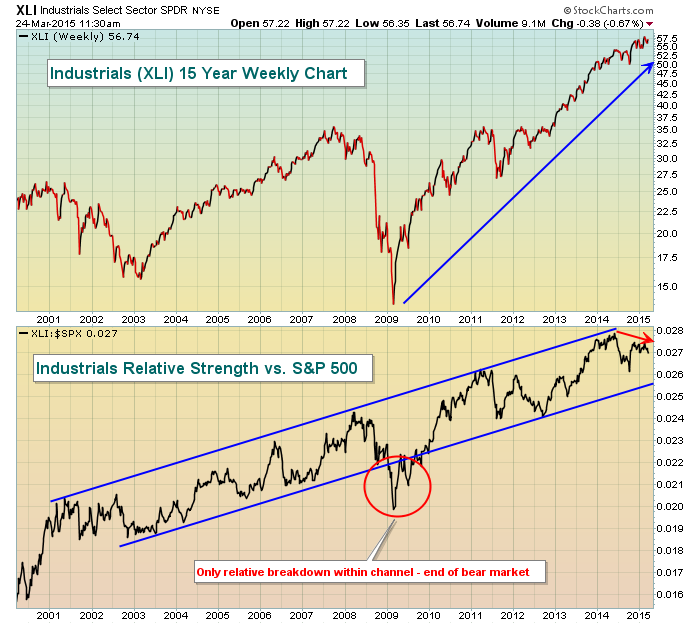
The aerospace industry ($DJUSAS) is a component of the industrial sector (XLI). Industrials have been a key driver of the S&P 500 since the turn of the century. There's a clear relative uptrend channel in play that was broken temporarily in 2009 as the 2007-2009 bear...
READ MORE
MEMBERS ONLY
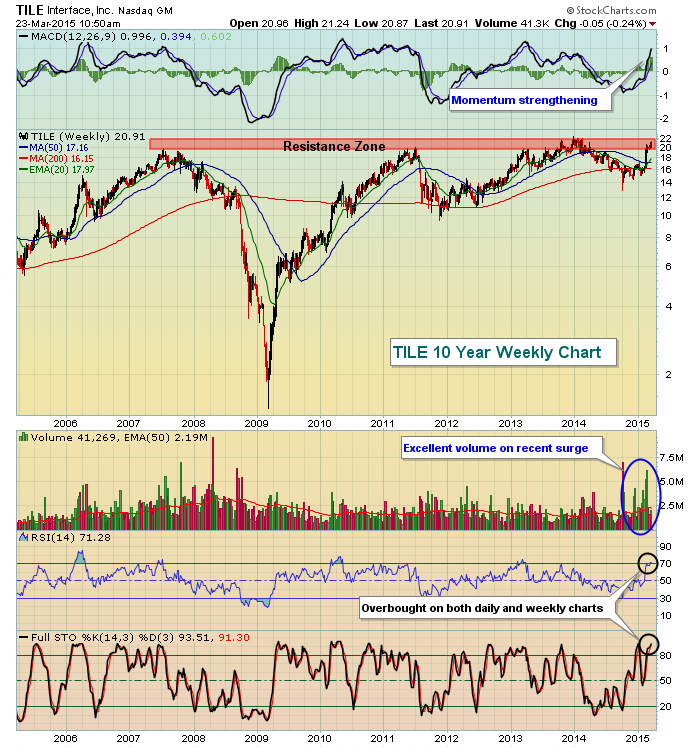
Interface (TILE) Floors It, Approaches Major Resistance
by Tom Bowley,
Chief Market Strategist, EarningsBeats.com
TILE is an industrial goods company that designs, produces and sells modular carpet products internationally. Strong quarterly results reported in February, exceeding Wall Street estimates, has sent TILE's shares surging 27% higher in just the past month. Major overhead price resistance is approaching, however, so it will be...
READ MORE
MEMBERS ONLY
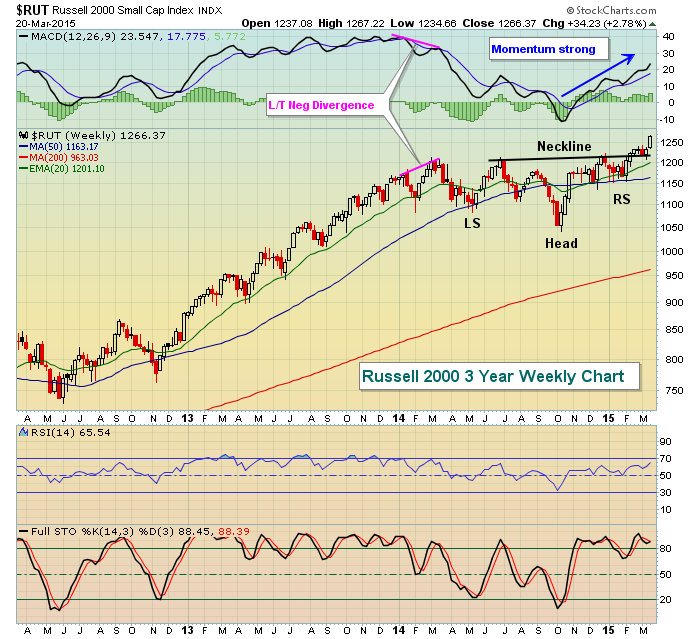
Aggressive Small Cap Indices Break Out Again
by Tom Bowley,
Chief Market Strategist, EarningsBeats.com
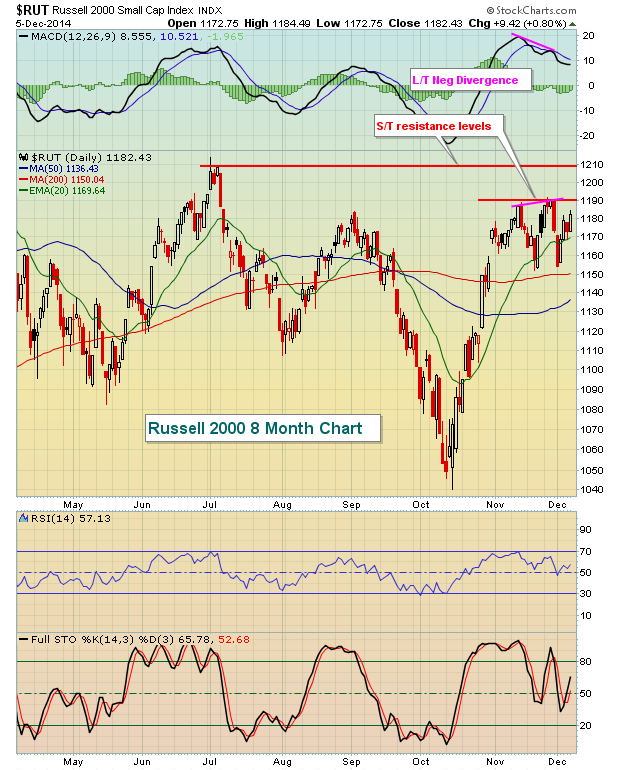
Both the Russell 2000 Index ($RUT) and S&P 600 Small Cap Index (SML) broke out to all-time highs last week as money continued to rotate towards aggressive small cap stocks and that should be seen as a bullish sign for equities. In the case of the $RUT, a...
READ MORE
MEMBERS ONLY
Dissecting The Technology Sector
by Tom Bowley,
Chief Market Strategist, EarningsBeats.com
Technology has outperformed every other sector over the past year - except for healthcare. So it begs the question - is there any more gas left in the technology tank? We've seen money rotate to various sectors throughout the past year. Most of the industry groups within technology...
READ MORE
MEMBERS ONLY
Many "Under The Surface" Technical Signals Strong
by Tom Bowley,
Chief Market Strategist, EarningsBeats.com
I'm not ready to give up on this bull market. While anything is certainly possible, traders are not positioning themselves for a steep market decline. Perhaps we'll see a bit of selling, maybe even a correction, but the longer-term bull market still remains intact in my...
READ MORE
MEMBERS ONLY
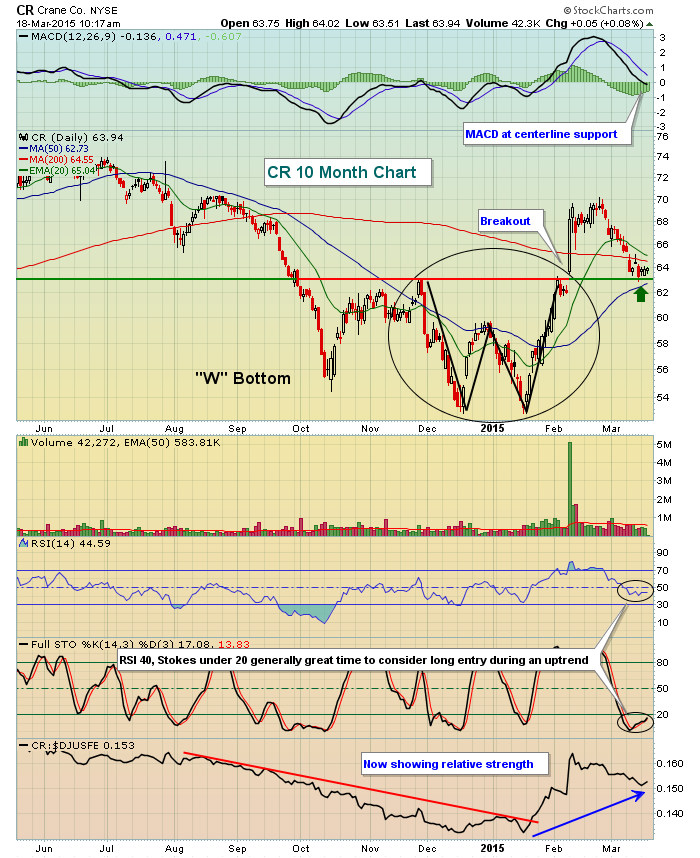
Crane (CR) Confirms "W" Bottom, Testing Support
by Tom Bowley,
Chief Market Strategist, EarningsBeats.com
Crane (CR) is a part of the Industrial Machinery ($DJUSFE) space, which has been consolidating since last summer and is poised to break out once again. CR printed a "W" bottom in December and January, with this bottom confirmed with the high volume gap up and breakout in...
READ MORE
MEMBERS ONLY
Home Construction ($DJUSHB) Tests Triangle Support
by Tom Bowley,
Chief Market Strategist, EarningsBeats.com
March has been a little rough for the stock market thus far, but there are a few areas where the pullback has represented welcome relief. Home construction ($DJUSHB) is one of those areas. Cyclical stocks, of which home construction is a part, seemed to take a much needed breather in...
READ MORE
MEMBERS ONLY
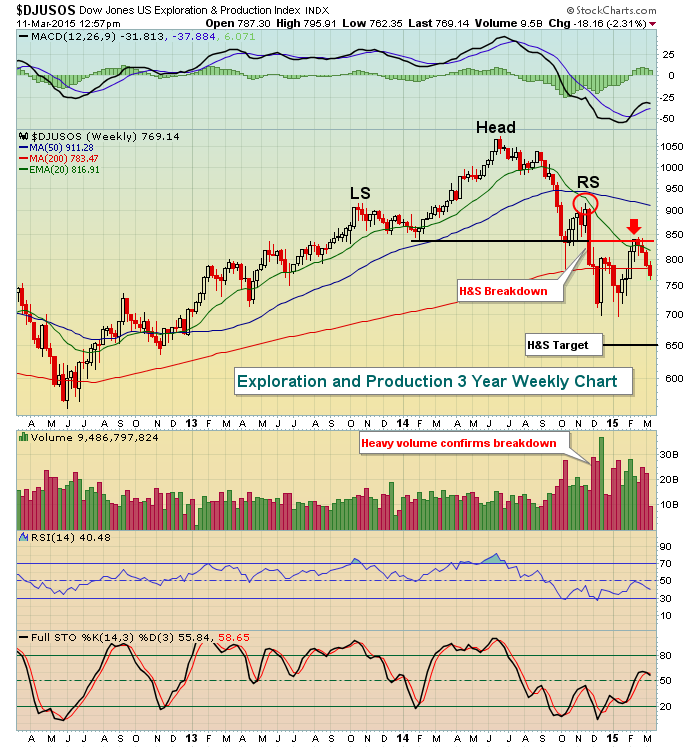
Exploration and Production Index ($DJUSOS) Bottoming?
by Tom Bowley,
Chief Market Strategist, EarningsBeats.com
While most of the U.S. stock market enjoys quite a bull market dating back to March 2009, that's not the case currently for exploration and production stocks ($DJUSOS) - at least not in the near- to intermediate-term. A topping head & shoulders pattern confirmed in late November...
READ MORE
MEMBERS ONLY
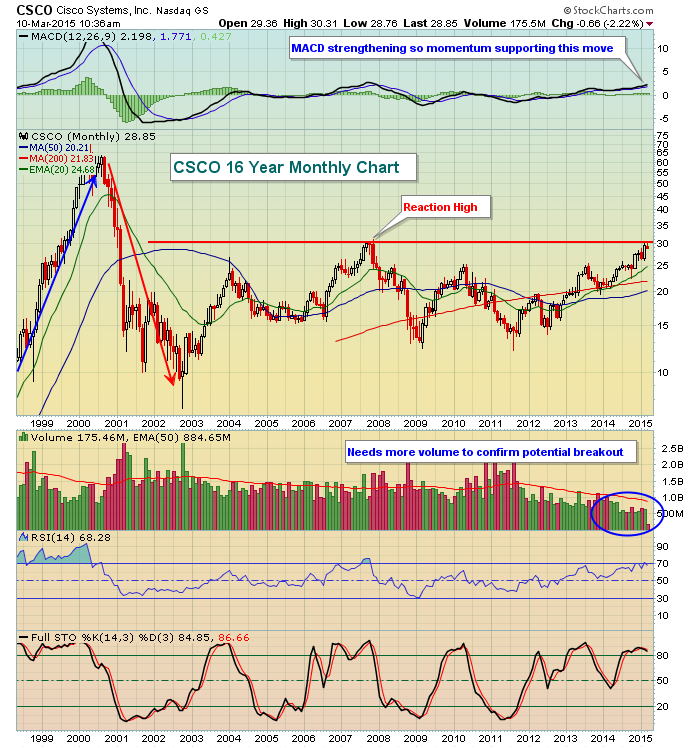
Cisco Systems (CSCO) Tests 14 Year High
by Tom Bowley,
Chief Market Strategist, EarningsBeats.com
Since the tech bubble popped in the early 2000s, CSCO has slowly risen from the ashes. It fell a remarkable 90% from its high in 2000 to its low in late 2002. Keep in mind, however, that it made a parabolic move higher prior to this drop. 2000 started a...
READ MORE
MEMBERS ONLY
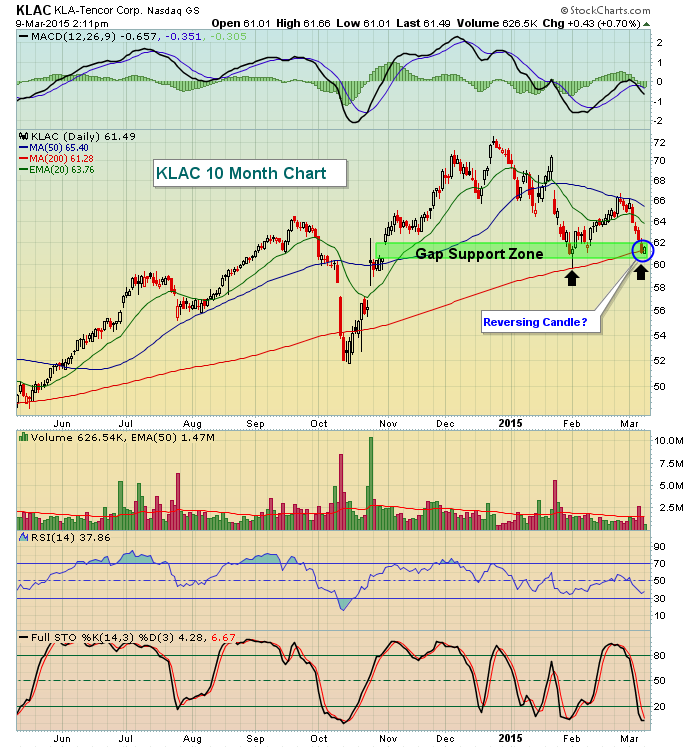
KLA-Tencor (KLAC) Testing Key Support Zone
by Tom Bowley,
Chief Market Strategist, EarningsBeats.com
Semiconductors ($DJUSSC) are one of the worst areas of the market today and have been one of the worst areas of technology over the past week. KLA-Tencor (KLAC) has hit a key area of support, however, and certainly presents a much better reward to risk opportunity. 60.53 represents gap...
READ MORE
MEMBERS ONLY
Internet Stocks Showing Renewed Relative Strength
by Tom Bowley,
Chief Market Strategist, EarningsBeats.com
When we look back at last week's action, a few things stand out to me. First, the aggressive sectors - financials, consumer discretionary, technology and industrials - held up quite well on a relative basis. That should be seen as a positive. The worst performing group was utilities,...
READ MORE
MEMBERS ONLY
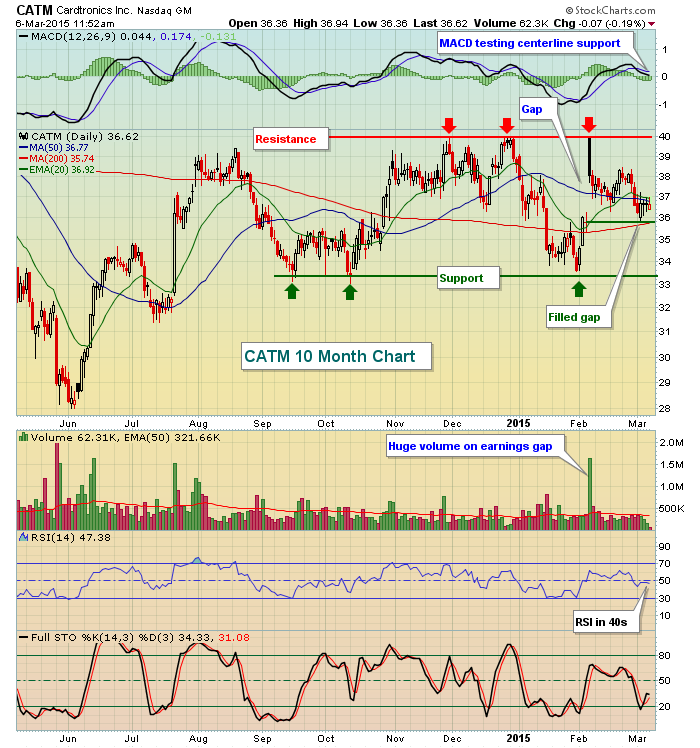
Cardtronics (CATM) Fills Earnings Gap
by Tom Bowley,
Chief Market Strategist, EarningsBeats.com
Cardtronics (CATM) reported stellar quarterly results on February 4th after the close, beating Wall Street estimates with respect to both revenues ($283.9 million actual vs. $270.6 million estimate) and EPS ($.64 actual vs. $.57 estimate). At the open on February 5th, CATM gapped higher to 40.00 from...
READ MORE
MEMBERS ONLY
Welcome to Trading Places!
by Tom Bowley,
Chief Market Strategist, EarningsBeats.com
Hello! I'm Tom. Welcome to my new blog - "Trading Places with Tom Bowley."
First off, I'd like to thank you for stopping by. I'm thrilled to be writing blogs and hosting webinars exclusively at StockCharts.com while doing so among the...
READ MORE
MEMBERS ONLY
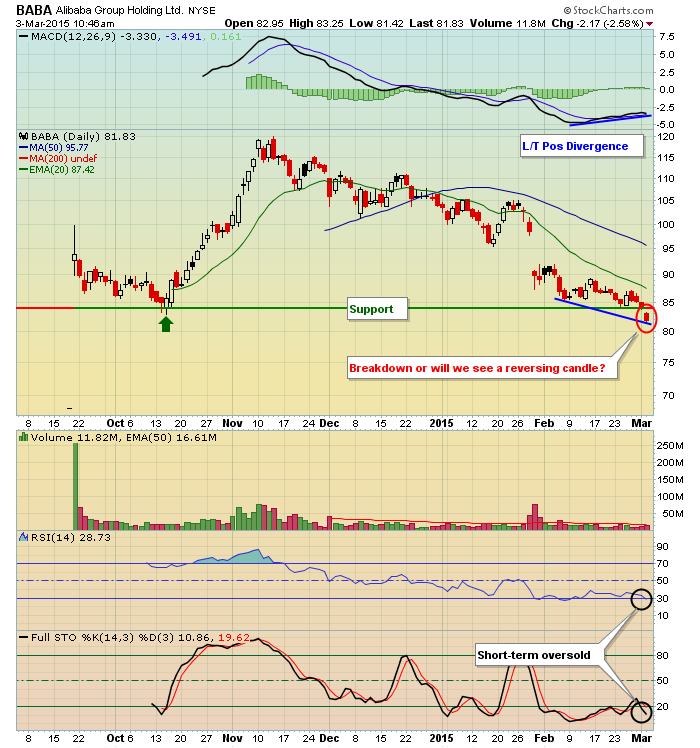
BABA: Breaking Down or Reversing With Positive Divergence?
by Tom Bowley,
Chief Market Strategist, EarningsBeats.com
On Monday, BABA closed at 84.00, its lowest close since its IPO in September. However, that close was very close to support and BABA is currently oversold with its RSI below 30 and its stochastic reading at 11. Note there's a long-term positive divergence that's...
READ MORE
MEMBERS ONLY
Defensive Stocks Lagging Although One Group Poised For Rebound
by Tom Bowley,
Chief Market Strategist, EarningsBeats.com
We've seen a very nice rally in U.S. equities during February, erasing all of January's losses with most of our major indices now breaking out to all-time highs. The NASDAQ has been leading the charge and that indicates that we're in a "...
READ MORE
MEMBERS ONLY
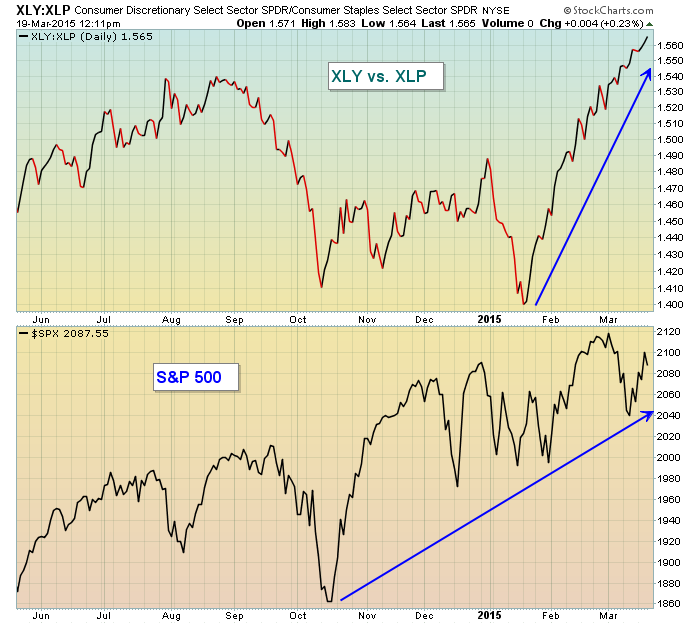
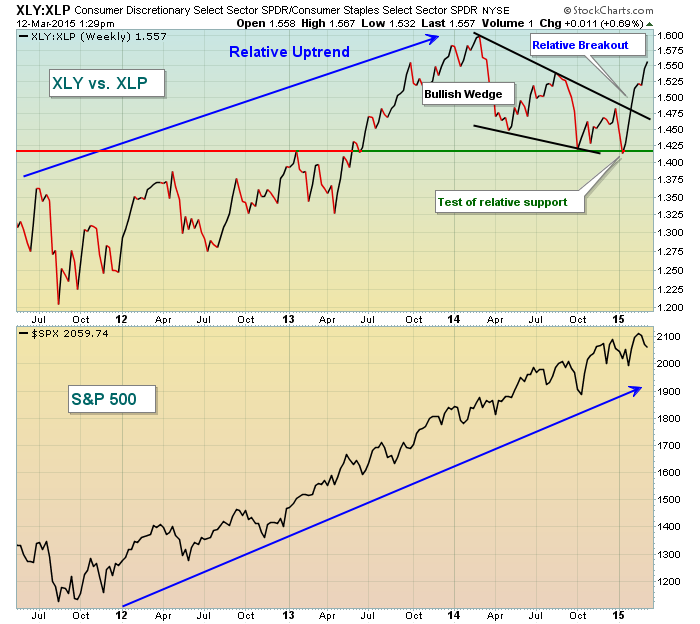
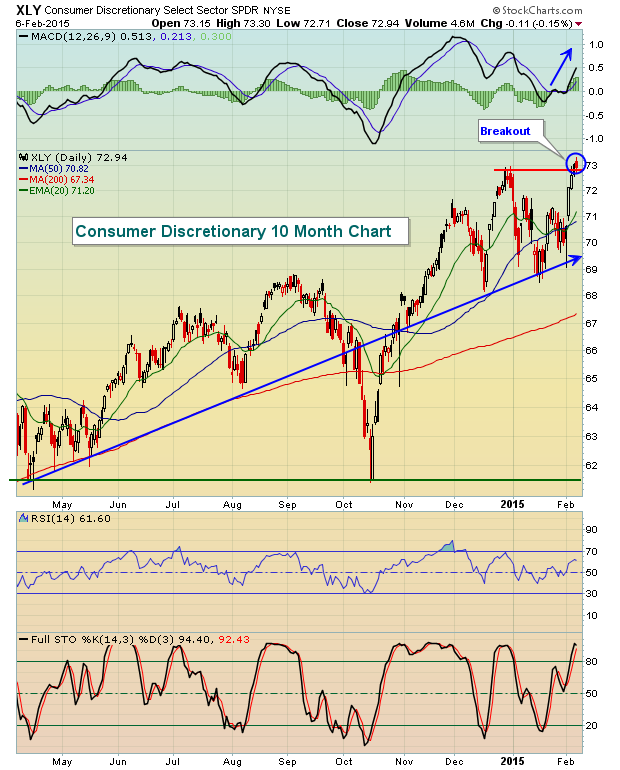
Consumer Discretionary Stocks Fuel Rally
by Tom Bowley,
Chief Market Strategist, EarningsBeats.com
There's been much said and written about rapidly-declining crude oil prices ($WTIC). But one thing makes perfect sense to me. When American consumers save TONS of money when filling up at the pump, they tend to spend it elsewhere. It's simply what we like to do...
READ MORE
MEMBERS ONLY
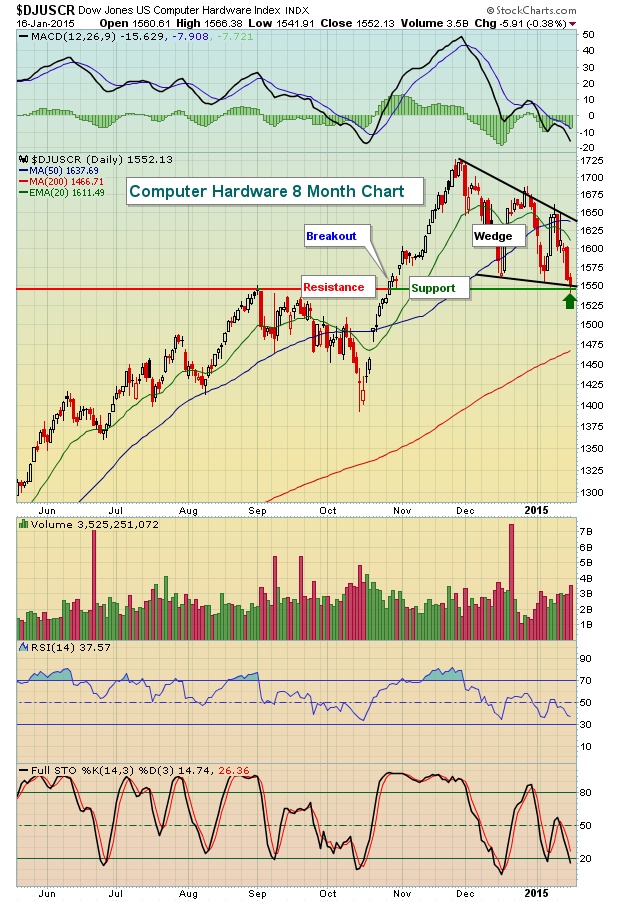
Key Tests Approaching in Technology
by Tom Bowley,
Chief Market Strategist, EarningsBeats.com
The nearly six year bull market lives on, but the bulls have been taking several body blows of late. Whether this bull market continues could depend on a couple of key industry groups within the technology space.
First, let's take a look at computer hardware ($DJUSCR). This is...
READ MORE
MEMBERS ONLY
Industrial Machinery Index Seems Poised for 2015 Rally
by Tom Bowley,
Chief Market Strategist, EarningsBeats.com
It's easy to follow the crowd and buy what keeps going higher. But generally larger gains can be found in healthy areas of the market where we've seen months of consolidation, awaiting that next breakout. As an example, it wasn't that long ago that...
READ MORE
MEMBERS ONLY
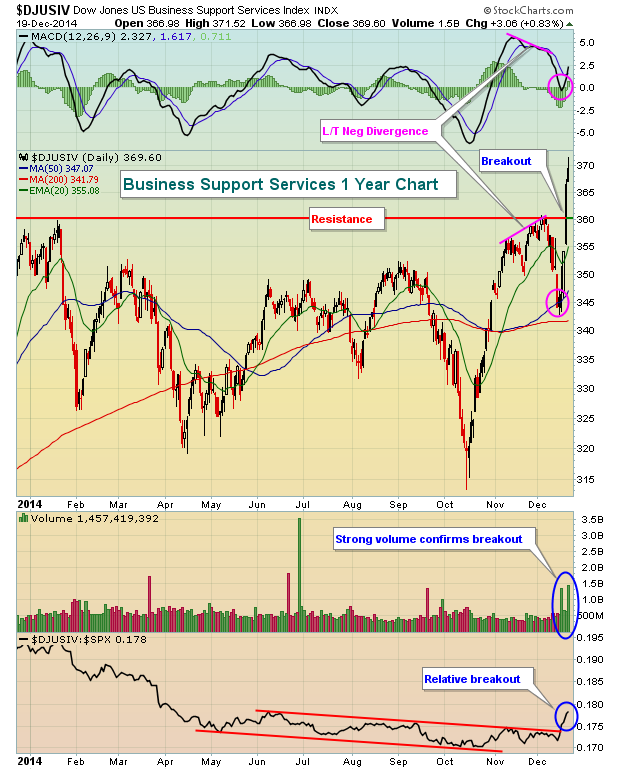
Business Support Services Index Breaks Out After Long Base
by Tom Bowley,
Chief Market Strategist, EarningsBeats.com
Stock market action played out the past two weeks almost perfectly according to historical plan. In my last article, I discussed the bearish tendencies of equities from December 7th through December 15th and the S&P 500 promptly lost 85 points, or more than 4% during this period in...
READ MORE
MEMBERS ONLY
Small Caps Ready to Make a December Run?
by Tom Bowley,
Chief Market Strategist, EarningsBeats.com
As a student of stock market history, I'm often astonished by historical facts about market performance. December is generally a very solid month for equities and no index benefits more from this seasonal bullishness than the Russell 2000. Since 1987, the Russell 2000 has risen 24 of 27...
READ MORE
MEMBERS ONLY
Earnings Season Delivers
by Tom Bowley,
Chief Market Strategist, EarningsBeats.com
If ever the bulls needed to see some stellar earnings results and/or positive forward guidance, it was about one month ago. From the late September high of 2019 to the mid-October low of 1821, the S&P 500 fell nearly 10% just as earnings season kicked off. During...
READ MORE
MEMBERS ONLY
Is The Latest Breakout A Trick or Treat?
by Tom Bowley,
Chief Market Strategist, EarningsBeats.com
First, let me say Happy Halloween to all! It's an exciting time for many, but especially the children. I know our neighborhood is always buzzing with kids anticipating the sugarfest! :-)
Unfortunately, the stock market bears were SPOOKED on Halloween this year. I've said for months...
READ MORE
MEMBERS ONLY
Weakness Confirms Earlier Bearish Signals
by Tom Bowley,
Chief Market Strategist, EarningsBeats.com
Make no mistake about it, volume has exploded and stock prices have fallen and lost key support levels. That combination is bearish in and of itself. But the part that really bothers me is that intermarket warning signs have been flashing for months so this high volume market drop confirms...
READ MORE
MEMBERS ONLY
Next Up: Earnings Season
by Tom Bowley,
Chief Market Strategist, EarningsBeats.com
The Fed is winding down its asset purchase program and the historically weak month of September is now behind us. So what's in store next? Earnings season. The stock market sends us signals all the time and given the recent performance of certain sectors and industry groups, we...
READ MORE
MEMBERS ONLY
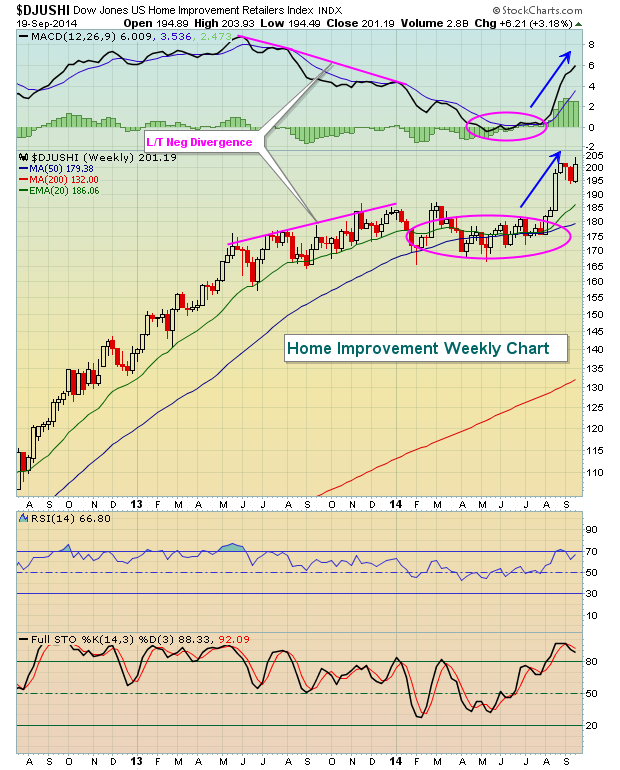
Remodeling Your Portfolio With Home Improvement Stocks
by Tom Bowley,
Chief Market Strategist, EarningsBeats.com
You should know by now that I'm a HUGE fan of the Moving Average Convergence Divergence (MACD) indicator. Other than the combination of price/volume and the use of candlesticks, it's probably my "go-to" indicator. As a case study for this weekend, let'...
READ MORE
MEMBERS ONLY
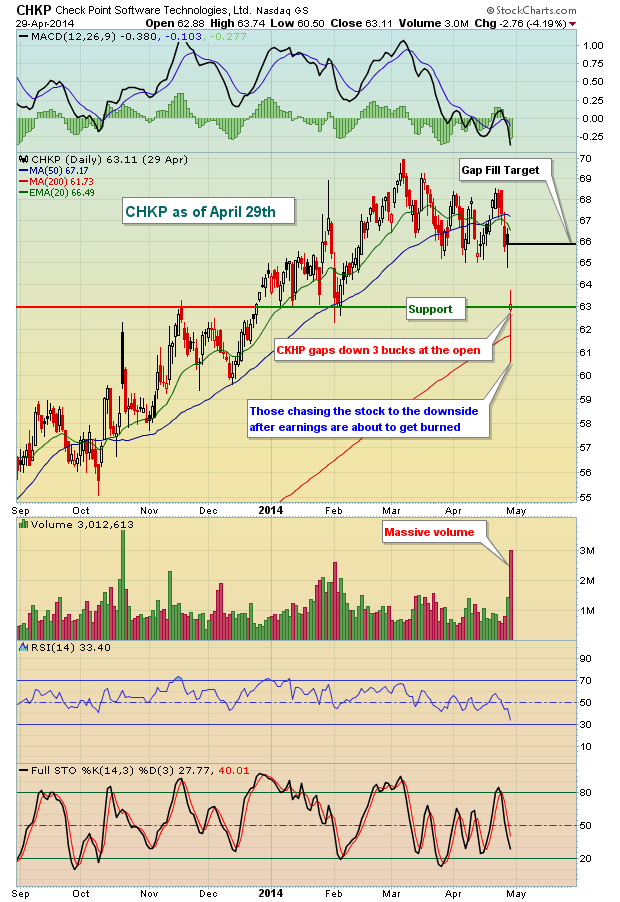
Trading Gaps
by Tom Bowley,
Chief Market Strategist, EarningsBeats.com
Identifying a tradable gap can be quite profitable, but also frustrating at times. Awful news hits the wires and a stock gaps lower. The immediate question becomes "Should I sell at the open?" Well, conventional wisdom may suggest that you sell and your emotions may suggest it as...
READ MORE
MEMBERS ONLY
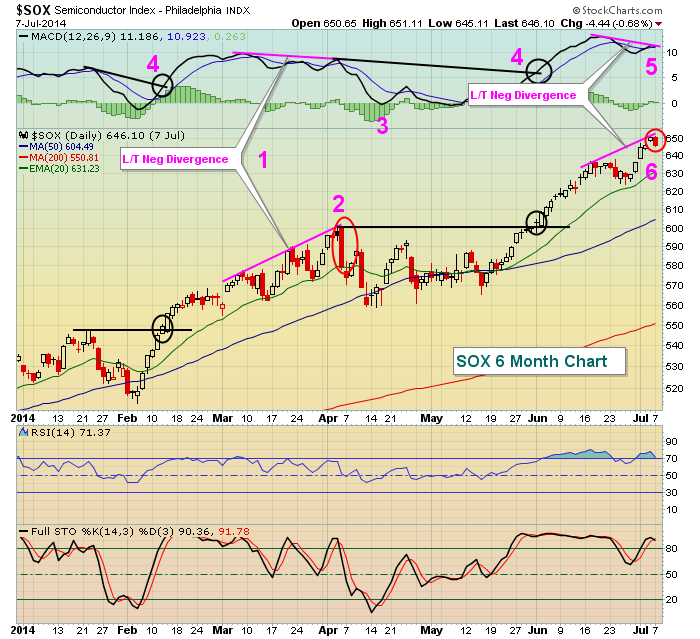
Price Support Holds After Momentum Slows
by Tom Bowley,
Chief Market Strategist, EarningsBeats.com
The NASDAQ has been powering forward off the mid-April lows and one big reason has been the semiconductor industry. The Philadelphia Semiconductor index ($SOX) rose 15% in just a seven week period from May 15th through July 3rd. From there, a severe long-term negative divergence printed and that suggested that...
READ MORE
MEMBERS ONLY
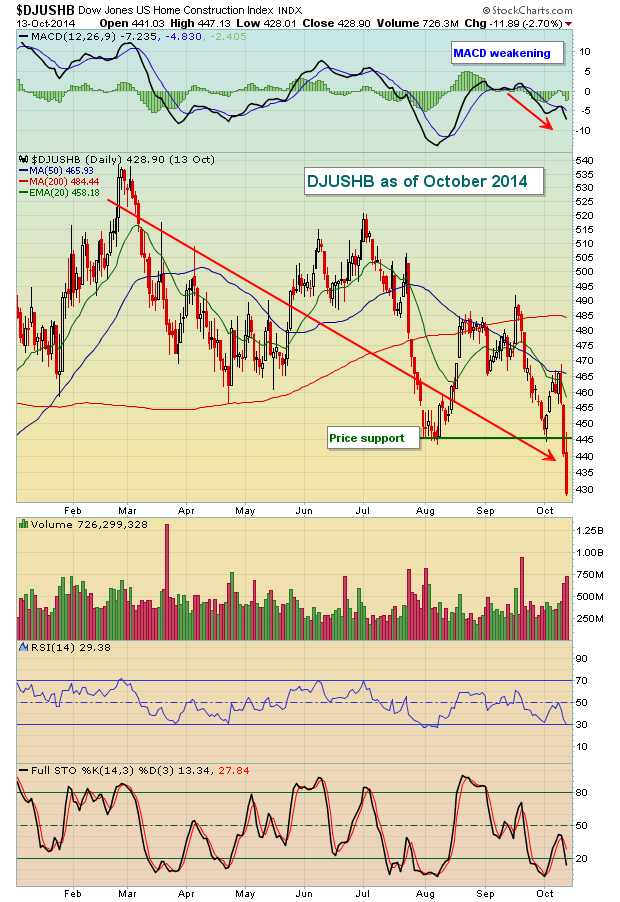
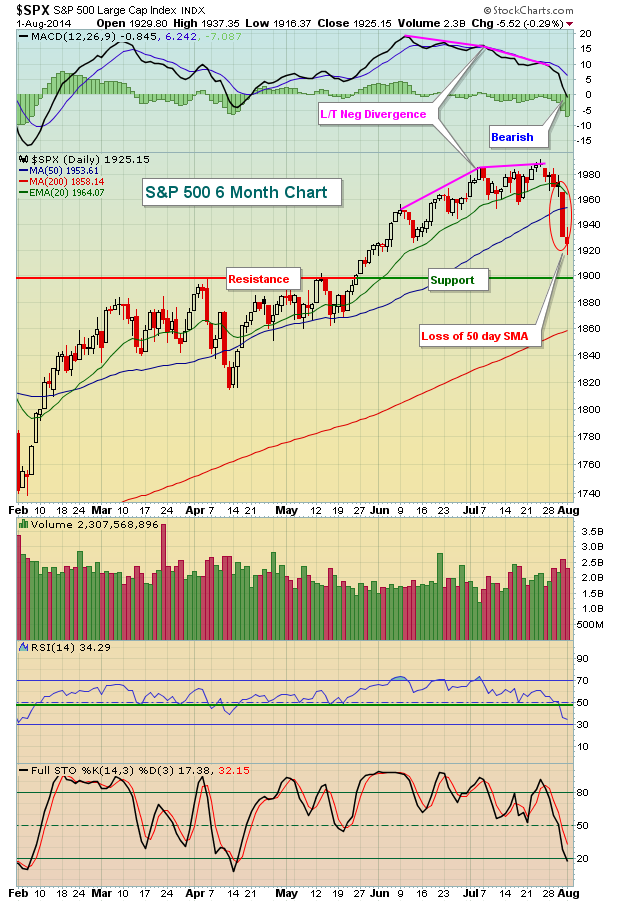
Homebuilders Lead Bear Attack on S&P 500
by Tom Bowley,
Chief Market Strategist, EarningsBeats.com
Warning signs have piled up for months, but there have been few breakdowns to confirm all of these bearish signals. That changed last week as volume surged leading to breakdowns across many of our major indices, sectors and industry groups. One obvious problem was the S&P 500'...
READ MORE
MEMBERS ONLY
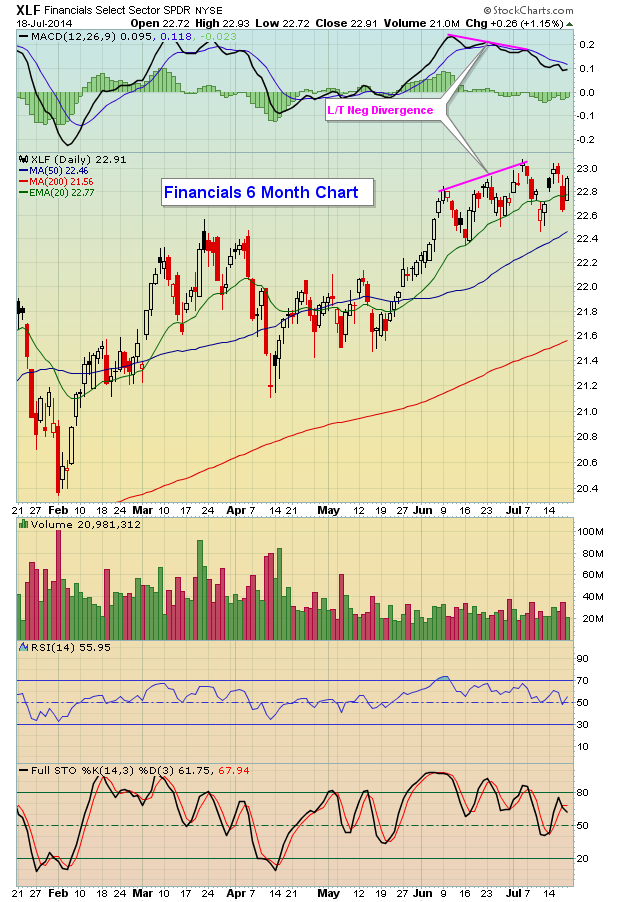
Mortgage Finance At Major Support
by Tom Bowley,
Chief Market Strategist, EarningsBeats.com
Financial stocks have lagged throughout 2014 and are showing signs of slowing momentum. That's keeping hope alive for the bears. The XLF (ETF tracking financial stocks) has a clear long-term negative divergence in play on its MACD as you can see from the chart below:
Most of the...
READ MORE
MEMBERS ONLY
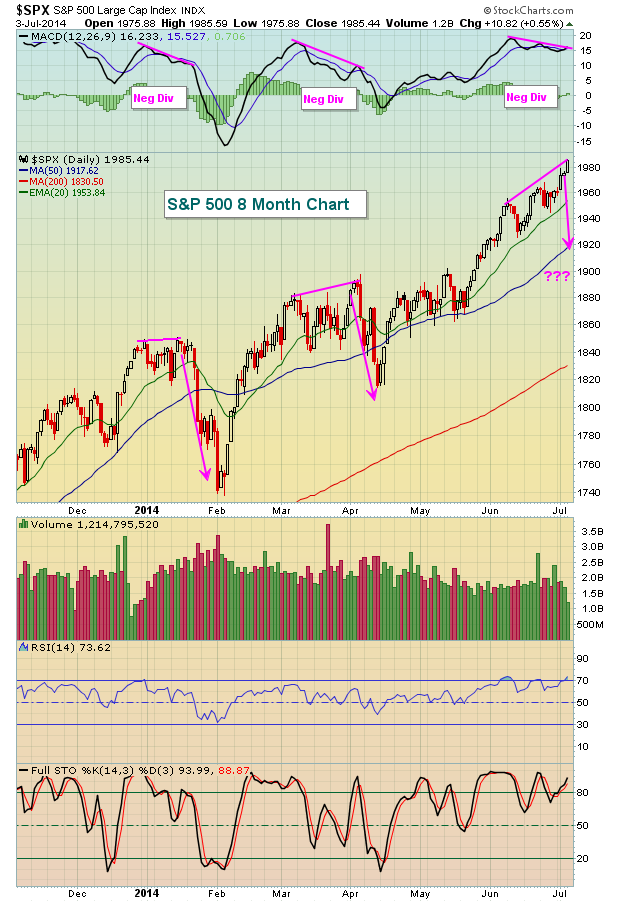
Assessing The First Half of 2014
by Tom Bowley,
Chief Market Strategist, EarningsBeats.com
It's been quite confusing for several reasons, a few of which are discussed below.
Historically, the S&P 500 nearly always struggles during the balance of a calendar year in which January performance is weak. In January 2014, the S&P 500 fell 3.56%, ranking...
READ MORE
MEMBERS ONLY
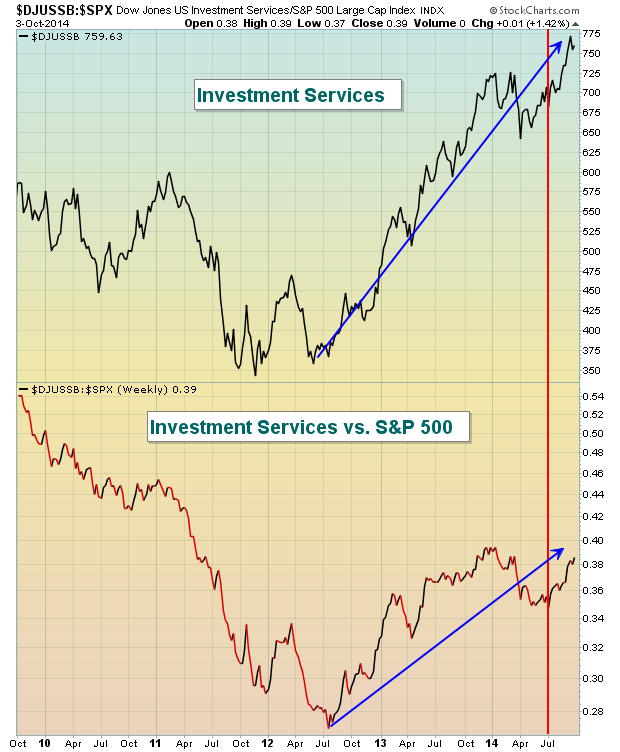
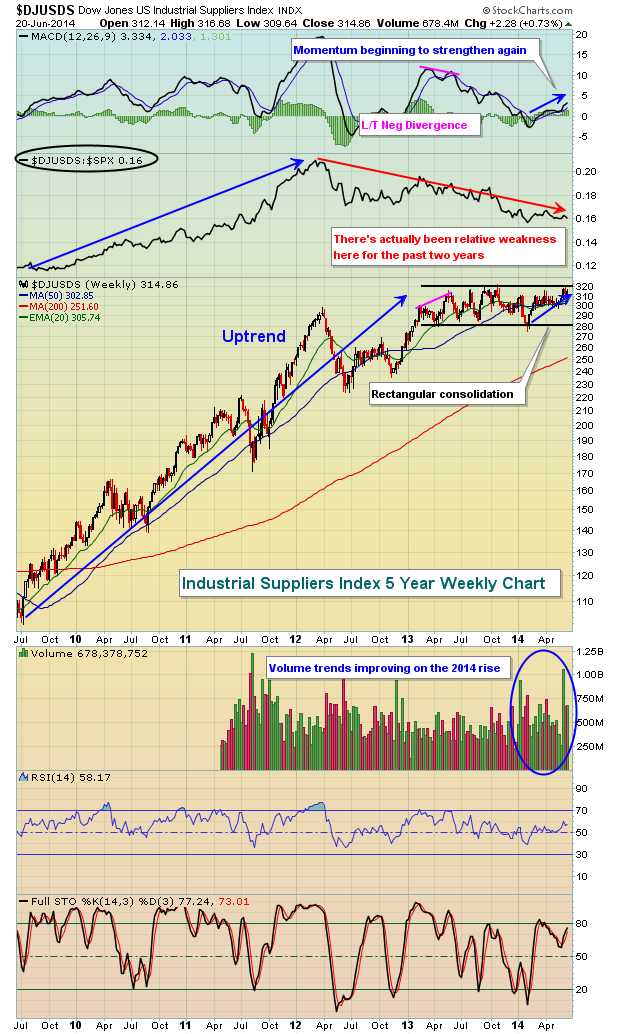
Industrial Suppliers Waiting Their Turn?
by Tom Bowley,
Chief Market Strategist, EarningsBeats.com
The Dow Jones US Industrial Suppliers Index ($DJUSDS) experienced a HUGE bull market run off the 2009 lows through mid-2013, quadrupling in value during the period. Momentum on the weekly chart turned negative, as evidenced by the long-term negative divergence on its MACD. As a result, this index has gone...
READ MORE
MEMBERS ONLY
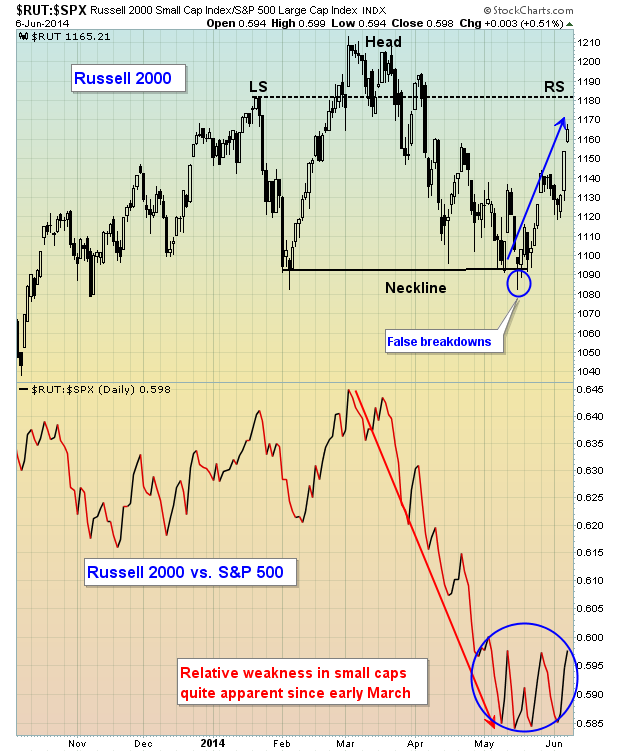
Small Caps Rebound After Holding Major Support
by Tom Bowley,
Chief Market Strategist, EarningsBeats.com
In my last article, I posted a chart of the Russell 2000, identifying a potentially bearish head & shoulders pattern. This pattern, however, requires a high volume breakdown to confirm the likelihood of future weakness. That breakdown never occurred and small cap bulls used historical bullish tendencies from late May...
READ MORE
MEMBERS ONLY
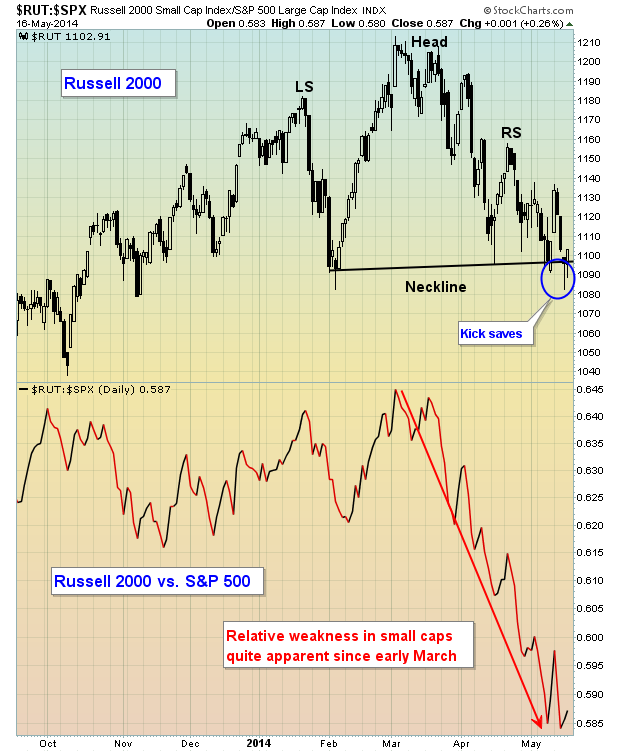
Small Caps: Turn Around Approaching?
by Tom Bowley,
Chief Market Strategist, EarningsBeats.com
I've been very cautious about the stock market throughout most of 2014. There are warning signs galore. But the Russell 2000 has been hit particularly hard year-to-date, dropping approximately 10% from the high set in early March. That was the time when money began rotating away from many...
READ MORE
MEMBERS ONLY
Cyclicals Not Worth The Gamble
by Tom Bowley,
Chief Market Strategist, EarningsBeats.com
In 2013, market participants couldn't get enough of cyclicals, or consumer discretionary stocks. The XLY (ETF that tracks consumer discretionary) rose more than 40% in 2013 to lead all sectors on a relative basis. But things have changed in 2014, with many of the strong industry groups in...
READ MORE
MEMBERS ONLY
Rising Volatility and Bearish Technical Patterns a Double Negative
by Tom Bowley,
Chief Market Strategist, EarningsBeats.com
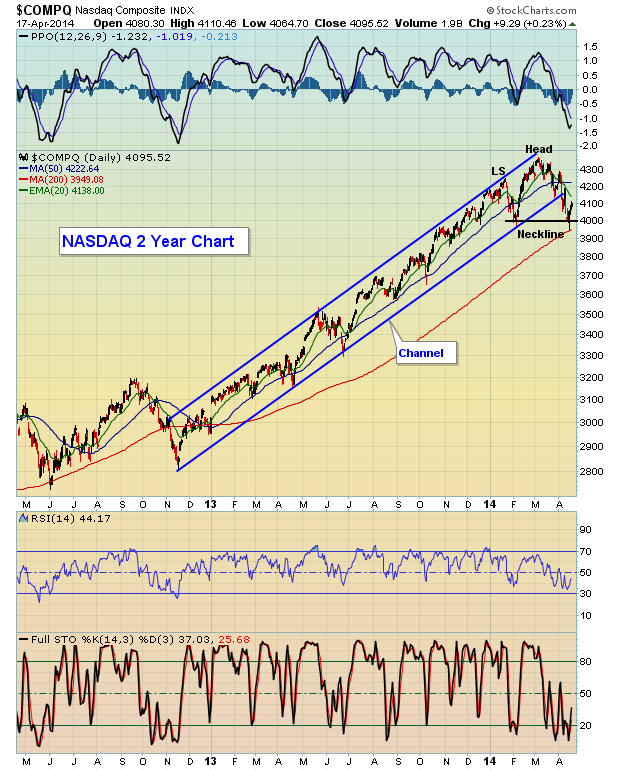
Last week's gains may have been more about options expiration and an oversold bounce than anything else. I have my eyes set squarely on the NASDAQ right now, waiting either for a resumption of the five year bull market or a breakdown of its current head & shoulders...
READ MORE
MEMBERS ONLY
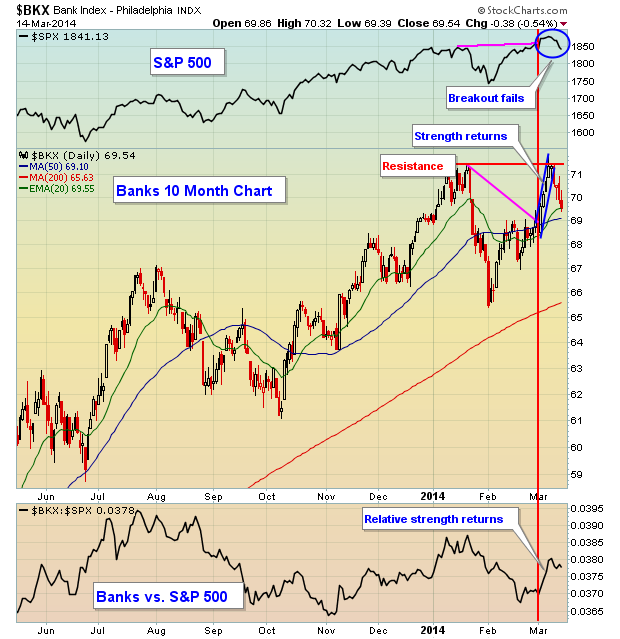
Warning Signs Piling Up
by Tom Bowley,
Chief Market Strategist, EarningsBeats.com
In earlier 2014 articles, I've discussed warning signs that emerged from Volatility indices, behavior in the treasury market, relative weakness of banks and relative strength of defensive areas of the market like utilities and REITs. In addition, the S&P 500 has shown a propensity to struggle...
READ MORE
MEMBERS ONLY
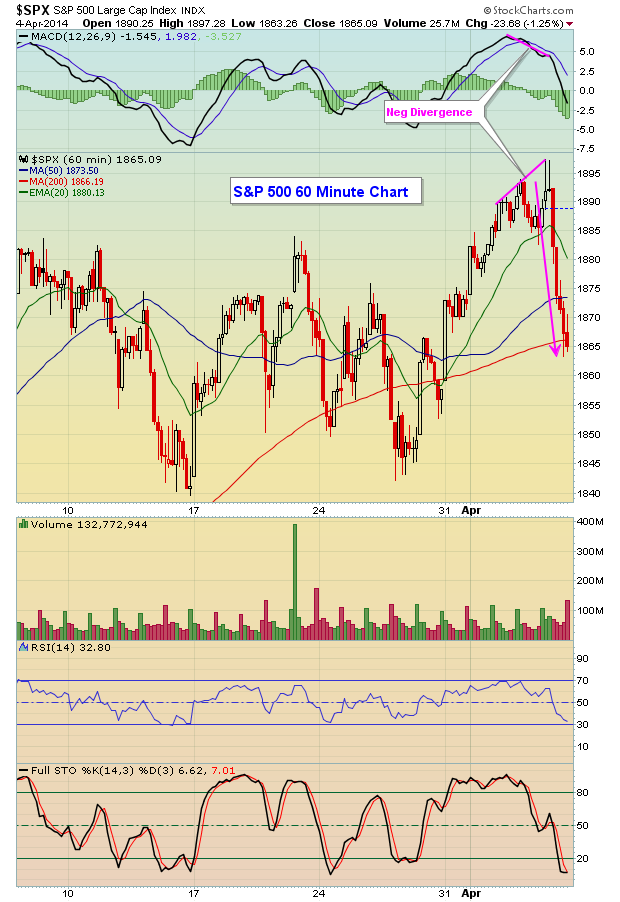
March Madness Underway
by Tom Bowley,
Chief Market Strategist, EarningsBeats.com
Nope, I'm not referring to college basketball. Instead, it's this wacky stock market. In my last article, I discussed several reasons why the 2014 advance is on shaky ground. Since then, we've seen increased volatility and lots of whipsaw action. Earlier in March, our...
READ MORE