MEMBERS ONLY

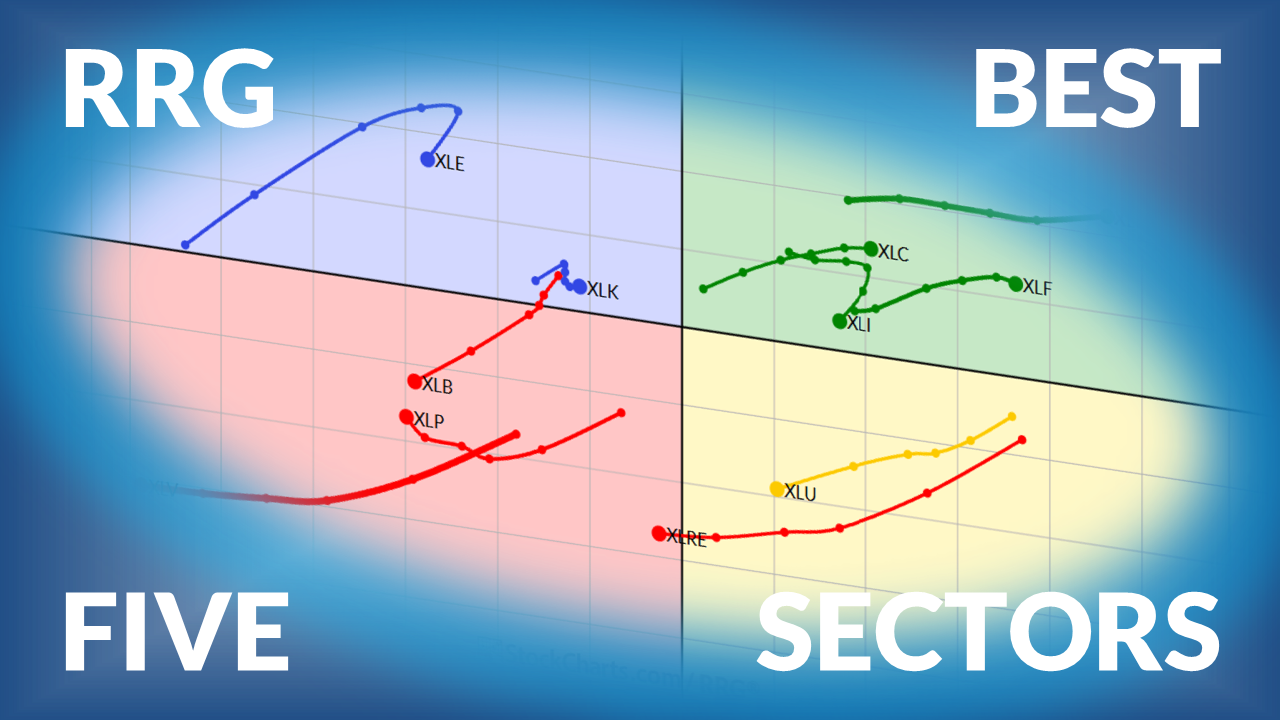
Offense Still Crushing Defense

by David Keller,
President and Chief Strategist, Sierra Alpha Research
While technology stocks have stalled out over the last six weeks, other growth sectors have stepped into a leadership role. Here are the charts Dave uses regularly to track leadership themes, and identify when new sectors are improving in relative strength terms....
READ MORE
MEMBERS ONLY

September’s Final Stretch: Why Stocks Face Their Trickiest Days Ahead
Late September is historically tough for stocks. Mike explores why the S&P 500, Materials (XLB), and low-volatility put options could define the weeks ahead....
READ MORE
MEMBERS ONLY
Pre-FOMC Setup: S&P 500 Calm Before the Fed

by Frank Cappelleri,
Founder & President, CappThesis, LLC
Frank Cappelleri analyzes the S&P 500’s unusual calm ahead of the Fed, highlighting trend signals, failed bearish patterns, and key GoNoGo charts....
READ MORE
MEMBERS ONLY

These Asset Relationships Could Be About to Signal Some Important Changes Ahead

by Martin Pring,
President, Pring Research
Martin explains how analyzing inter-asset relationships can give important insights into the market -- and what those relationships are telling us right now....
READ MORE
MEMBERS ONLY

Will the Fed “Go Big”? Real Estate Stocks Quiet Amid Major Macro Shifts
The Fed is set to cut rates again as Treasury yields slide and stocks rally. But why are real estate stocks still lagging? And could a breakout above a key resistance level shape the 2026 cycle?...
READ MORE
MEMBERS ONLY

Comparing Growth vs. Value on RRGs Across Time

by Julius de Kempenaer,
Senior Technical Analyst, StockCharts.com
Growth and Value segments are widely used in the investment world, as investors shift from one to another based on market conditions and risk-appetite. Julius shows how to use Relative Rotation Graphs to help monitor these shifts....
READ MORE
MEMBERS ONLY

Visionary Leadership and Strong Fundamentals as Drivers of a Winning Stock

by Mary Ellen McGonagle,
President, MEM Investment Research
Mary Ellen looks back at winning stocks whose histories have been impacted by forward-thinking leadership and innovation....
READ MORE
MEMBERS ONLY
Make Every Chart Look Like Your Chart—With One Click

by Jayanthi Gopalakrishnan,
Director of Site Content, StockCharts.com
Have you ever wished you could change any chart you open to appear just the way you want – in just a single click? With StyleButtons, you can do just that.
Setting it up
When you’re logged in to your StockCharts account and using SharpCharts, look at the upper-left of...
READ MORE
MEMBERS ONLY

AI Stocks Pop...These Areas Not!
by Mary Ellen McGonagle,
President, MEM Investment Research
In this week’s video, Mary Ellen breaks down what drove AI-related stocks higher, while also revealing non-tech names that are poised to benefit. She highlights specific Crypto ETFs that are in a bullish positions, plus discusses the move into Gold and other metals.
This video originally premiered on September...
READ MORE
MEMBERS ONLY

RSI Overbought? Why That Could Signal Big Gains Ahead
by David Keller,
President and Chief Strategist, Sierra Alpha Research
Join Dave as he explains how traders often get into trouble by thinking of “overbought” stocks as being bearish setups. While an RSI over 70 can often lead to short-term pullbacks, Dave explains that they can also signal the strength of a long-term uptrend phase. He uses Motorola Solutions (MSI)...
READ MORE
MEMBERS ONLY
AI Stocks Setting Up For A Tumble?

by Tom Bowley,
Chief Market Strategist, EarningsBeats.com
Join Tom as he recaps the stock market action of the past week! Tom breaks down the current technical outlook on the major indices, before highlighting key sector rotation using RRG charts. He then dives into large AI stocks like ORCL, NVDA, MSFT, META, PLTR, and others, followed by a...
READ MORE
MEMBERS ONLY

Bonds Still Underperforming, Best Sectors for Hunting, IWM Starts to Leads SPY, Healthcare and Biogen Perk Up

by Arthur Hill,
Chief Technical Strategist, TrendInvestorPro.com
TLT broke out, but is still underperforming SPY; meanwhile, IWM has begun outperforming SPY. Arthur explains how to find the ideal "hunting grounds" for sectors....
READ MORE
MEMBERS ONLY

6,555 Target Hit!
by Frank Cappelleri,
Founder & President, CappThesis, LLC
Despite skepticism, the S&P reached Frank's upside target of 6,555. Frank breaks down how we got here and what it means for ongoing market patterns....
READ MORE
MEMBERS ONLY
Is the SPX Exhausted?

by Joe Rabil,
President, Rabil Stock Research
This week, Joe breaks down the importance of focusing on Price and using indicators as supporting tools. He shows how the daily SPX chart has continued to make higher highs and higher lows, explaining that, as the ADX shows weakness, we need price to confirm this signal. Joe then covers...
READ MORE
MEMBERS ONLY

Where Has Industrials Leadership Gone? A Sector Drill Down
With Industrials now in consolidation mode, Mike highlights underperforming single-stock culprits and explains why the groundwork is in place for a late-year rally....
READ MORE
MEMBERS ONLY

The CPI is Coming Out Wednesday: Here is Something to Be Aware of
by Martin Pring,
President, Pring Research
As August CPI data looms, Martin looks at the chart and analyzes whether an upside reversal could be in the cards....
READ MORE
MEMBERS ONLY

NVIDIA Under Pressure: Eyeing a Near-Term Bearish Options Strategy
Mike spotlights a bearish NVDA options setup using StockCharts' OptionsPlay Strategy Center, and explains what could stir fresh volatility....
READ MORE
MEMBERS ONLY

The Best Five Sectors This Week, #35
by Julius de Kempenaer,
Senior Technical Analyst, StockCharts.com
Julius de Kempenaer presents his weekly update on the top five sectors on the leaderboard, and the movement under the surface....
READ MORE
MEMBERS ONLY
Calm Week, Uptrend Intact: Weekly Market Recap
by Jayanthi Gopalakrishnan,
Director of Site Content, StockCharts.com
This past week was relatively calm, except for Tuesday’s wobble. However, the market recovered from that selloff slowly and steadily; for a minute, it looked like we might finish the week in record territory. Although that didn’t happen, the uptrend in the big three indexes remains intact. It...
READ MORE
MEMBERS ONLY

Pullback or Pitfall? Let the 21-Day EMA Be Your Guide
by David Keller,
President and Chief Strategist, Sierra Alpha Research
Dave explains how the 21-day exponential moving average can help confirm trend phases, validate signals from other moving averages, and serve as an essential risk management tool for traders....
READ MORE
MEMBERS ONLY

Before CPI and PPI: 5 Things to Watch This Week
by Jayanthi Gopalakrishnan,
Director of Site Content, StockCharts.com
Rate cuts on deck? Look for these signals in small caps, TLT, gold, and more to help you position your portfolio ahead of this week's data....
READ MORE
MEMBERS ONLY

Major AI Announcement Sparks Repricing Across Tech Stocks
by Mary Ellen McGonagle,
President, MEM Investment Research
As Broadcom surges following the announcement of a $10 billion AI chip deal, Mary Ellen breaks down AVGO's technicals and what makes it a market leader....
READ MORE
MEMBERS ONLY

Tech Stocks Regain Their Uptrend!
by Mary Ellen McGonagle,
President, MEM Investment Research
This week, Mary Ellen digs into some of the impactful news that drove price action and what to be on the lookout for going forward. She also highlights the Technology sector’s move back into an uptrend and discusses the best ways to participate. In addition, Mary Ellen gives her...
READ MORE
MEMBERS ONLY

New Highs vs New Lows; XLC Goes Beast Mode; Risk is On; Dissecting Gold; A Cyber Setup
by Arthur Hill,
Chief Technical Strategist, TrendInvestorPro.com
This week, new highs are consistently outpacing new lows. The Communication Services sector is leading the pack, gold is surging, and there's a cybersecurity stock setting up for a big move. Read all about the stock market's price action here....
READ MORE
MEMBERS ONLY

The Market's Tug-of-War: How to Read the S&P 500's Hammer Signals
by Frank Cappelleri,
Founder & President, CappThesis, LLC
Back-to-back hammer candlesticks in the S&P 500 are sending a message. Here's what these signals mean, why the market feels stuck, and what investors should watch for next....
READ MORE
MEMBERS ONLY

The World is Breaking Out All Over
by Martin Pring,
President, Pring Research
A plethora of breakouts suggests that international markets have much further to run on the upside. Martin reviews where the principal regions of the world currently stand....
READ MORE
MEMBERS ONLY

Is a Bear Market Starting? History Says Watch These Months
by Tom Bowley,
Chief Market Strategist, EarningsBeats.com
Tom recaps the week as September trading begins with weakness across major indices. He reviews market performance, sector trends, and key stock action. From there, he turns his attention to the history of bear markets, pointing out when they historically start, and explains why current conditions, including strong accumulation trends...
READ MORE
MEMBERS ONLY

Stock Market Finds Its Footing: Why Friday’s Jobs Report Could Be the Real Test
by Jayanthi Gopalakrishnan,
Director of Site Content, StockCharts.com
Stocks rebounded after Tuesday’s dip, but Friday’s jobs report could be the real market mover. Here’s what investors need to watch.
...
READ MORE
MEMBERS ONLY

MACD Reverse Divergence: Hidden Power in the Charts
by Joe Rabil,
President, Rabil Stock Research
Joe shares a lesson on the MACD reverse divergence pattern—also known as hidden divergence—and explains why it can be a powerful signal in combination with low ADX or strong ADX conditions. He highlights multiple stock examples showing this setup, then reviews the S&P market conditions, discussing...
READ MORE
MEMBERS ONLY
The Best Five Sectors This Week, #34
by Julius de Kempenaer,
Senior Technical Analyst, StockCharts.com
Explore this week's sector rotation insights. See which sectors gained strength, which lost momentum, and what the RRG signals mean for investors....
READ MORE
MEMBERS ONLY

Mortgage Rates Hit 11-Month Low as Homebuilder Stocks Surge
With mortgage rates trending lower, homebuilder ETFs have been rising. Here's what traders and investors should watch next. ...
READ MORE
MEMBERS ONLY

AI Stocks Struggle as Nvidia Disappoints – What’s Filling the Void?
by Mary Ellen McGonagle,
President, MEM Investment Research
In this week’s show, Mary Ellen dives beneath the surface of the market as AI and semiconductor stocks lose momentum. New areas are beginning to take the lead, and Mary Ellen highlights strength in energy, gold, and select international markets, while pointing out where former leadership is breaking down....
READ MORE
MEMBERS ONLY

Full Rotations on One Side of an RRG
by Julius de Kempenaer,
Senior Technical Analyst, StockCharts.com
What does it mean when a rotation on a Relative Rotation Graph fully completes on the right-hand side or the left-hand side of the graph...
READ MORE
MEMBERS ONLY

Why This Lagging Stock Could Be on the Verge of Exploding
by Tom Bowley,
Chief Market Strategist, EarningsBeats.com
Tom spotlights a stock at a key crossroads and explains what to watch for amid some notable bullish signs....
READ MORE
MEMBERS ONLY

Week Ahead: Cautious Start Likely as Nifty Moves Towards This Crucial Support Zone

by Milan Vaishnav,
Founder and Technical Analyst, EquityResearch.asia and ChartWizard.ae
The Nifty is at a critical support level. A break below this level could mean a deeper correction....
READ MORE
MEMBERS ONLY
Stock Market Recap: August Ends Green
by Jayanthi Gopalakrishnan,
Director of Site Content, StockCharts.com
Just when it looked like August would end on a high note, stocks ran out of steam in the last leg. The major indexes closed lower on Friday, but the monthly performance wasn’t bad at all.
Monthly wrap:
* S&P 500 ($SPX): +1.91% (fourth straight monthly gain)...
READ MORE