MEMBERS ONLY
These Stocks Will Help You Hedge Against Inflation

by Mary Ellen McGonagle,
President, MEM Investment Research
As reported on Thursday, the rate of inflation in February rose to a 40-year high, with the U.S. facing even higher levels as the Russian war on Ukraine continues. Prices for oil, wheat and other commodities impacted by the war have already risen to decade-highs, with many metals reaching...
READ MORE
MEMBERS ONLY

The Line in the Sand for AAPL

by David Keller,
President and Chief Strategist, Sierra Alpha Research
The major equity averages finished the week in a position of weakness, with the S&P 500 index once again testing the key support level of 4200.
We've talked about the 4200 level many times for the S&P 500, most recently in terms of that...
READ MORE
MEMBERS ONLY

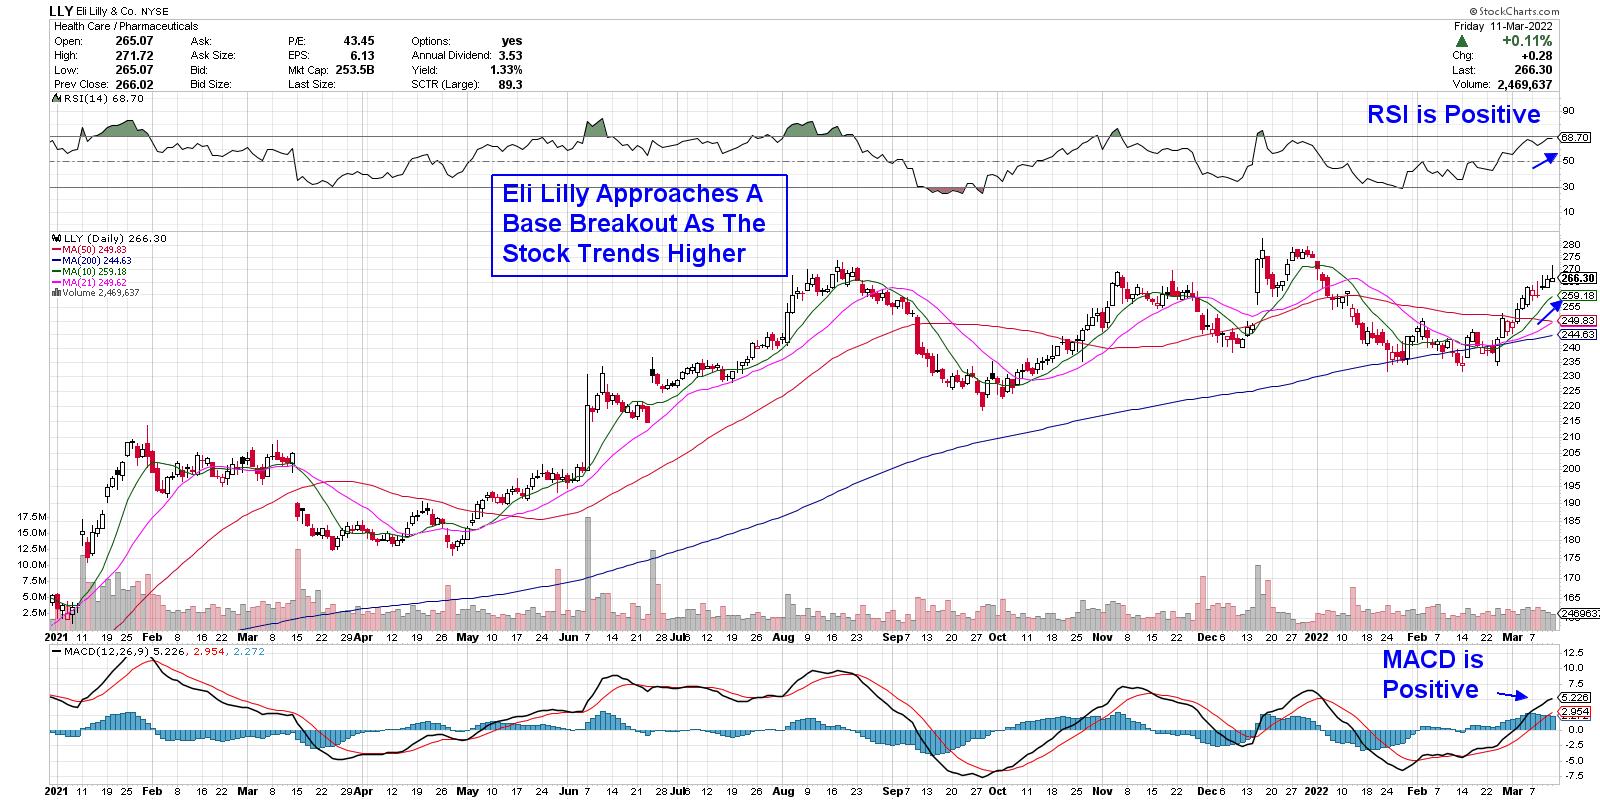
How to Trade the Pullback in Hot Stocks
by Mary Ellen McGonagle,
President, MEM Investment Research
On this episode of StockCharts TV'sThe MEM Edge, Mary Ellen reviews the rotation that continues to take place as the markets grapple with inflation and rate hike fears. She also shares how to trade the pullback in stocks on the move.
This video was originally recorded on March...
READ MORE
MEMBERS ONLY
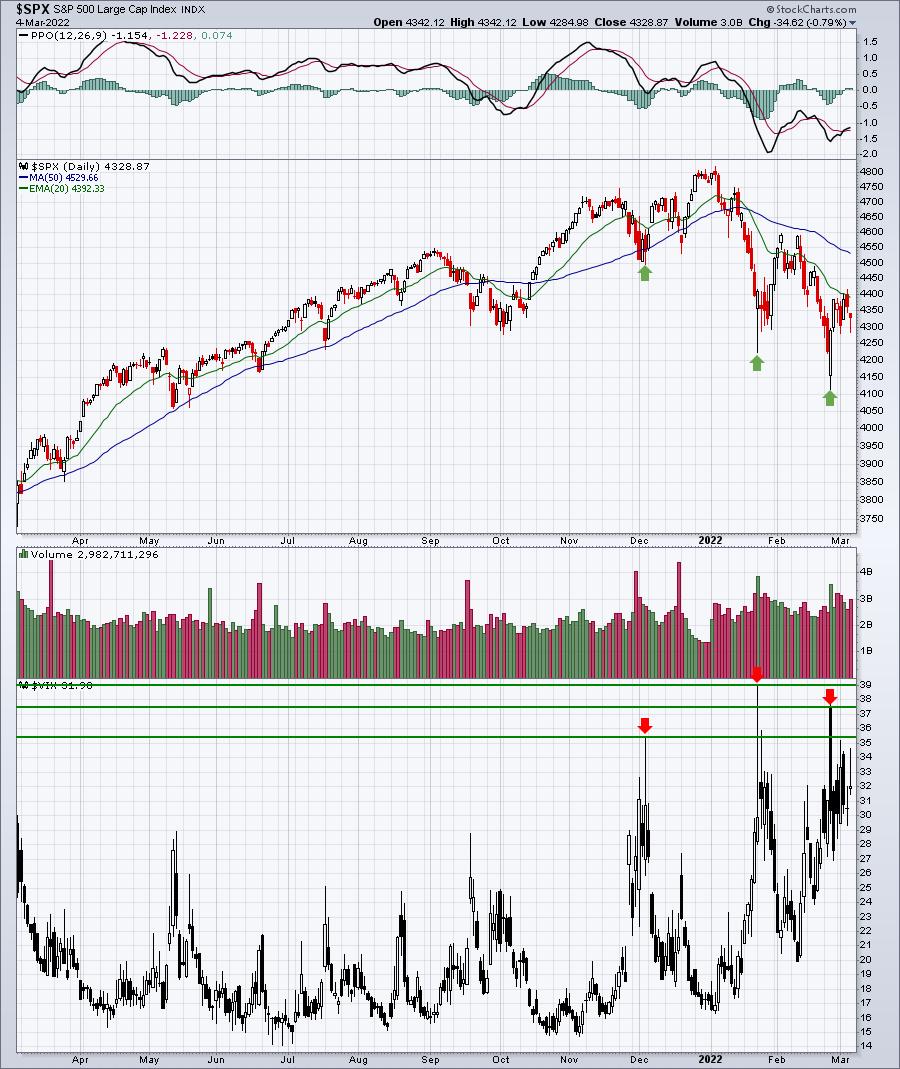
Bottom Approaching, But One More Painful Leg Lower Remains

by Tom Bowley,
Chief Market Strategist, EarningsBeats.com
We saw the latest CPI report (February) released on Thursday. It came in about as expected, with the February Core CPI rising 0.5%, matching consensus estimates. That sent the annual core inflation rate HIGHER (as I've previously suggested) to 6.4%, the highest rate we've...
READ MORE
MEMBERS ONLY
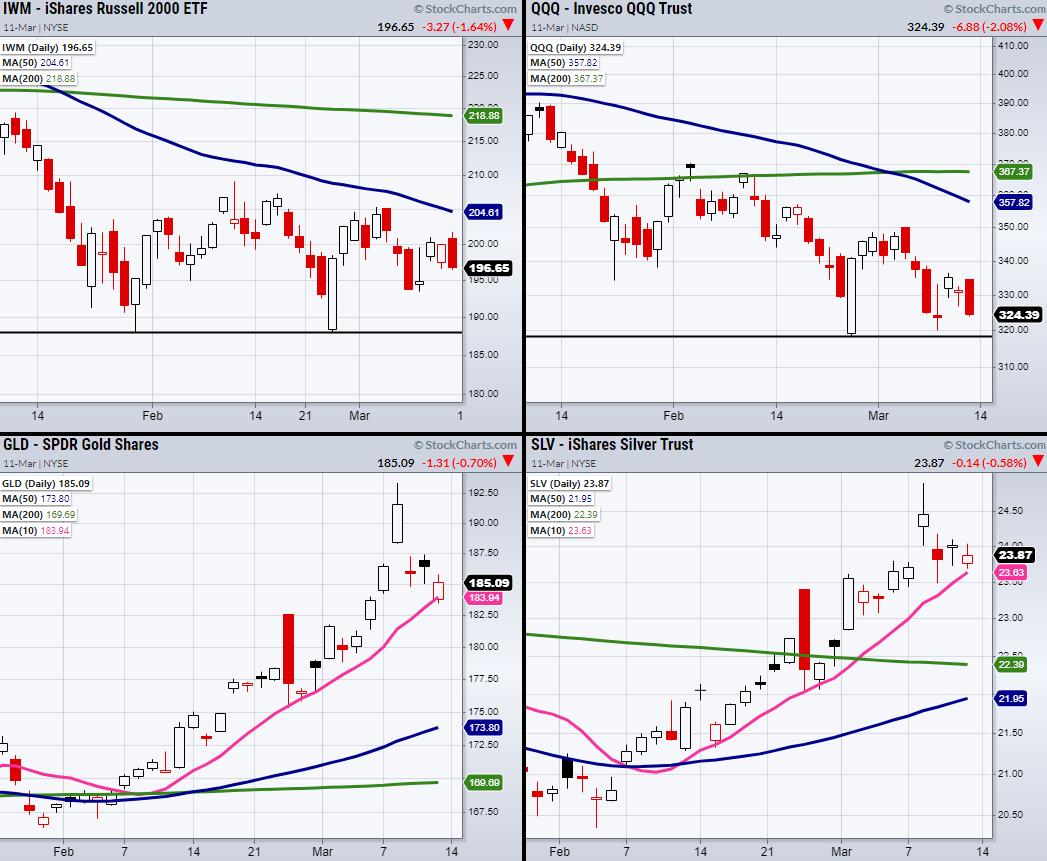
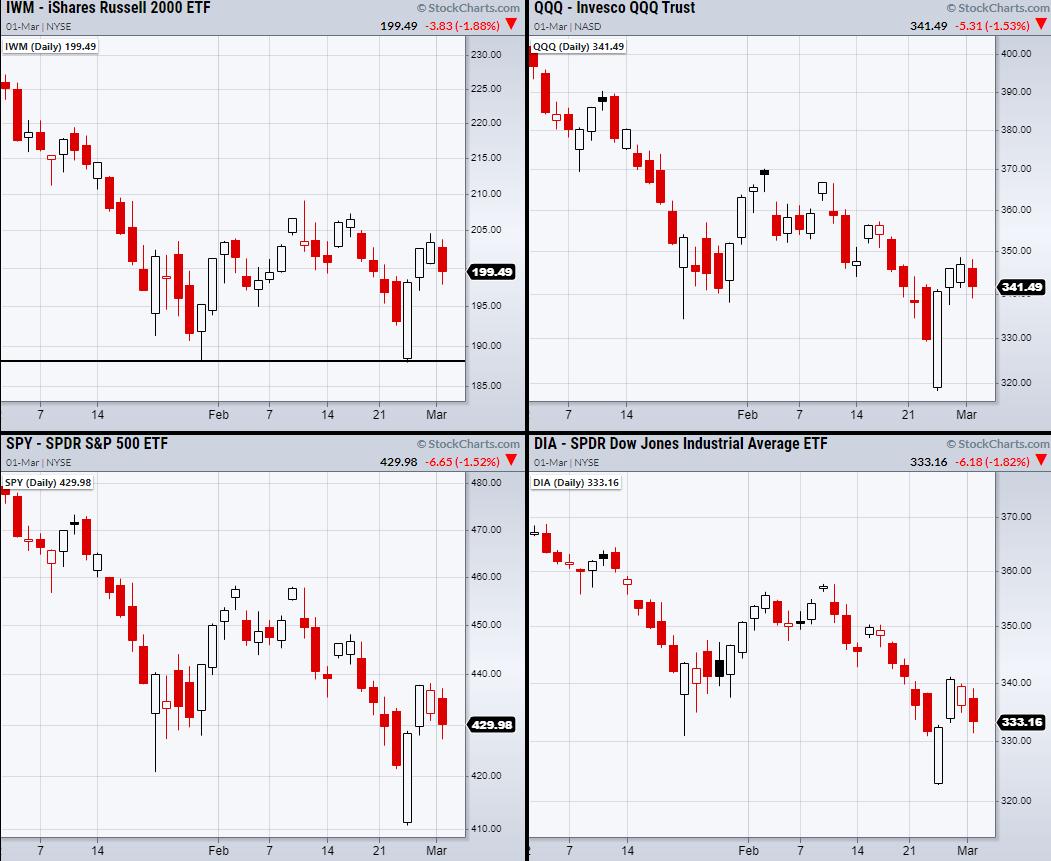
Strength in Commodities Ends the Week
Major indices end on a weak note, with the Russell 2000 (IWM) and the Nasdaq 100 (QQQ) closing down 1.5%. With that said, gold (GLD) and silver (SLV), while down half a percent, are holding a strong uptrend over their 10-day moving average. Soft commodities are also sitting in...
READ MORE
MEMBERS ONLY
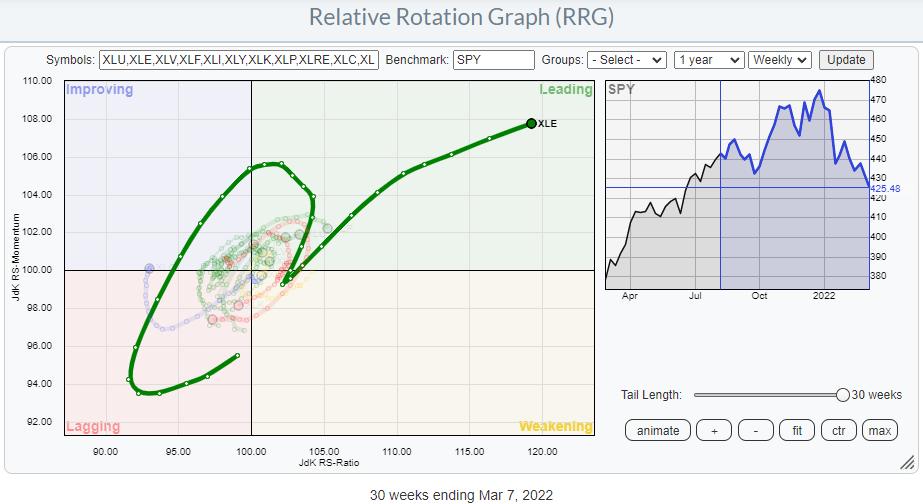
Which Energy Stocks Should You Be Watching?

by Julius de Kempenaer,
Senior Technical Analyst, StockCharts.com
It's very clear that the Energy sector is the strongest sector inside the S&P 500 over the last several months.
The tail on the Relative Rotation Graph above shows the rotation that the sector went through. The "hook" back up to leading from weakening...
READ MORE
MEMBERS ONLY

Sideways Market

by TG Watkins,
Director of Stocks, Simpler Trading
In this week's edition of Moxie Indicator Minutes, TG explains how the market is doing its best to stay afloat and has handled a lot of bad news. Right now, it doesn't seem interested in going much lower. The UVXY seems to be indicating that there...
READ MORE
MEMBERS ONLY

Blow-Off Top or Trend Acceleration?

by Alex Cole,
Co-founder, GoNoGo Charts®

by Tyler Wood,
Co-founder, GoNoGo Charts®
In this week's edition of the GoNoGo Charts show, Alex and Tyler discuss how volatility continues to deliver Fear, Uncertainty and Doubt to investors as the world deals with accelerating inflation and open war against Ukraine. Treasury bond prices remain in a strong "NoGo" trend, painting...
READ MORE
MEMBERS ONLY

Counter Trend Trading Tactics

by Joe Rabil,
President, Rabil Stock Research
In this week's edition of Stock Talk with Joe Rabil, Joe shows how he would go about taking a counter trend trade by using multiple time frame analysis. He starts with a weekly chart and works down to a 10-minute showing the fractal nature of the markets and...
READ MORE
MEMBERS ONLY
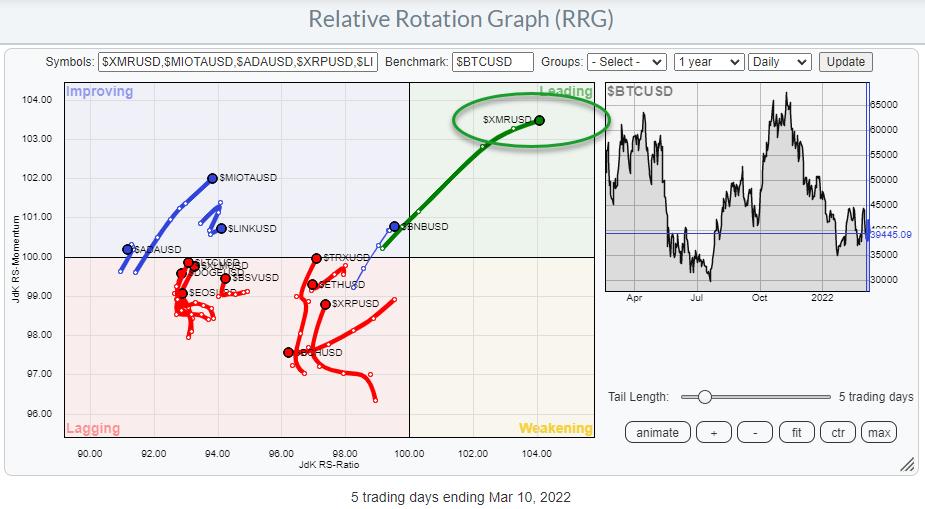
Monero (XMR) Starting To Lead Against BTC
by Julius de Kempenaer,
Senior Technical Analyst, StockCharts.com
The Relative Rotation Graph above shows the rotation for a group of cryptocurrencies against BTC on a daily time frame. Looking at this chart, the tail for $XMRUSD stands out. Almost all the tails are traveling in an NW direction, which means that they are improving against BTC. However, the...
READ MORE
MEMBERS ONLY

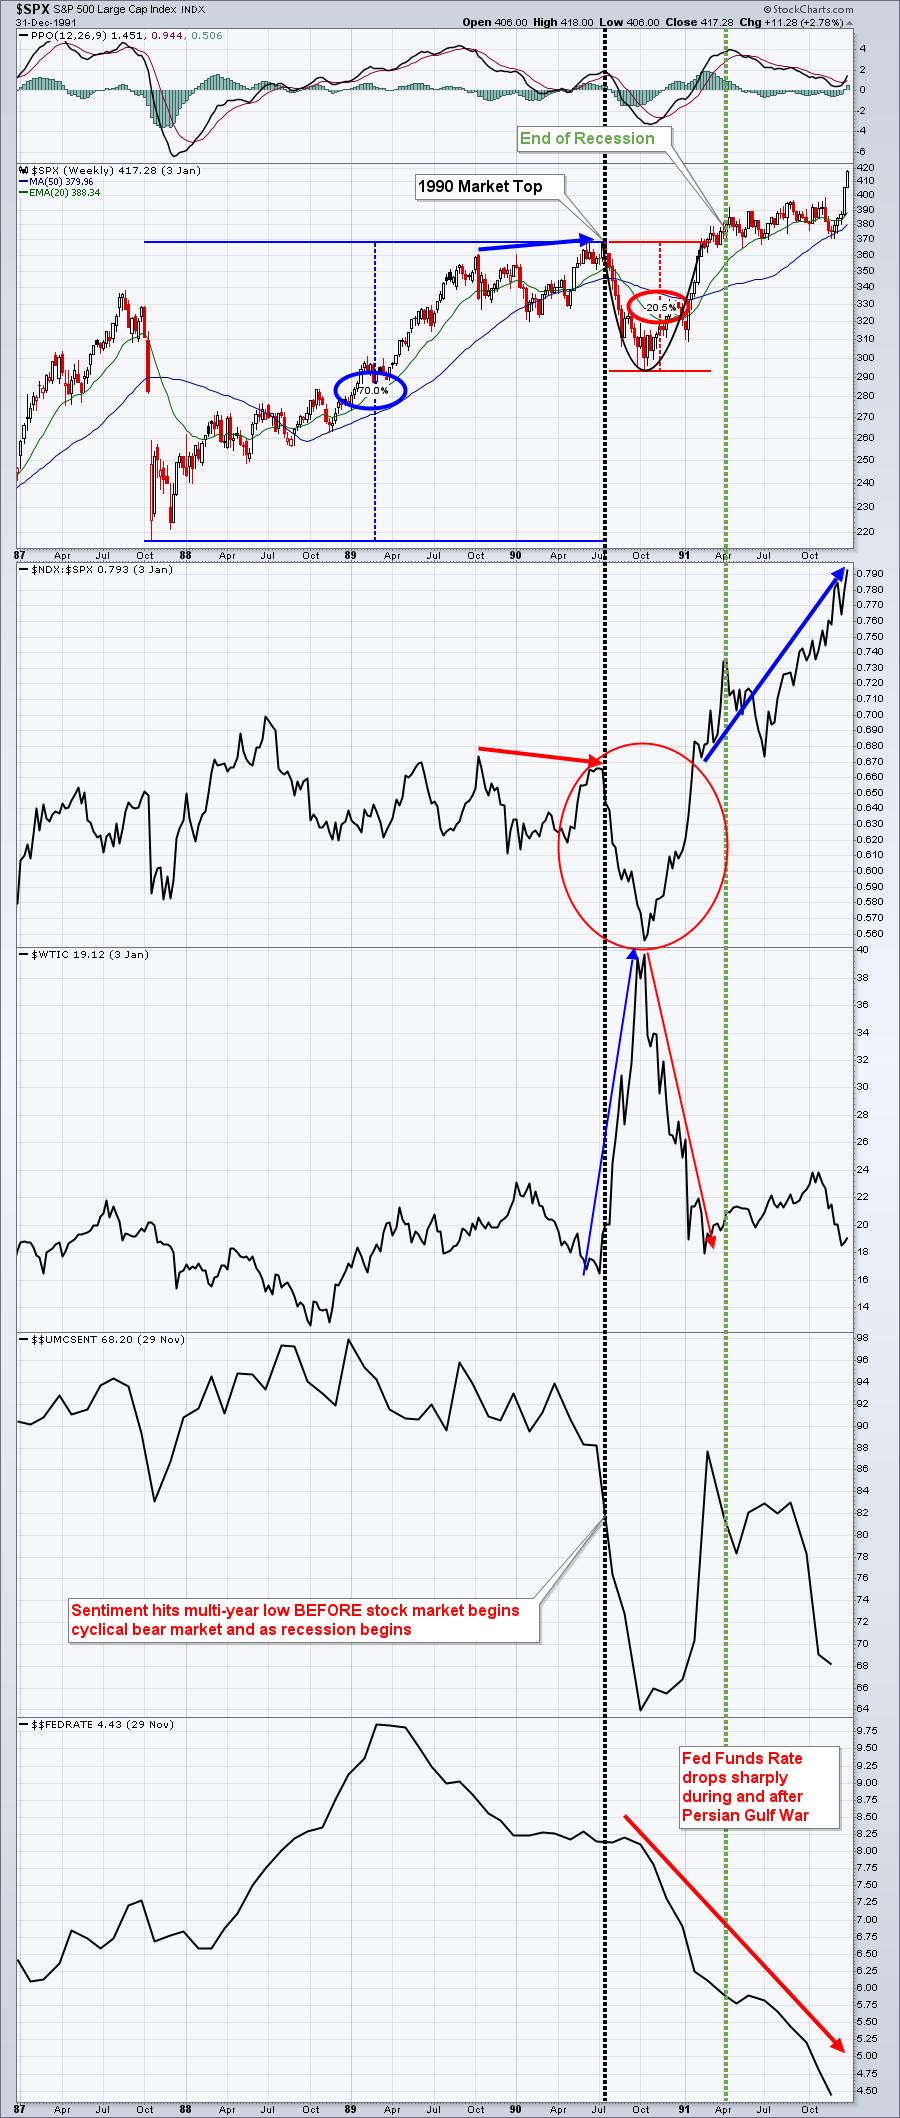
SURGE IN COMMODITY PRICES IS TYPICAL LATE - CYCLE BEHAVIOR

by John Murphy,
Chief Technical Analyst, StockCharts.com
STOCKS USUALLY PEAK AFTER BONDS... One of the most important features of intermarket analysis is the rotation that normally takes place between bonds, stocks, and commodities at major turning points in the business cycle. That rotation between the three asset classes is especially relevant to the current global situation. Those...
READ MORE
MEMBERS ONLY

Don't Be Fooled by a One-Day 2.5% Jump
by Julius de Kempenaer,
Senior Technical Analyst, StockCharts.com
Yesterday (Wed 3/9), the S&P bounced up around 2.5%... And although it is a nice jump after all the declines we have seen recently, it doesn't impress me much. At least not enough to get very bullish again all of a sudden.
Of course,...
READ MORE
MEMBERS ONLY
Oil Drops and the Russell 2000 (IWM) Rallies Towards Resistance
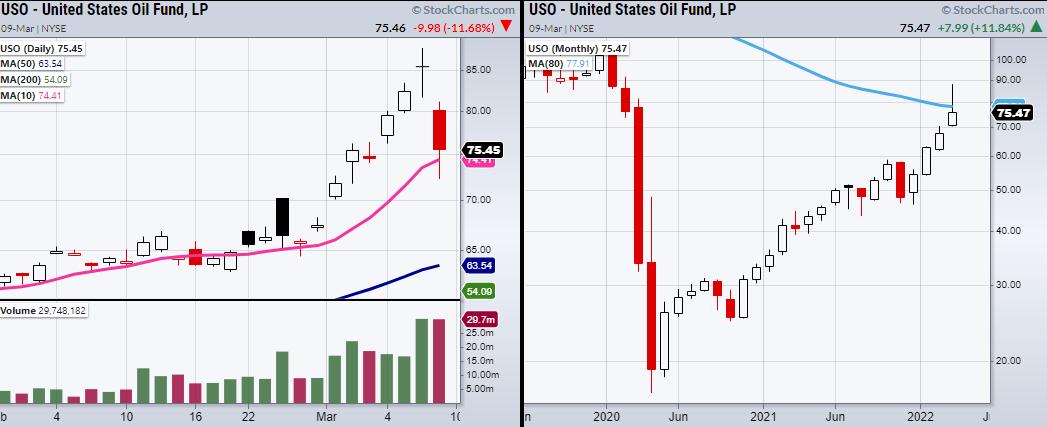
Oil is making a reversal pattern and rejecting its 80-month moving average; however, will the overall trend stay intact, or has Wednesday signified an end to the crazy oil rally?
Looking at the above chart of the United States Oil Fund (USO), we can see a large amount of volume...
READ MORE
MEMBERS ONLY

If You Can't Handle the Truth

by Dave Landry,
Founder, Sentive Trading, LLC
On this week's edition of Trading Simplified, Dave kicks off thie episode with Mystery Charts and Methodology In Action. He then continues with his discussion on surviving and prospering in a bear market.
This video was originally broadcast on March 9, 2022. Click anywhere on the Trading Simplified...
READ MORE
MEMBERS ONLY

Flight Path: Oil Continues to Lead + Using Multiple Time Frames to Help with Entries
by Alex Cole,
Co-founder, GoNoGo Charts®
by Tyler Wood,
Co-founder, GoNoGo Charts®
Good morning and welcome to this week's Flight Path, originally posted Monday, March 7th. Let's look at the below GoNoGo Asset Map for this week. The top panel shows that the trend in U.S. equities has remained a "NoGo", albeit painting paler pink...
READ MORE
MEMBERS ONLY
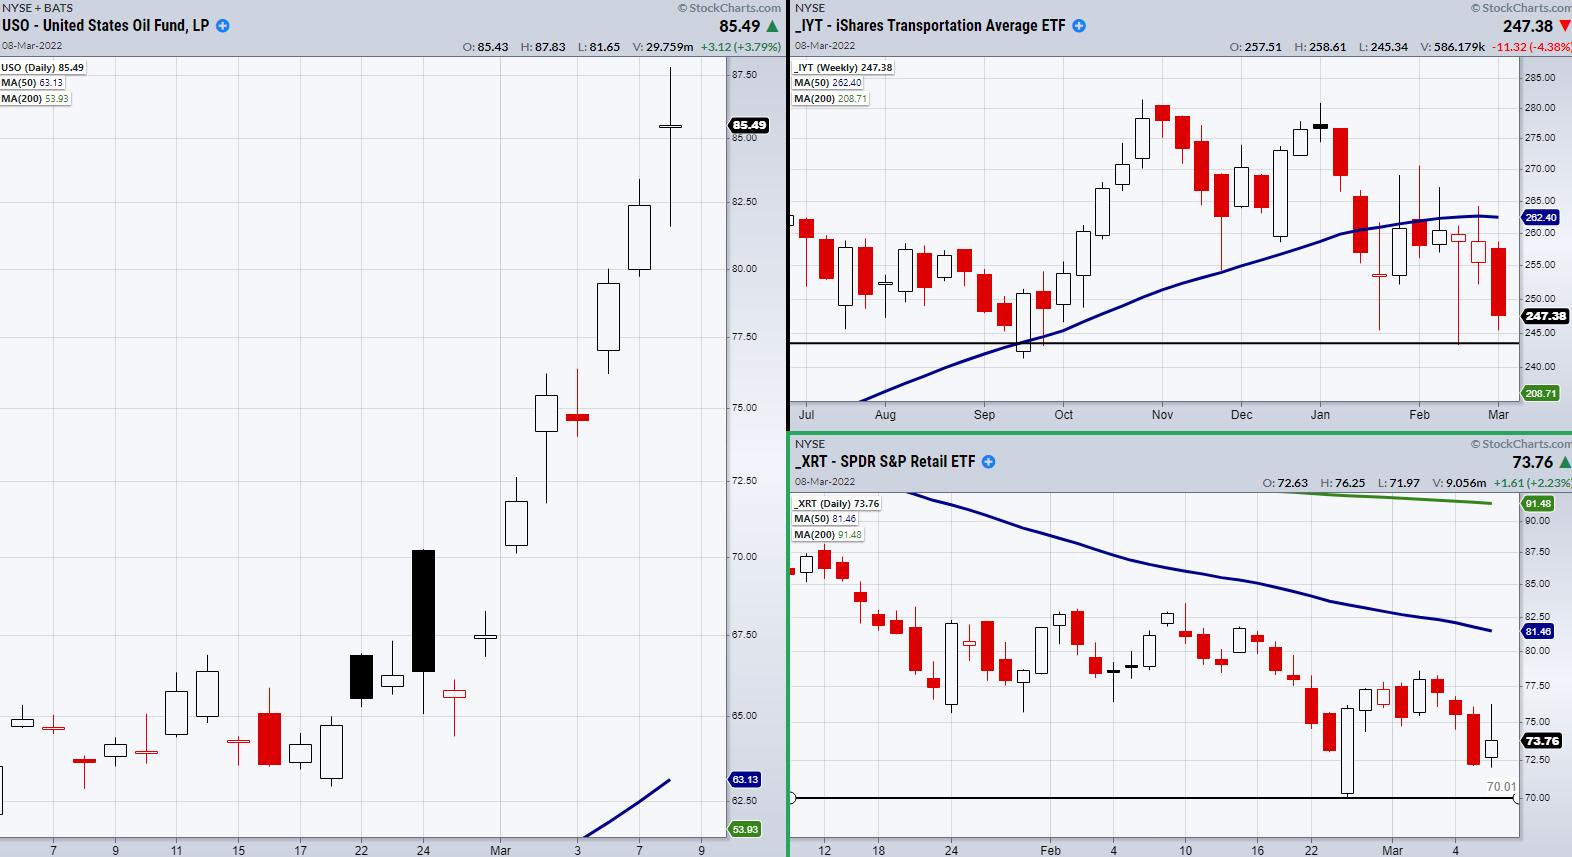
Are Transportation and the Retail Space in Danger? + See Mish on The Pitch and More!
After oil surges in volume from the U.S import ban on Russian oil, the Oil ETF (USO) closed roughly unchanged from its opening price. This makes USO interesting to watch for Wednesday's trading session, since the price action shows a large battle between buyers and sellers remains...
READ MORE
MEMBERS ONLY

Sector Spotlight: Energy and Utilities Jump Amid Market Mayhem
by Julius de Kempenaer,
Senior Technical Analyst, StockCharts.com
In this edition of StockCharts TV's Sector Spotlight, after another volatile week, I take a look at rotations as they unfolded in Asset Classes and sectors where I find defensive sectors topping the charts. Following the events in Eastern Europe between Russia and Ukraine, I take another look...
READ MORE
MEMBERS ONLY

DP TV: Carl's 70-50 Chart Pattern Rule

by Erin Swenlin,
Vice President, DecisionPoint.com

by Carl Swenlin,
President and Founder, DecisionPoint.com
On this episode of DecisionPoint, Carl takes center stage, bringing his "70-50 Chart Pattern Rule" -- experienced-based analysis of determining follow-through on a chart pattern -- to the table. He walks viewers through the mega-cap stocks, the FAANG, as well as Tesla (TSLA). He reviews the status of...
READ MORE
MEMBERS ONLY

A Tale of Two Sectors

by Martin Pring,
President, Pring Research
The Business Cycle and Sector Rotation
The business cycle undergoes a set series of chronological events which are also related to primary trend peaks in bonds stocks and commodities, as laid out in Figure 1. You can read about this concept in greater detail here. Based on the position of...
READ MORE
MEMBERS ONLY
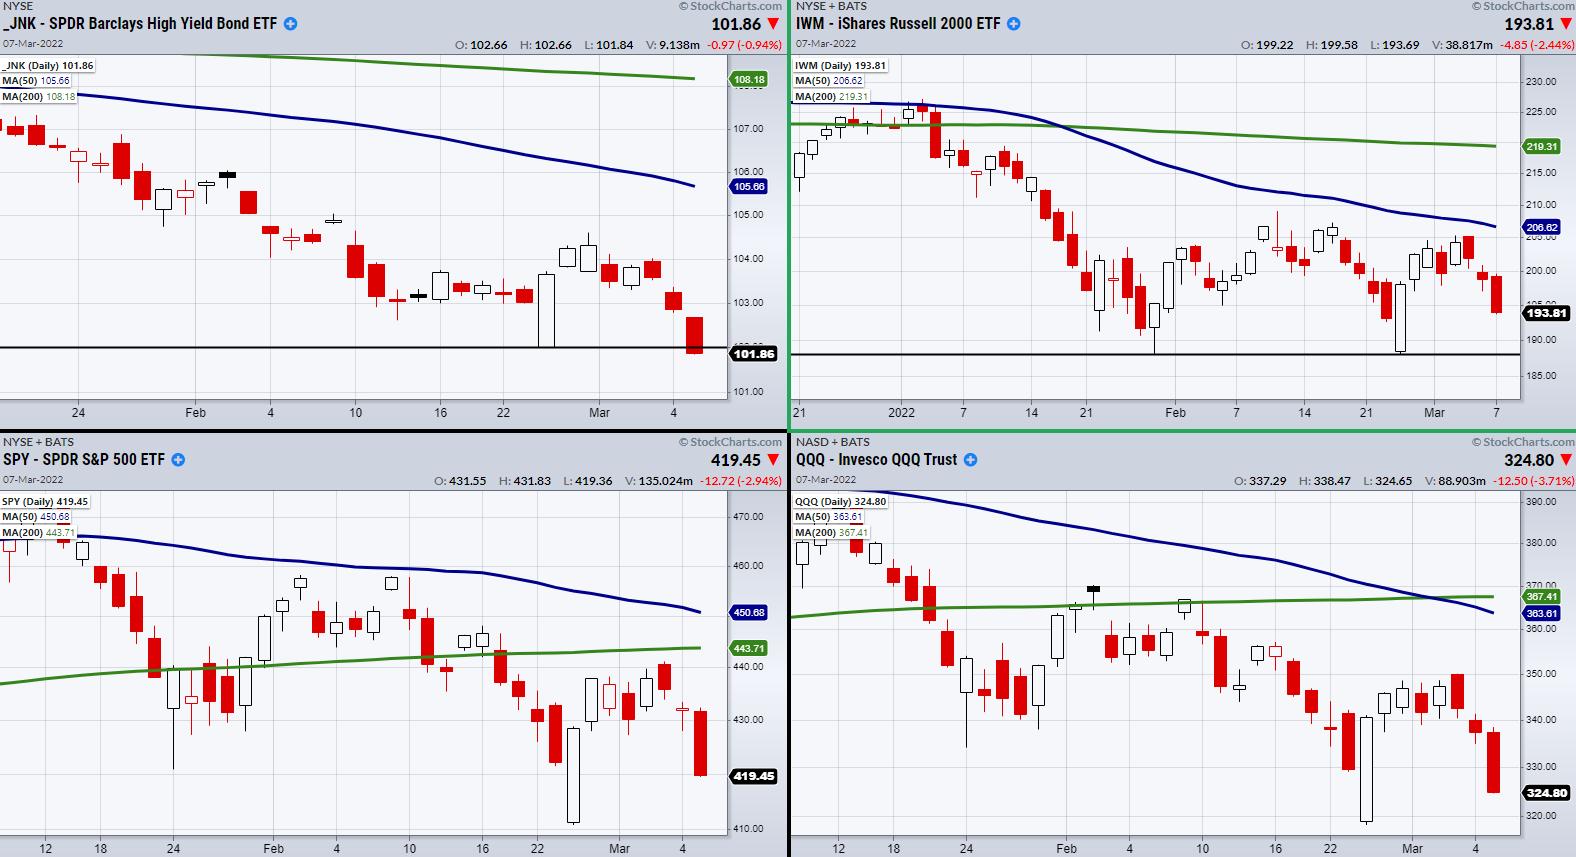
Are U.S Treasury Bonds (TLT) a Lagging Safety Play?
The U.S stock market continues to display pressure from the Russian—Ukraine war.
Additionally, High Yield Corporate Debt (JNK) broke support from its recent lows at $101.99.
Because we frequently use JNK as a risk on/off indicator, next we should watch for the major indices to break...
READ MORE
MEMBERS ONLY
Sentiment and Channel Resistance Remain Two Big Issues
by Tom Bowley,
Chief Market Strategist, EarningsBeats.com
Once a short-term transition from overly bullish to overly bearish begins, sentiment and channel lines can be your two best friends to help you keep your sanity. Whatever you do, turn off the media or you'll be waiting for The Great Depression 2.0. I've always...
READ MORE
MEMBERS ONLY

Fear and Greed

by Greg Morris,
Veteran Technical Analyst, Investor, and Author
I cannot tell you the number of times an investor has asked, "Considering the difficulties of the past few months, do you still believe in your investment process?" These questions always concerned me because I never once considered not believing in my process for managing money just because...
READ MORE
MEMBERS ONLY
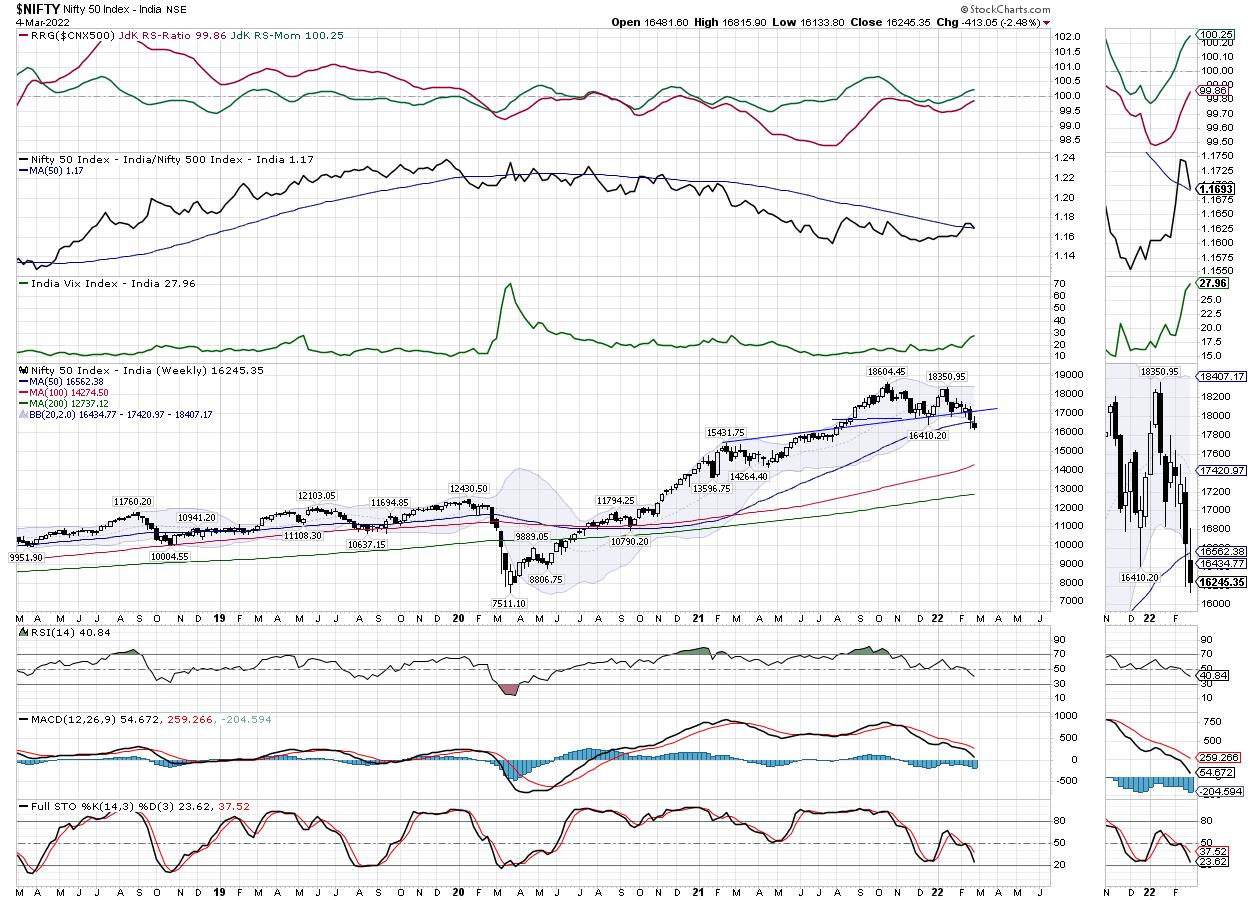
Week Ahead: NIFTY Remains Fluid, Influenced by Geopolitical Tensions; These Sectors May Play Catchup if Pullback Occurs

by Milan Vaishnav,
Founder and Technical Analyst, EquityResearch.asia and ChartWizard.ae
Geopolitics. This was the only factor that continued to hold the global equity markets at ransom; it continued to fracture the sentiments of the markets and India was no exception. With the war between Russia and Ukraine showing no signs of slowing down, the equity markets, both global and domestic,...
READ MORE
MEMBERS ONLY
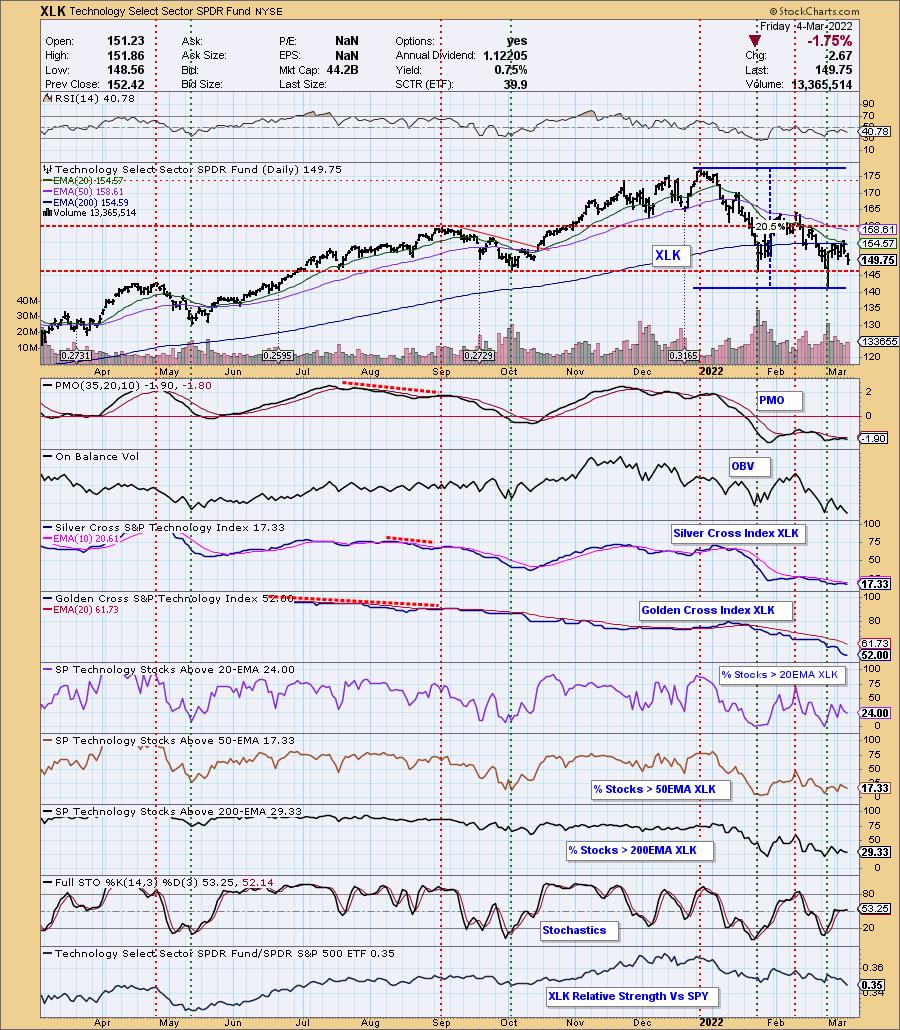
Technology Sector and Tech Indexes in "Official" Bear Markets
by Erin Swenlin,
Vice President, DecisionPoint.com
by Carl Swenlin,
President and Founder, DecisionPoint.com
It occurred to us, after we discussed the "Death Crosses" (50-day EMA dropping below the 200-day EMA) on the NDX and Nasdaq 100 in yesterday's subscriber-only DecisionPoint Alert, that we should investigate the actual damage done. The tech-heavy NDX and Nasdaq 100 are in bear markets,...
READ MORE
MEMBERS ONLY

Sushi Investing, Part 3: A Final Chapter Of The Secrets To Selling

by Gatis Roze,
Author, "Tensile Trading"
For those of you who've been investing for decades, you'll immediately grasp the significance and truth of Market Wizard Stanley Druckenmiller's quote: "Every great money manager I've ever met, all they want to talk about is their mistakes. There's...
READ MORE
MEMBERS ONLY
Timing Entries for Fast-Paced Hot Sectors
The past couple of weeks have given us a new range to watch in the stock market.
A positive jobs report has been seemingly muted by indecision within the major indices. Therefore, we can look at the new ranges the Russell 2000 (IWM) has formed, along with watching the S&...
READ MORE
MEMBERS ONLY
Silver Plays Catchup with the Other Commodities

by Arthur Hill,
Chief Technical Strategist, TrendInvestorPro.com
The pickings are rather slim in the market with just 61 of the 276 ETFs in the TrendInvestorPro Master List in uptrends. Unsurprisingly, most of the ETFs in uptrends are related to commodities (energy, metals, agriculture). Outside of commodities, we are seeing uptrends in ETFs related to consumer staples, utilities,...
READ MORE
MEMBERS ONLY

Three Implications if Commodities Outperform Stocks
by Martin Pring,
President, Pring Research
Chart 1 shows that, starting in early 2020, stocks began to slowly but quietly underperform commodities. Since the start of this year, though, this trend has begun to really accelerate on the downside, i.e. moving in favor of commodities. The center window also shows that, when a lengthy trendline...
READ MORE
MEMBERS ONLY
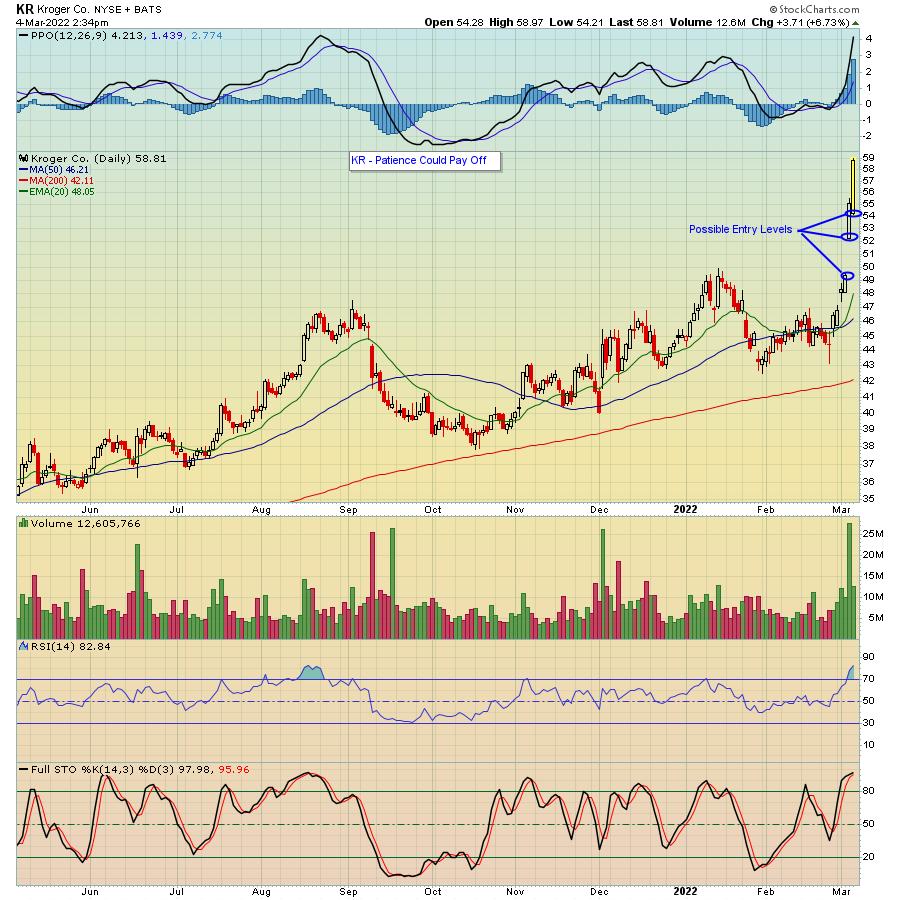
A Few Diamonds in the Rough

by John Hopkins,
President and Co-founder, EarningsBeats.com
With the market in turmoil and volatility at a very high level, traders continue to be stymied -- it's tough to make any money unless you are decidedly short. But, underneath the surface there are still some stocks that continue to perform extremely well, or could be close...
READ MORE
MEMBERS ONLY
Are We Heading Up?
by TG Watkins,
Director of Stocks, Simpler Trading
In this week's edition of Moxie Indicator Minutes, TG walks through the current state of the market. As of now, the market is still really difficult and messy. He then talks about where he thinks the market is headed next, including his explanation as to why he thinks...
READ MORE
MEMBERS ONLY

GLOBAL STOCKS REMAIN UNDER PRESSURE AS CRUDE OIL TESTS OVERHEAD RESISTANCE -- GRAIN PRICES ARE ALSO SURGING
by John Murphy,
Chief Technical Analyst, StockCharts.com
WEST TEXAS CRUDE OIL REACHES 11-YEAR HIGH... The war in Ukraine continues to push oil prices sharply higher along with other commodities. That includes metals and agricultural products. Gold continues to gain ground as a traditional haven during times of rising inflation and increased global tensions. Some defensive money is...
READ MORE
MEMBERS ONLY
Inflation Invasion Relation
by Alex Cole,
Co-founder, GoNoGo Charts®
by Tyler Wood,
Co-founder, GoNoGo Charts®
What is clear about the US Equity markets' trend is that it is down, with a series of lower highs and lower lows despite the tremendous volatility of last week. The GoNoGo Oscillator is testing the zero-line from below, and while the trend condition is in its weaker pink...
READ MORE
MEMBERS ONLY
Deterioration in the DJIA Stocks?
by Joe Rabil,
President, Rabil Stock Research
In this week's edition of Stock Talk with Joe Rabil, Joe shows the short-, intermediate- and long-term trends for all the components of the DJIA. This is a good process to use for a bottom-up evaluation of any market. He then analyzes the requests that came through, as...
READ MORE
MEMBERS ONLY
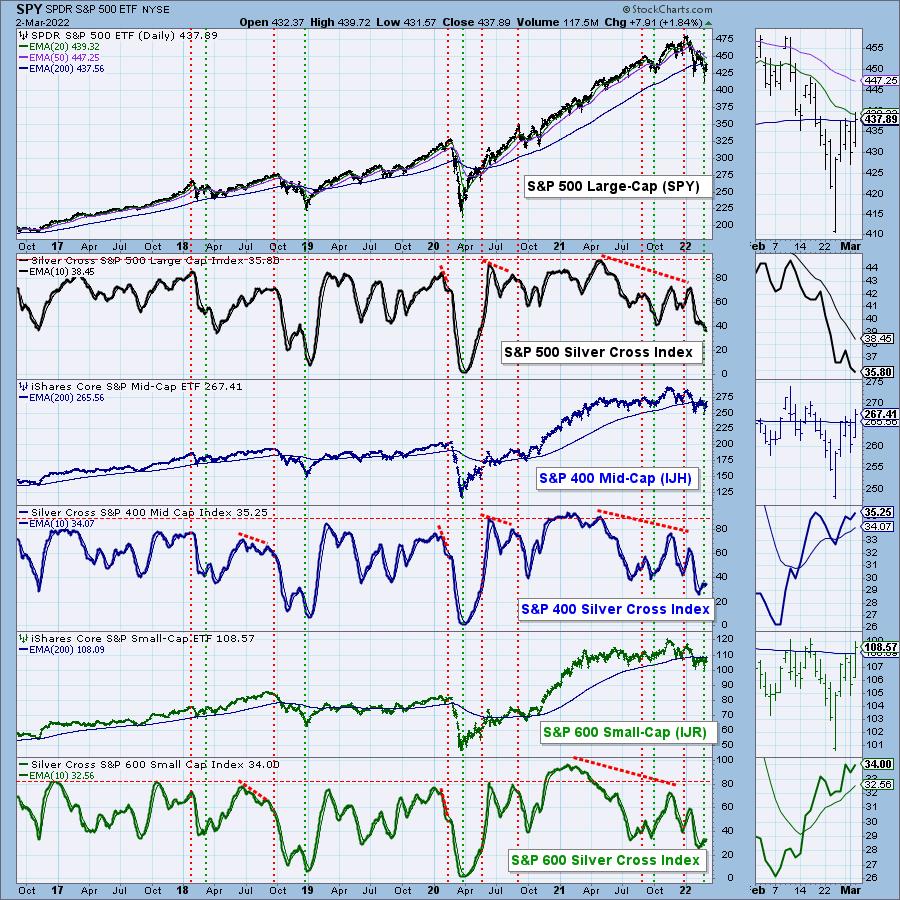
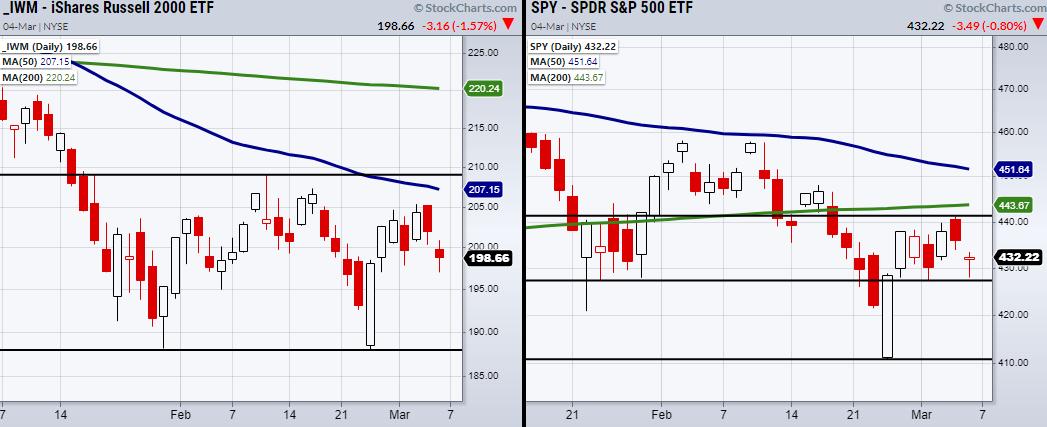
Smaller-Cap Stocks Could Hold the Advantage on Large-Caps
by Erin Swenlin,
Vice President, DecisionPoint.com
I remember years ago, when I was doing the flagship (now defunct) MarketWatchers LIVE show on StockCharts TV, Tom Bowley mentioned that, when the Dollar began to rise, it can hurt global companies (most are large-cap). Their exposure to buying overseas puts them at a disadvantage when the Dollar rises....
READ MORE
MEMBERS ONLY

How These 3 Symbols Can Guide Us Through the Trading Week
Geopolitical stress from the Russia/Ukraine situation piles onto the market and the Fed, which is now faced not only with worries of the U.S inflation numbers, but also extra price surges in energy. Though the Fed has already scheduled rate increases through this year, the development and quick...
READ MORE
MEMBERS ONLY
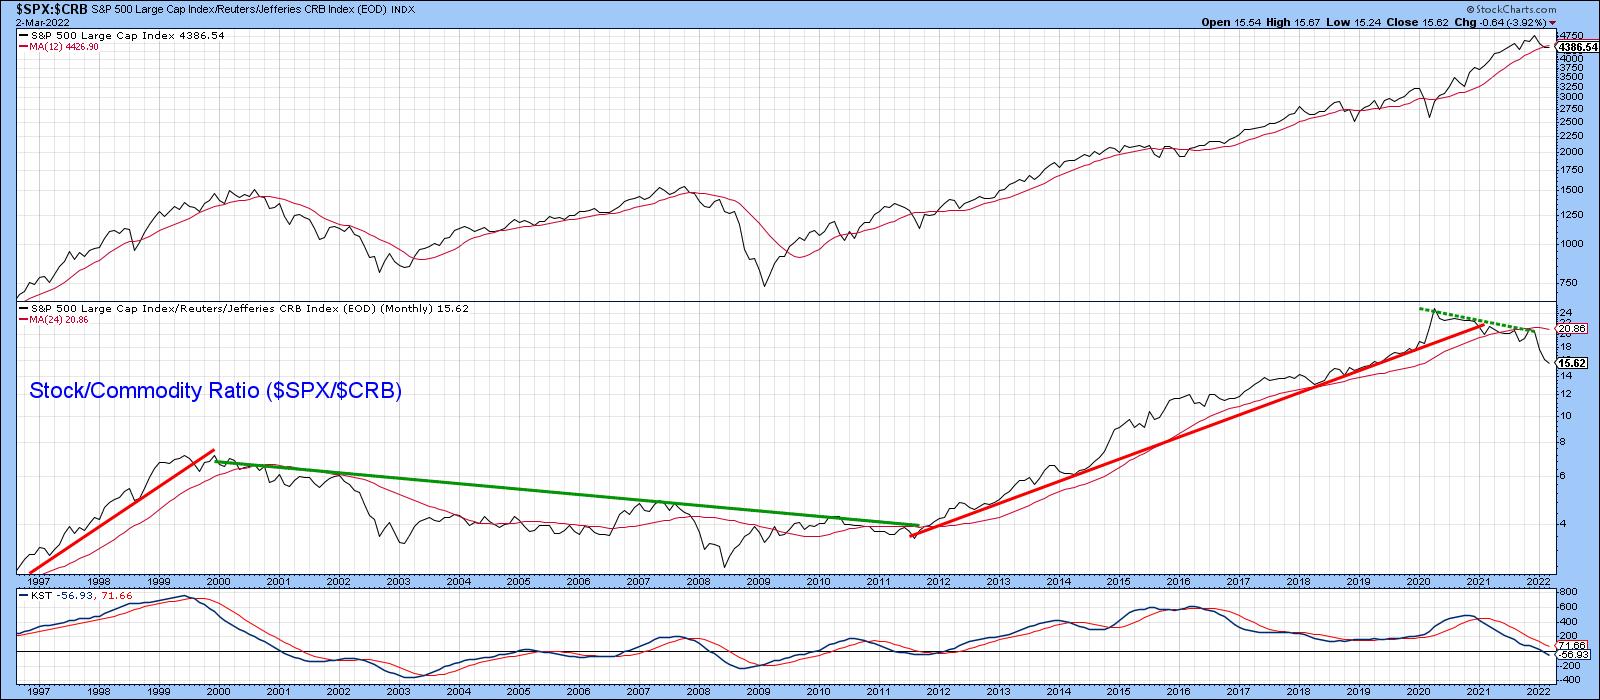
Three Implications if Commodities Outperform Stocks
by Martin Pring,
President, Pring Research
Chart 1 shows that, starting in early 2020, stocks began to slowly but quietly underperform commodities. Since the start of this year, though, this trend has begun to really accelerate on the downside, i.e. moving in favor of commodities. The center window also shows when a lengthy trendline of...
READ MORE
MEMBERS ONLY
Prospering During a Bear Market
by Dave Landry,
Founder, Sentive Trading, LLC
When the market gets "iffy", it's important to talk about surviving and prospering during a bear market. On this week's edition of Trading Simplified, Dave outlines key guidelines to follow and set yourself up for success.
This video was originally broadcast on March 2,...
READ MORE
MEMBERS ONLY
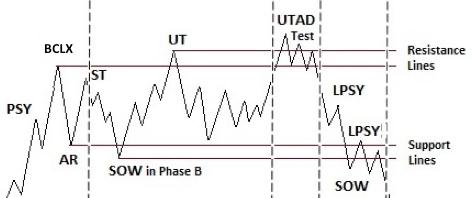
Distribution or Re-Accumulation?

by Bruce Fraser,
Industry-leading "Wyckoffian"
Join Johni Scan and me for Monday's (2/28/2022) "Your Daily Five" where we focus on Distribution and Re-Accumulation characteristics. Both begin in nearly the same manner but conclude very differently. A Re-accumulation is a range-bound condition that forms after an uptrend. It is a...
READ MORE
MEMBERS ONLY
Can the Stock Market Hold Up if Commodities Soar?
Last week, the major indices made a successful rally back into a short-term support area. However, many see the price move as a rally back into a volatile resistance zone, leading people to believe we could again see the market break lower.
While this could be the case, as the...
READ MORE
MEMBERS ONLY
Sector Spotlight: Long-Term Sector Trends are Fading
by Julius de Kempenaer,
Senior Technical Analyst, StockCharts.com
In this edition of StockCharts TV's Sector Spotlight, as it is the first Tuesday of the month, I take on the monthly charts for February. After a short look at the current rotations for Asset Classes and Sectors, I jump into the long-term trends as they are unfolding...
READ MORE
