MEMBERS ONLY
Why High Yield Corporate Debt (JNK) Needs to Fill the Gap
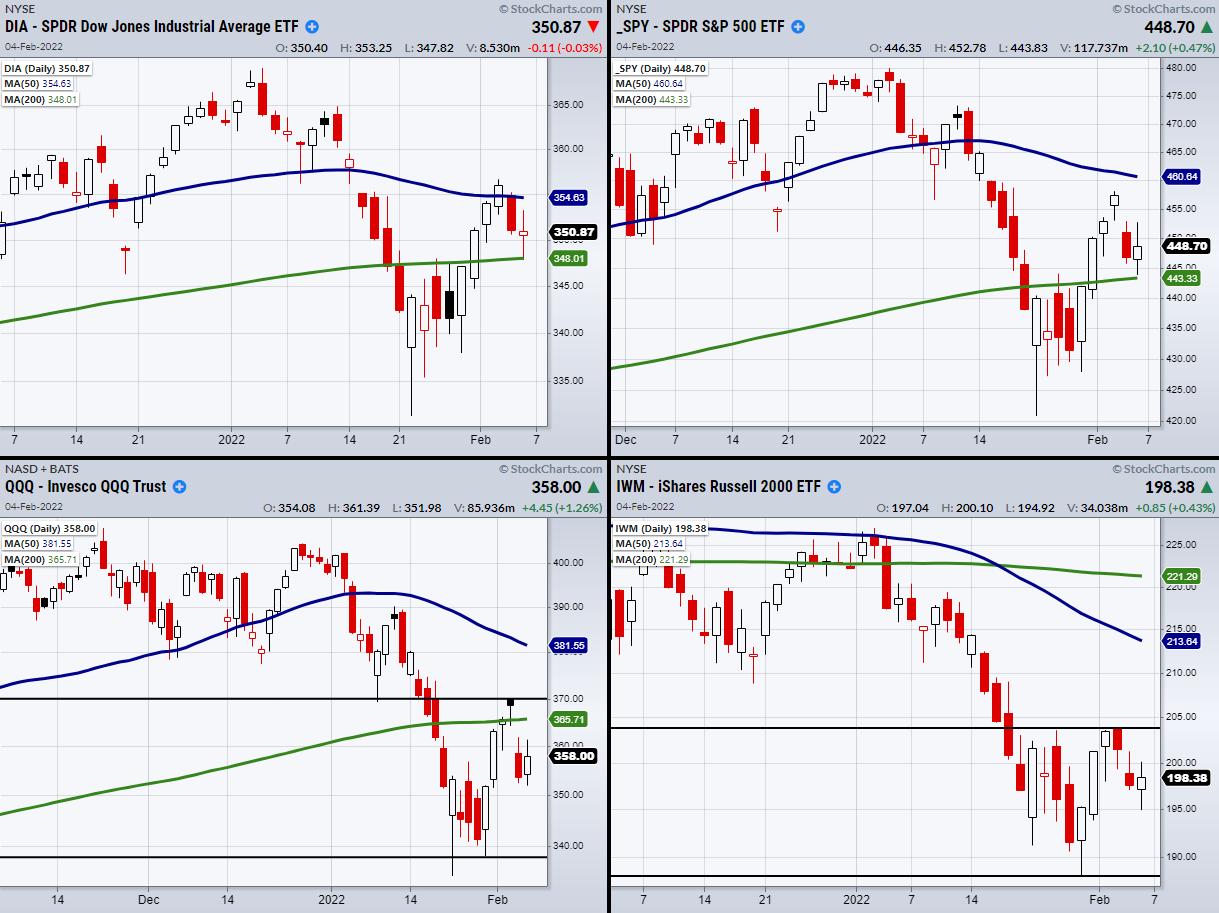
Friday ends on a positive note, with the Dow Jones (DIA) and the S&P 500 (SPY) holding over their 200-day moving averages. Alongside them, Bitcoin has cleared 40k and is currently looking for 41k next. However, High Yield Corporate Debt (JNK) gapped lower Friday, creating a key area...
READ MORE
MEMBERS ONLY

Earnings Season Rocking Markets

by TG Watkins,
Director of Stocks, Simpler Trading
In this week's edition of Moxie Indicator Minutes, TG covers the insane market action of the last several days. We are in the midst of earnings season and the reports that came out rocked the market. How were things affected?
This video was originally broadcast on February 4,...
READ MORE
MEMBERS ONLY
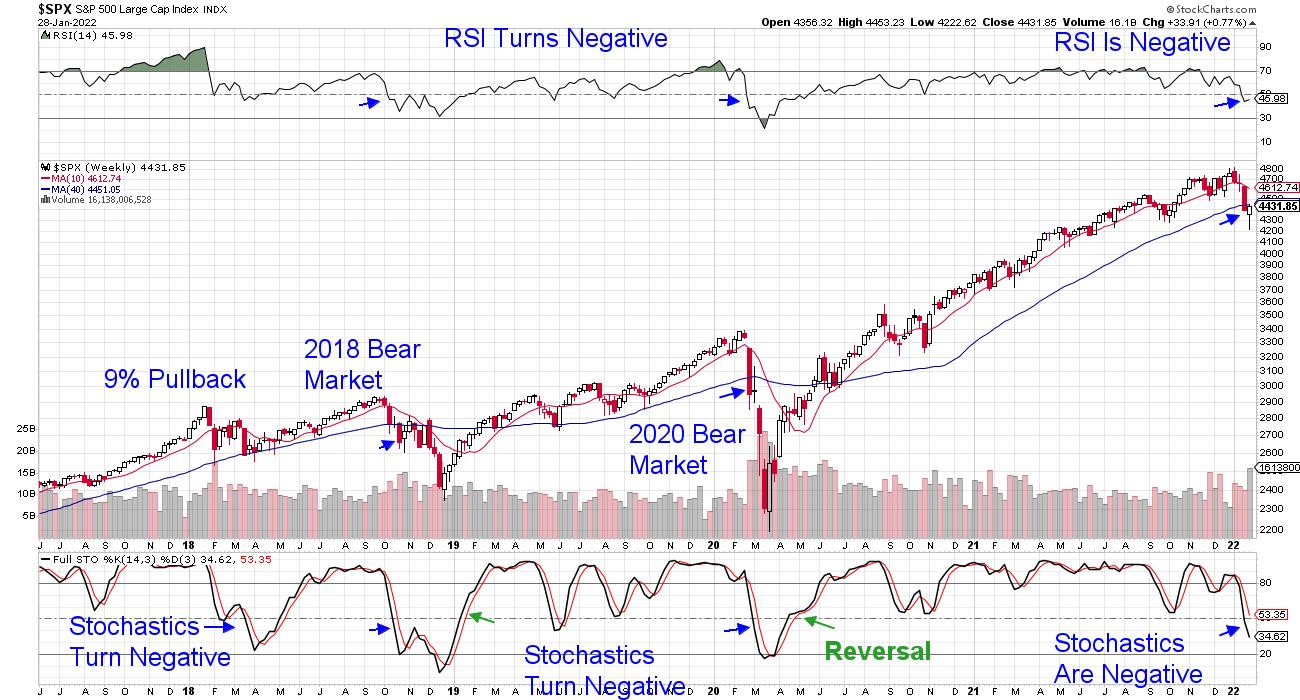
Don't Confuse a Cyclical Bear Market Bounce With a Secular Bull Market Rally

by Tom Bowley,
Chief Market Strategist, EarningsBeats.com
There are never any guarantees in the stock market. As much knowledge as I've gained over the years, and as much respect I have for my fellow technicians here at StockCharts.com, there's simply no way to ever be sure that your forecast is the right...
READ MORE
MEMBERS ONLY

S&P 500 Using Ichimoku Cloud Model

by David Keller,
President and Chief Strategist, Sierra Alpha Research
The Ichimoku cloud model (often just referred to as the "cloud model") is a traditional Japanese technical indicator which actually combines three separate trend-following devices. I spent some time on Japanese trading desks earlier in my career, and was always fascinated at how much I would see candlestick...
READ MORE
MEMBERS ONLY

Reduce Whipsaws and Improve Performance with a Simple Filter

by Arthur Hill,
Chief Technical Strategist, TrendInvestorPro.com
The 200-day SMA is quite the battle zone when it comes to the S&P 500. In fact, the index has crossed this key moving average 165 times since 2000. That's a lot of crosses, and a lot of needless whipsaws. Chartists can reduce whipsaws and improve...
READ MORE
MEMBERS ONLY

AMZN: Big Earnings, Big Gap, Big Problems
by Tom Bowley,
Chief Market Strategist, EarningsBeats.com
Call it a reprieve. Amazon.com (AMZN) reported excellent results last night, at least much better than what was expected. Revenues came in a bit light, according to Zacks.com, at $137.41 billion. Estimates were pegged at $137.88 billion. But bottom line EPS soared to $27.75 (actual)...
READ MORE
MEMBERS ONLY

Chartwise Women: Pay Attention to Berkshire Hathaway

by Mary Ellen McGonagle,
President, MEM Investment Research

by Erin Swenlin,
Vice President, DecisionPoint.com
On this week's edition of Chartwise Women, Mary Ellen and Erin share why Warren Buffet's portfolio is perfect for these turbulent times. They highlight how the Berkshire Hathaway holdings are faring in these current markets, looking at AAPL, VZ and more.
This video was originally broadcast...
READ MORE
MEMBERS ONLY

Leaders (Survivors) Emerging from the Volatility

by Alex Cole,
Co-founder, GoNoGo Charts®

by Tyler Wood,
Co-founder, GoNoGo Charts®
In this week's edition of the GoNoGo Charts show, with US Equity Indices at critical inflection points, Alex and Tyler review the possible scenarios through GoNoGo Charts: is this a bear market counter-trend rally or the bottoming before we resume the bull market trend?
GoNoGo Charts do not...
READ MORE
MEMBERS ONLY

The Similarities Between Golf and Trading

by Joe Rabil,
President, Rabil Stock Research
In this week's edition of Stock Talk with Joe Rabil, Joe discusses some of the similarities between golf and trading, explaining how we can improve our trading techniques by learning from common pitfalls in golf. Ideas like Put it in the Fairway, One Shot at a Time, Evaluate...
READ MORE
MEMBERS ONLY

SHORT-TERM MARKET BOUNCE RUNS INTO SELLING -- MEASURING OVERHEAD RESISTANCE LEVELS

by John Murphy,
Chief Technical Analyst, StockCharts.com
SHORT-TERM BOUNCE RUNS INTO RESISTANCE... My last message showed the three major stock indexes in an oversold condition and trying to bounce from underlying chart support. So the recent stock rebound wasn't a surprise. Neither was the size of the rebound. The combination of overhead resistance and today&...
READ MORE
MEMBERS ONLY

Sector Rotation to Defense Continues

by Julius de Kempenaer,
Senior Technical Analyst, StockCharts.com
Big drops call for big recoveries, but it's dangerous to watch these moves in isolation.
The S&P 500 dropped roughly 60 points from its peak at 480 at the start of the year to find a low recently around 420. Out of that low, the market...
READ MORE
MEMBERS ONLY

More Signs Pointing To Cyclical Bear Market
by Tom Bowley,
Chief Market Strategist, EarningsBeats.com
I was bearish heading into 2022 - before the selling began - and I haven't changed my mind one bit, despite the recent rally. Counter trend rallies are normal and, quite honestly, I think the current one may have just run its course. First, the rally has reached...
READ MORE
MEMBERS ONLY
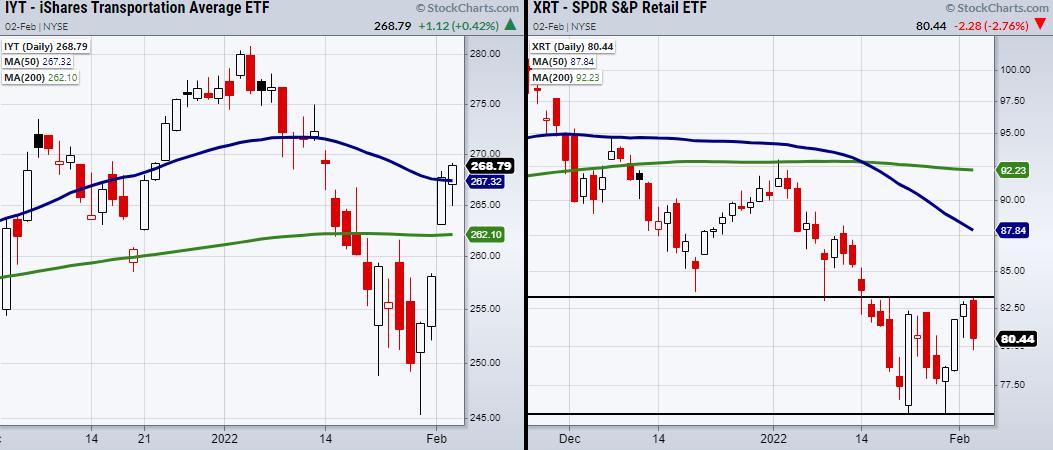
Transportation Gets Boosted While Retail Fumbles
On Tuesday, the transportation sector (IYT) gapped higher on earnings from one of its top holdings, United Parcel Service (UPS). Beating earnings per share estimates by 6.5%, UPS was able to bring IYT back over both its 200-day moving average and 50-DMA. IYT has now confirmed a bullish phase...
READ MORE
MEMBERS ONLY

Examining the Monthly Bar Charts for a Possible Reversal

by Martin Pring,
President, Pring Research
Usually, when we are identifying one or two bar price patterns or candlesticks, it's because they appear close to a turning point, thereby giving us a trading edge. From a practical point of view, it makes sense to observe daily or intraday price action. That's because...
READ MORE
MEMBERS ONLY

22 Trading Resolutions for 2022, Part 3

by Dave Landry,
Founder, Sentive Trading, LLC
On this week's edition of Trading Simplified, Dave starts off with methodology and mystery charts. Next, he discusses the state of the market-downtrend and sell signals. Finally, he continues his discussion on 2022 trading resolutions.
This video was originally broadcast on February 2, 2022. Click anywhere on the...
READ MORE
MEMBERS ONLY
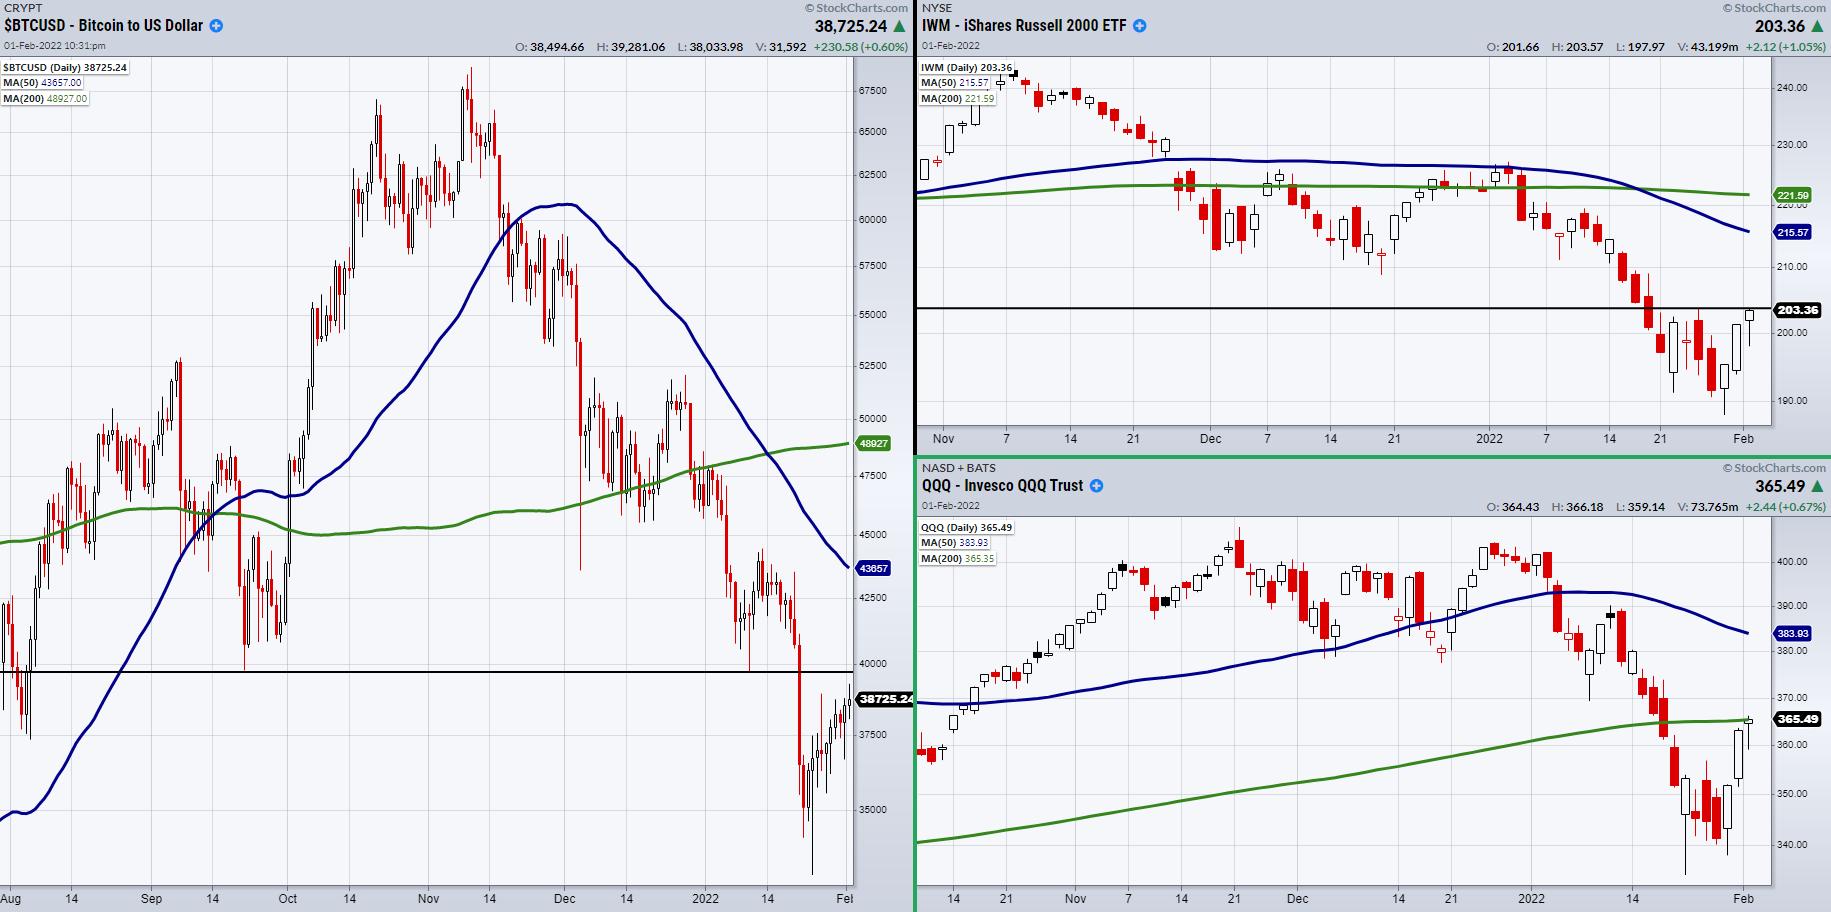
3 Key Price Levels the Nasdaq 100, Russell 2000, and Bitcoin Need to Clear
The stock market has rallied right into resistance, along with Bitcoin teetering at its 39k price level. However, the market is holding its current trading area and, though we are at a pivotal point, Wednesday could have another push higher if key levels are cleared. With that said, which price...
READ MORE
MEMBERS ONLY

Sector Spotlight: Sector Charts Showing Nasty Reversal Bars
by Julius de Kempenaer,
Senior Technical Analyst, StockCharts.com
In this edition of StockCharts TV's Sector Spotlight, after a volatile week in the markets and the completion of the monthly charts for January on Monday (1/31), now is a perfect moment to take a good look at the developments on these long-term charts. In the Asset...
READ MORE
MEMBERS ONLY

DP TV: Monthly Chart Breakdowns
by Erin Swenlin,
Vice President, DecisionPoint.com
It's the end of the month, so the monthly charts have gone FINAL! On this episode of DecisionPoint, Erin reviews the major market index monthly charts, as well monthly charts for Dollar, Gold, Crude Oil and Bonds (TLT). Sectors are showing new strength, but where should we be...
READ MORE
MEMBERS ONLY

"Believable" Misinformation Is a Danger to Long-Term Retirement Goals

by Greg Morris,
Veteran Technical Analyst, Investor, and Author
Here is another article I wrote a few years ago that I think needs to be repeated. Enjoy!
Many investment "truths" seem to go unchallenged but are in fact, very clearly just myths. Buy and hold investing is a good long-term strategy, economists are good at predicting the...
READ MORE
MEMBERS ONLY
My Top Stock Pick For This Year
by Mary Ellen McGonagle,
President, MEM Investment Research
Earlier this month, The Money Show asked me to join other stock market experts and submit my top stock idea for this year. While the markets were in a sunnier position at that time, I'm sharing my response below, as I still believe this stock is headed much...
READ MORE
MEMBERS ONLY
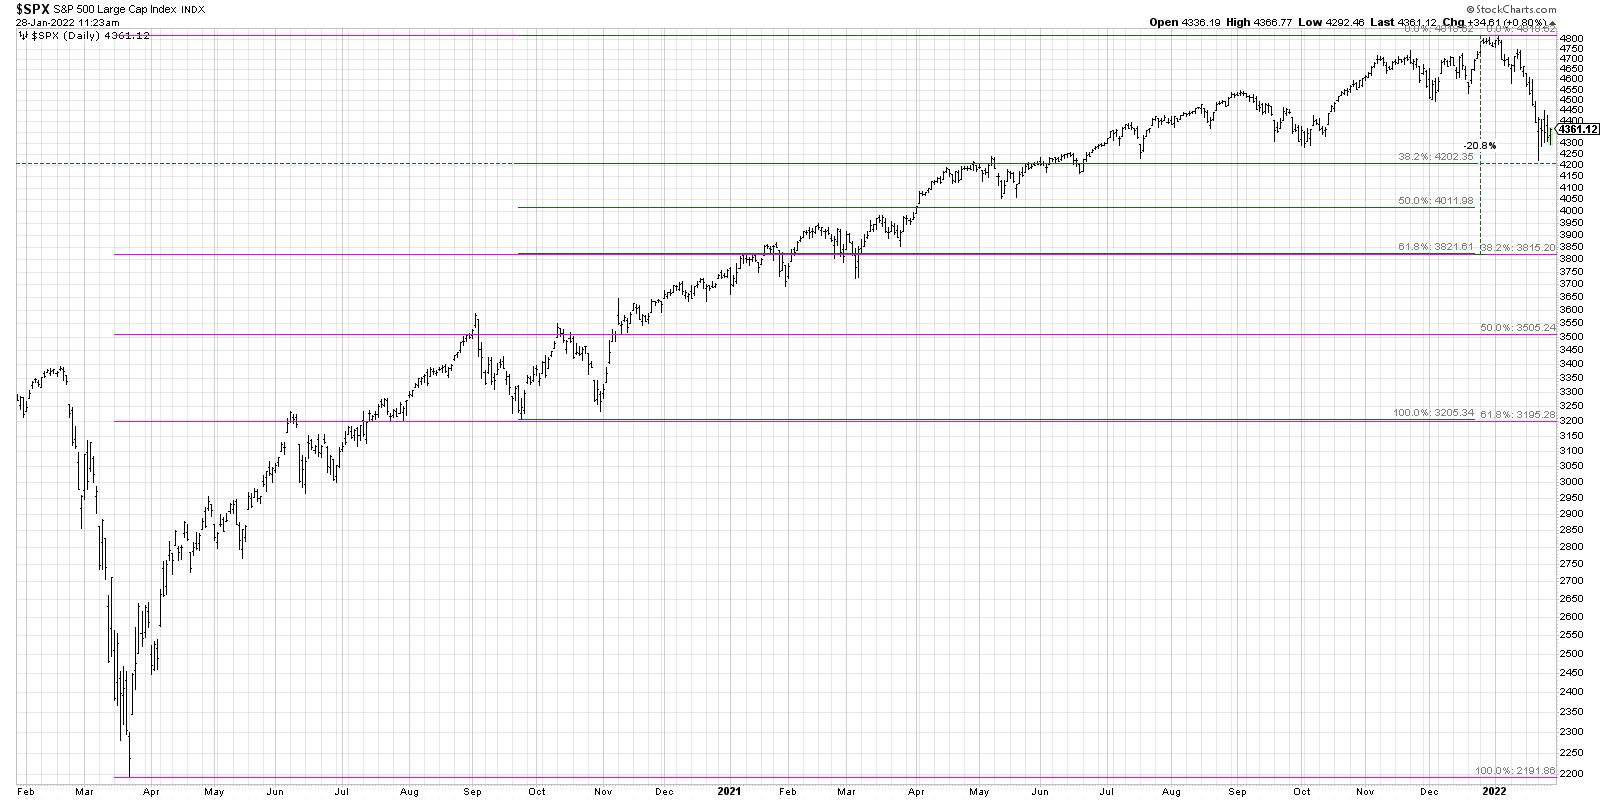
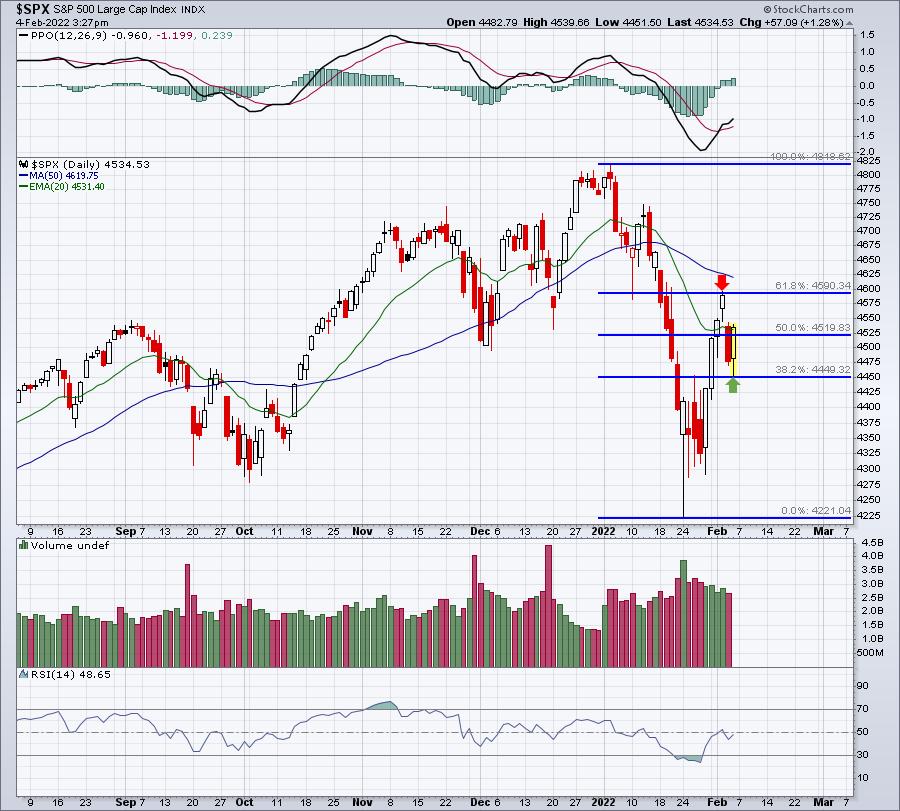
Downside S&P Projections Using Fibonacci
by David Keller,
President and Chief Strategist, Sierra Alpha Research
I recently posted a video on four potential paths for the S&P 500, from the very bullish (S&P gets over 4800 in the next six weeks) to the very bearish (S&P breaks below 4000).Today, I wanted to dig a little deeper into using...
READ MORE
MEMBERS ONLY

C'mon Commodities, Push That Energy Sector UP!
by Julius de Kempenaer,
Senior Technical Analyst, StockCharts.com
Watchers of my show Sector Spotlight will know that I have been watching the development of commodities as an asset class that's going through a long turnaround. Recent developments continue to reinforce that view.
The Relative Rotation Graph shows the rotation for a universe of asset class ETFs...
READ MORE
MEMBERS ONLY

Are the Markets Bottoming?
by Mary Ellen McGonagle,
President, MEM Investment Research
On this episode of StockCharts TV'sThe MEM Edge, Mary Ellen reviews key earnings reports and how they're driving price action. She also shares a view of promising moves in Tech and one area you should stay away from.
This video was originally recorded on January 28,...
READ MORE
MEMBERS ONLY
Should We Start Watching Noncyclical Stocks?
The past week has been very challenging, as the market can't seem to pick a direction. Though short-term momentum has more overhead pressure, even the bears have had difficulty shorting the choppy price action. In times like this, it can be helpful to take a step back, watch...
READ MORE
MEMBERS ONLY

Sushi Investing, Part 1: The Secret To Producing Profits Before The Expiration Date

by Gatis Roze,
Author, "Tensile Trading"
Profits are the product of practicing a persistent pilgrimage towards perfecting your sell disciplines. To paraphrase a sports cliche, without an exceptional defense you won't win championships. Michael Jordan has unequivocally stated that without the defensive wizardry of Dennis Rodman, the Chicago Bulls would not have been world...
READ MORE
MEMBERS ONLY
Where is the Market Headed?
by TG Watkins,
Director of Stocks, Simpler Trading
In this week's edition of Moxie Indicator Minutes, TG covers recent market action and outlines the destruction we've seen. He then talks about where he sees the market going, as well as how he is finding setups in these choppy times
This video was originally broadcast...
READ MORE
MEMBERS ONLY

Large Cap vs. Small Cap... A World Of Difference
by Julius de Kempenaer,
Senior Technical Analyst, StockCharts.com
When looking at Relative Rotation Graphs showing large-cap sectors and small-cap sectors, we usually see rotations for the various sectors that are more or less in line with each other. That's not surprising, as the small companies are active in the same sector as their large counterparts. Sometimes,...
READ MORE
MEMBERS ONLY
Chartwise Women: Bear Market Rules That You Need to Know Right Now!
by Mary Ellen McGonagle,
President, MEM Investment Research
by Erin Swenlin,
Vice President, DecisionPoint.com
In a bear market, you need to understand that overcoming emotions is critical to successful investing. For this week's edition of Chartwise Women, Mary Ellen and Erin walk you through the "rules" for investing during bearish times.
This video was originally broadcast on January 27, 2022....
READ MORE
MEMBERS ONLY
Lack of Risk Asset Demand Pushes S&P Decline
by Alex Cole,
Co-founder, GoNoGo Charts®
by Tyler Wood,
Co-founder, GoNoGo Charts®
In this week's edition of the GoNoGo Charts show, the volatility continues as the U.S. domestic markets experience massive intraday swings. Alex and Tyler look at how expectations of 4 rate hikes in 2022 weigh on investors' decision-making by examining charts of the S&P,...
READ MORE
MEMBERS ONLY
The Power of Moving Averages
by Joe Rabil,
President, Rabil Stock Research
In this week's edition of Stock Talk with Joe Rabil, Joe discusses a number of ways that Moving Averages can aid in determining support/resistance, trend, overbought/oversold and longevity of the trend. He then analyzes the stock requests that came through, including MSFT, NVDA and more.
This...
READ MORE
MEMBERS ONLY

OVERSOLD STOCK INDEXES ATTEMPT TO STABILIZE NEAR CHART SUPPORT -- BUT BREADTH FIGURES PAINT A WEAKER PICTURE
by John Murphy,
Chief Technical Analyst, StockCharts.com
OVERSOLD MARKET ATTEMPTS TO STABILIZE... After an incredibly volatile week of trading, stocks are in a short-term oversold condition and attempting to stabilize near chart support. Chart 1 shows the Dow Industrials stabilizing near a flat support line drawn under their June low. At the same time, the 14-day RSI...
READ MORE
MEMBERS ONLY
Key Price Levels to Watch in the Current Choppy Market
Recently, we've talked about trading the market with a rangebound stance. This means we are looking to determine the main support/resistance levels the indices are trading within to define the current range, then watch for trading opportunities based on those key levels. With that said, which price...
READ MORE
MEMBERS ONLY

Some Indexes Break Down from Major Price Patterns: Selling Climaxes Offer Hope!
by Martin Pring,
President, Pring Research
I am a great believer in the principle of false breaks being followed by above-average moves in the opposite direction to the break. It happens because those who bought on it are caught on the wrong side of the market and are forced to re-position themselves, just as correctly positioned...
READ MORE
MEMBERS ONLY
Is the Stock Market Bomb Blowing Up Now?
by Dave Landry,
Founder, Sentive Trading, LLC
On this week's edition of Trading Simplified, Dave interrupts his previously scheduled topic of trading resolutions to talk about whether we're witnessing a bomb blowing up in the stock market. He also has a new Mystery Chart that's a BUY.
This video was originally...
READ MORE
MEMBERS ONLY
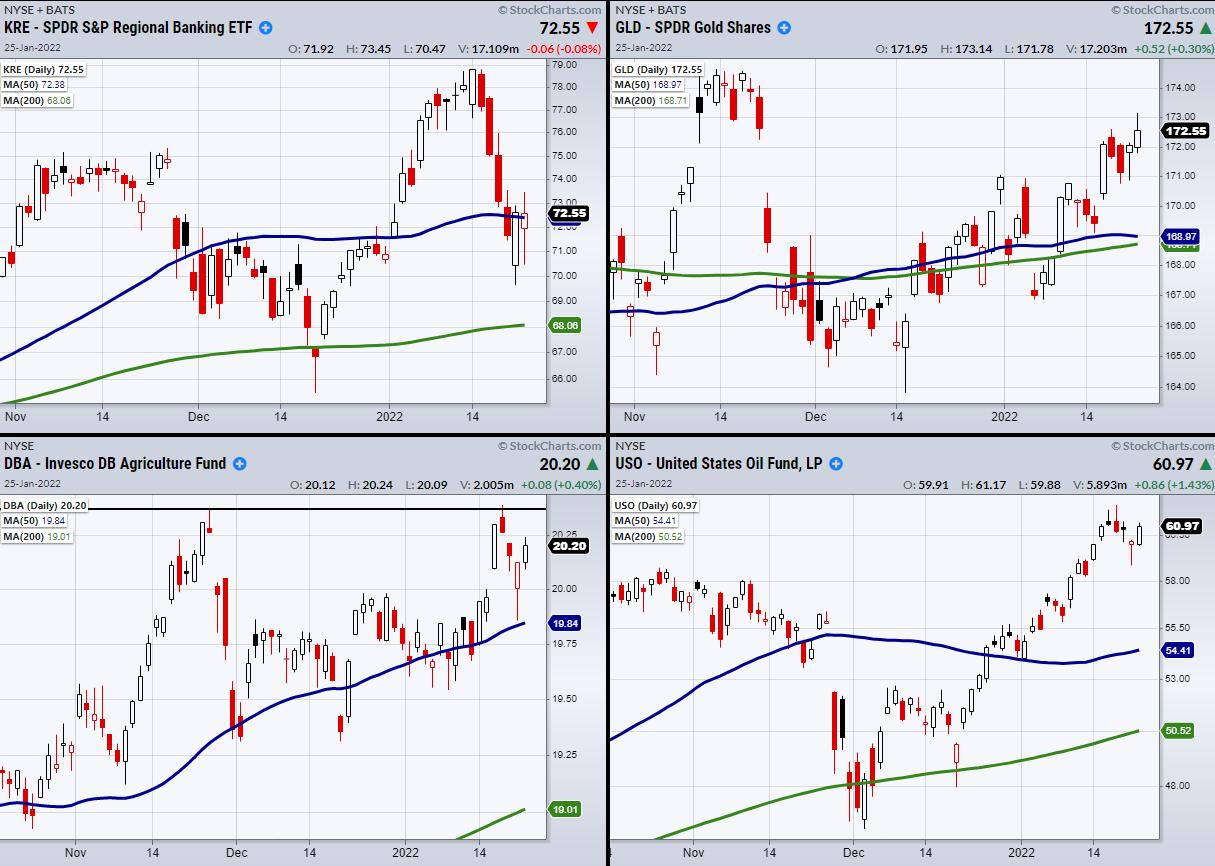
The Major Indices Set a Key Support Level as Commodities Heat Up
The market is looking to hold its current price area, along with Monday's low as a new key support level. Additionally, with many banks coming out of earnings season, the Regional Banking ETF (KRE) is perking up; now it needs a close over its 50-day moving average at...
READ MORE
MEMBERS ONLY
Sector Spotlight: Stock/Bond Ratio Signals Defense
by Julius de Kempenaer,
Senior Technical Analyst, StockCharts.com
In this edition of StockCharts TV's Sector Spotlight, after a rocky week and a volatile Monday, I evaluate the rotations for asset classes and sectors on Relative Rotation Graphs. Both groups are showing some important shifts that suggest a further move to defense is in order. As it...
READ MORE
MEMBERS ONLY
DP TV: Whipsaw Whiplash!
by Erin Swenlin,
Vice President, DecisionPoint.com

by Carl Swenlin,
President and Founder, DecisionPoint.com
On this episode of DecisionPoint, Carl gives us his perspective on what today's late-day whipsaw means for the market in the short- and intermediate-term. There were two new sector neutral signals and two more are ready to lose intermediate-term buy signals as well. Erin gives us her analysis...
READ MORE
MEMBERS ONLY

Watch These Two Symbols as Indictors for a Continued Market Rally
The stock market has been under pressure from upcoming interest rate hikes, inflation and a worrying overseas situation in Ukraine. However, Monday's gap lower was followed by a late-day rally in all four major indices. With that said, has this created a key support level to hold, and...
READ MORE
MEMBERS ONLY
4 Bold Predictions About This Bear Market
by Tom Bowley,
Chief Market Strategist, EarningsBeats.com
Yes, I believe we're in a cyclical bear market. I began discussing bearish signals back in November and those only intensified as we neared year end. You don't need to see a twister in your dining room to realize a storm is approaching. In my last...
READ MORE
MEMBERS ONLY

The Intellectual Void
by Greg Morris,
Veteran Technical Analyst, Investor, and Author
This is an article I wrote a few years ago and I think is worth repeating.
I'm always trying to come up with new ideas for articles and don't mind if I cross the line a little bit even if it offends a few – I just...
READ MORE
