MEMBERS ONLY

Oil & Gas Equipment & Services ETF Makes a Bid to End its Big Digestion

by Arthur Hill,
Chief Technical Strategist, TrendInvestorPro.com
The Oil & Gas Equipment & Services ETF (XES) was one of the leading industry group ETFs in the spring after it surged some 164% off its November low. This was clearly a massive gain and the ETF was entitled to a rest. Big meals require long digestive periods and...
READ MORE
MEMBERS ONLY

STOCKS REBOUND ON CPI REPORT -- SMALL CAPS LAG BEHIND -- DIP IN BOND YIELDS SHOULD BE SHORT-LIVED

by John Murphy,
Chief Technical Analyst, StockCharts.com
LARGE CAPS ARE ENDING THE WEEK HIGHER DESPITE RISING CPI... This morning CPI report showed annual inflation rising 6.8% to the highest level in nearly forty years. Despite that high reading, major stock indexes are gaining ground on the day and week. Chart 1 shows the Dow Industrials climbing...
READ MORE
MEMBERS ONLY

Chartwise Women: Downtrend Reversals are Beginning to Emerge

by Mary Ellen McGonagle,
President, MEM Investment Research

by Erin Swenlin,
Vice President, DecisionPoint.com
For this volatile week's edition of Chartwise Women, Mary Ellen and Erin Swenlin chat about downtrend reversals as we begin to see them emerge in leading stocks.
This video was originally broadcast on December 9, 2021. Click on the image above to watch on our dedicated Chartwise Womenpage,...
READ MORE
MEMBERS ONLY

How to Avoid Market Chop

by Joe Rabil,
President, Rabil Stock Research
In this week's edition of Stock Talk with Joe Rabil, Joe discusses ways to avoid being chopped up in a less than desirable market environment. He explains how he uses the Trend and Momentum of the stock in Multiple Time Frames to help reduce the number of trades...
READ MORE
MEMBERS ONLY
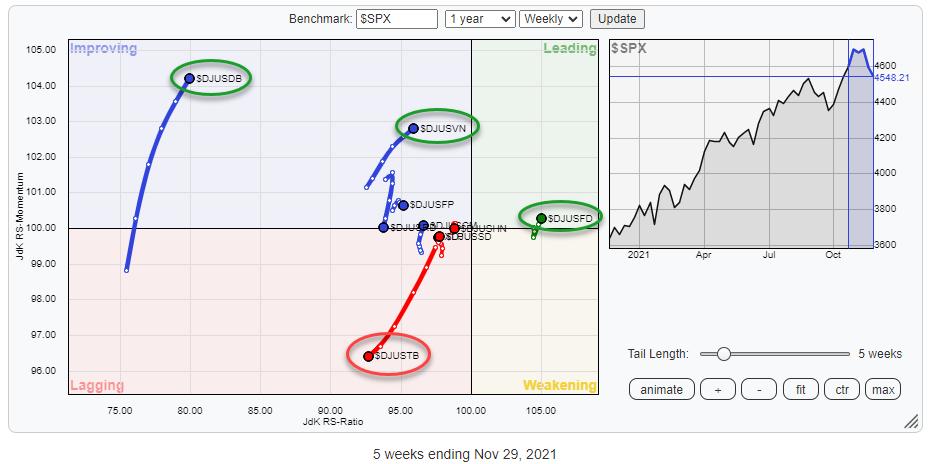
Sector Rotation Model Suggests There's Still Upside Available

by Julius de Kempenaer,
Senior Technical Analyst, StockCharts.com
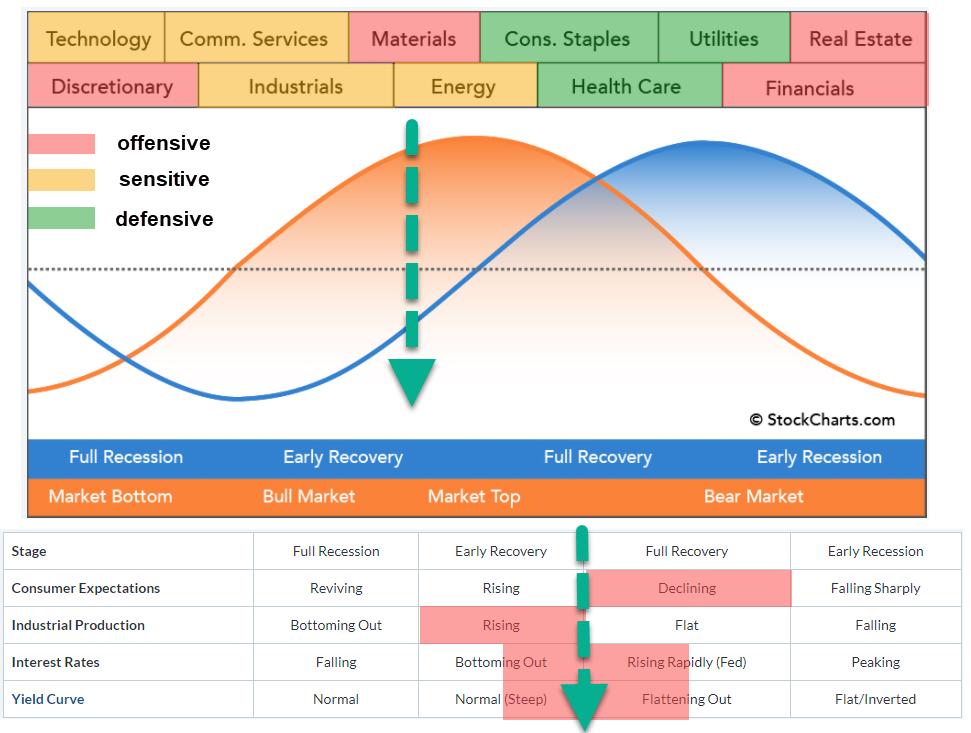
In this week's episode of Sector Spotlight, I reviewed the current position of markets (sector rotation) in combination with the theoretical framework provided by the Sector Rotation Model (Sam Stovall). This article provides a quick write-up of that segment.
The sector rotation model shows the typical cyclical movement...
READ MORE
MEMBERS ONLY

Bitcoin vs. Ethereum: It's An Easy Choice

by Tom Bowley,
Chief Market Strategist, EarningsBeats.com
As technicians, what do we care about? The charts, right? Well, when I look at the charts of Bitcoin ($BTCUSD) and Ethereum ($ETHUSD), the choice between the two is relatively simple. The charts tells us everything, and this one simple price-relative chart says to go with Ethereum until further notice:...
READ MORE
MEMBERS ONLY

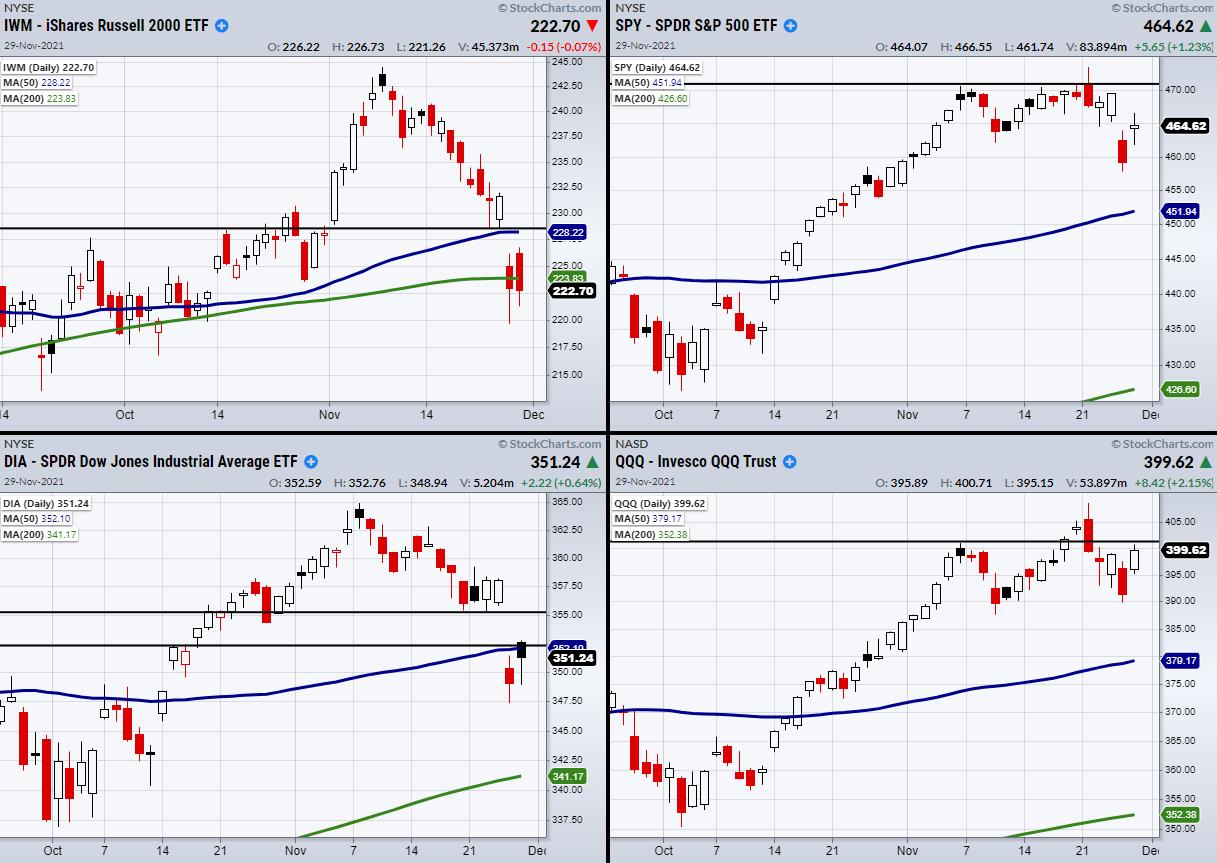
Is the Russell 2000 (IWM) Setting a Bad Example?
Over the past three trading days, the major indices have made a remarkable rally from the recent lows. However, the small-cap index Russell 2000 (IWM) has only bounced back into the middle of its trading range. As seen in the above weekly chart, IWM has spent a large portion of...
READ MORE
MEMBERS ONLY

Sector Spotlight: Sector Rotation & The Business Cycle
by Julius de Kempenaer,
Senior Technical Analyst, StockCharts.com
On this edition of StockCharts TV's Sector Spotlight, I take a good look at the current state of asset class and sector rotation. I talk you through the daily and weekly rotations on the respective Relative Rotation Graphs, highlighting the strength of the USD, the pause in commodities...
READ MORE
MEMBERS ONLY
Transportation and Semiconductor ETFs Need to Make New Highs
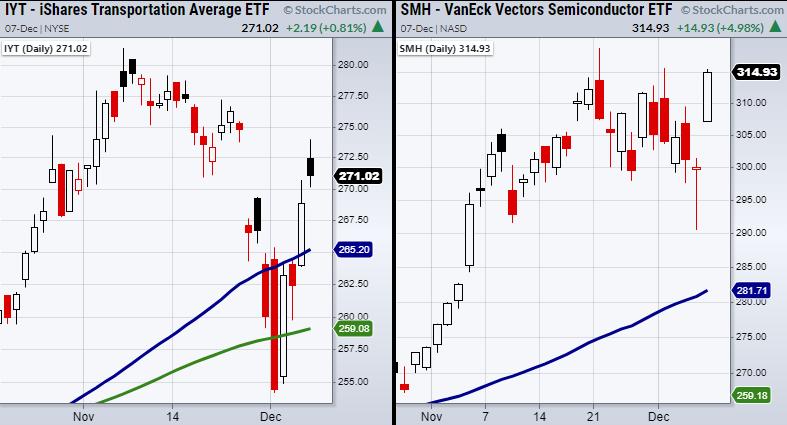
Two sectors within Mish's Economic Modern Family, Transportation (IYT) and Semiconductors (SMH), have rallied near all-time highs. Now, we should watch for the highs to clear, as this could signify the next step for economic improvement.
Currently, semiconductor suppliers have one of the largest supply chain issues the...
READ MORE
MEMBERS ONLY

DP TV: Is Sentiment Bearish Enough?
by Erin Swenlin,
Vice President, DecisionPoint.com

by Carl Swenlin,
President and Founder, DecisionPoint.com
On this episode of DecisionPoint, after Carl reviews the SPY and DecisionPoint indicators, Erin walks viewers through the sector CandleGlance with Carl's comments. They then roll into their Sentiment charts (put/call ratio, NAAIM Exposure and Rydex Ratio) and discuss whether sentiment was bearish enough for a market...
READ MORE
MEMBERS ONLY
Why is the Nasdaq 100 Fighting an Internal Battle?
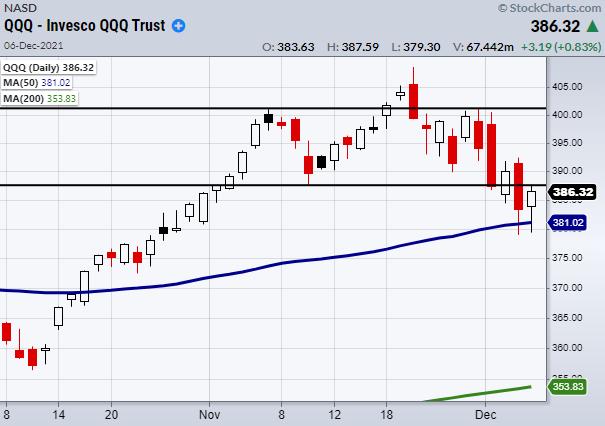
The Nasdaq 100 (QQQ) continues to show a weak hand. Riddled with tech companies that are selling off, it has struggled to hold over its 50-day moving average at $381.02.
Having said that, the QQQ is one of the most important indices to watch right now, as its current...
READ MORE
MEMBERS ONLY
Does Last Week's Bitcoin Sell-Off Signal a Bear Market?

by Martin Pring,
President, Pring Research
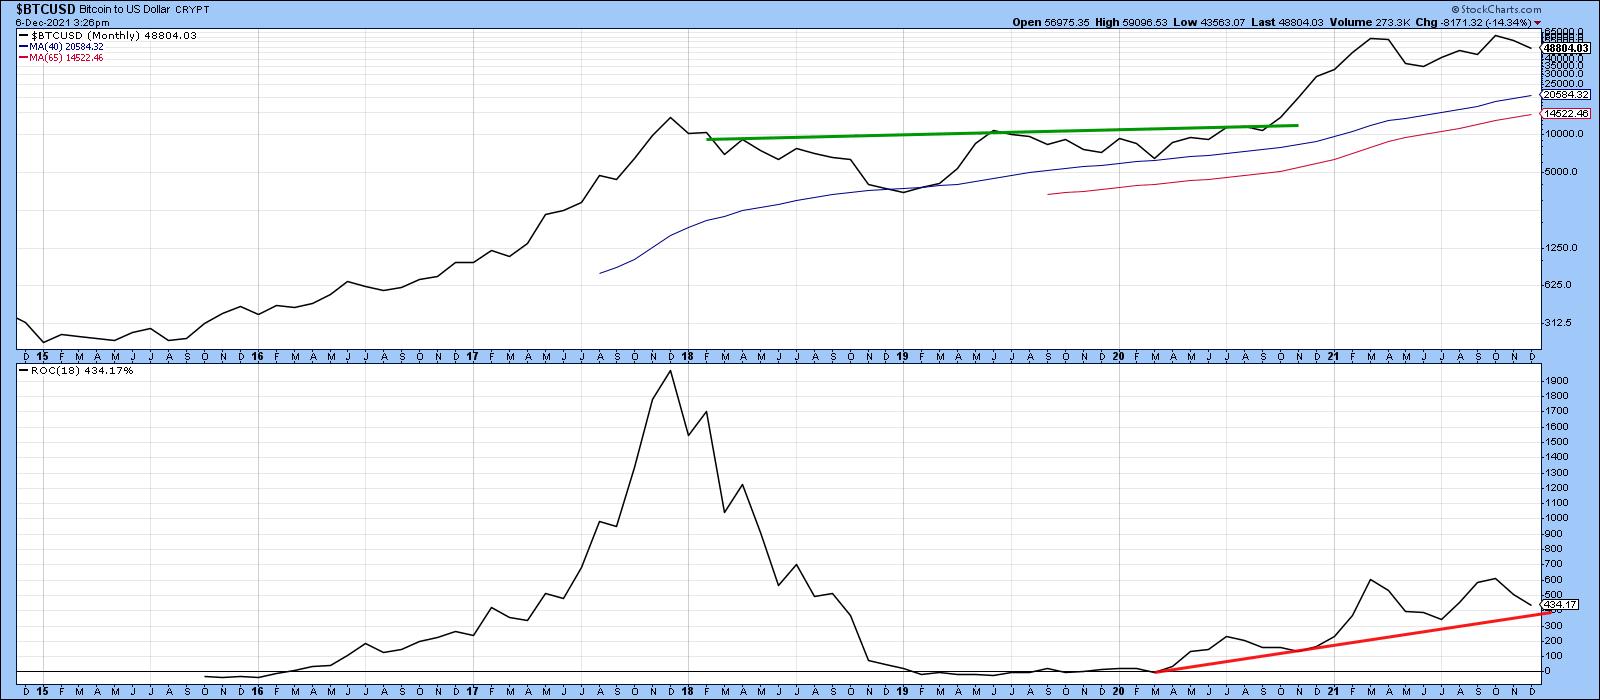
According to CoinGecko, total crypto market capitalization, which came from almost nothing 10 years ago, stood at $3 trillion in early November. To put that in perspective, total US GDP currently stands at $23 trillion, so, at its recent high, global crypto was worth 13% of US GDP and more...
READ MORE
MEMBERS ONLY

Will We Get a Christmas Rally?

by Larry Williams,
Veteran Investor and Author
Will stocks rally this Christmas? Larry answers the question and explores when the ideal short-term trading opportunity will be in this new StockCharts TV special. Larry also presents his forecast for Bitcoin and gold, sharing what he thinks is in store for gold over the next several months.
This video...
READ MORE
MEMBERS ONLY
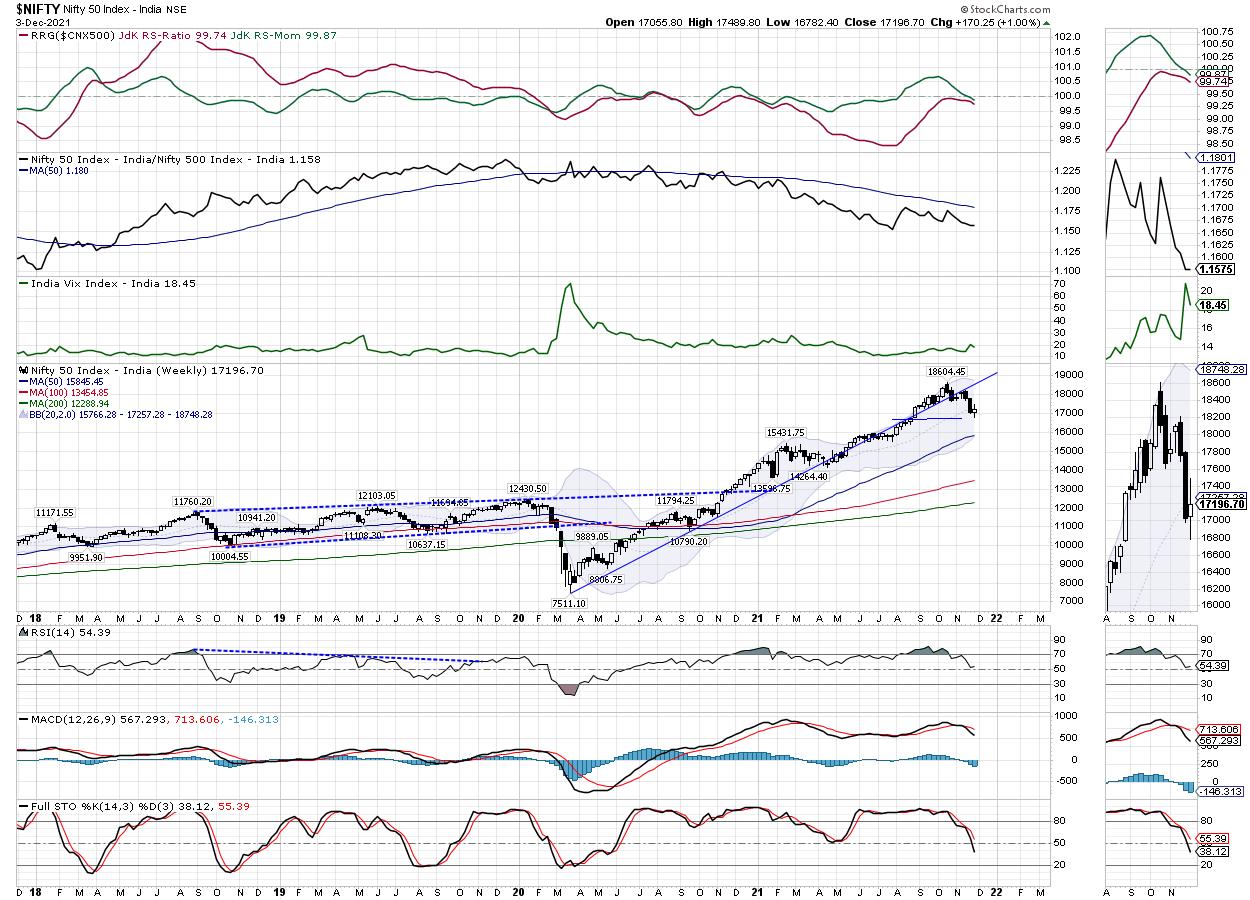
Week Ahead: A Few Sectors Ready to Take Breather; Others Readying Themselves for Strong Moves

by Milan Vaishnav,
Founder and Technical Analyst, EquityResearch.asia and ChartWizard.ae
Just like the previous one, this week remained a relatively wide-ranging, with NIFTY oscillating in a 707-point range before ending with modest gains. Over the past five days, the markets struggled hard to find and create a base for themselves, staging a technical pullback and also moving above important levels...
READ MORE
MEMBERS ONLY
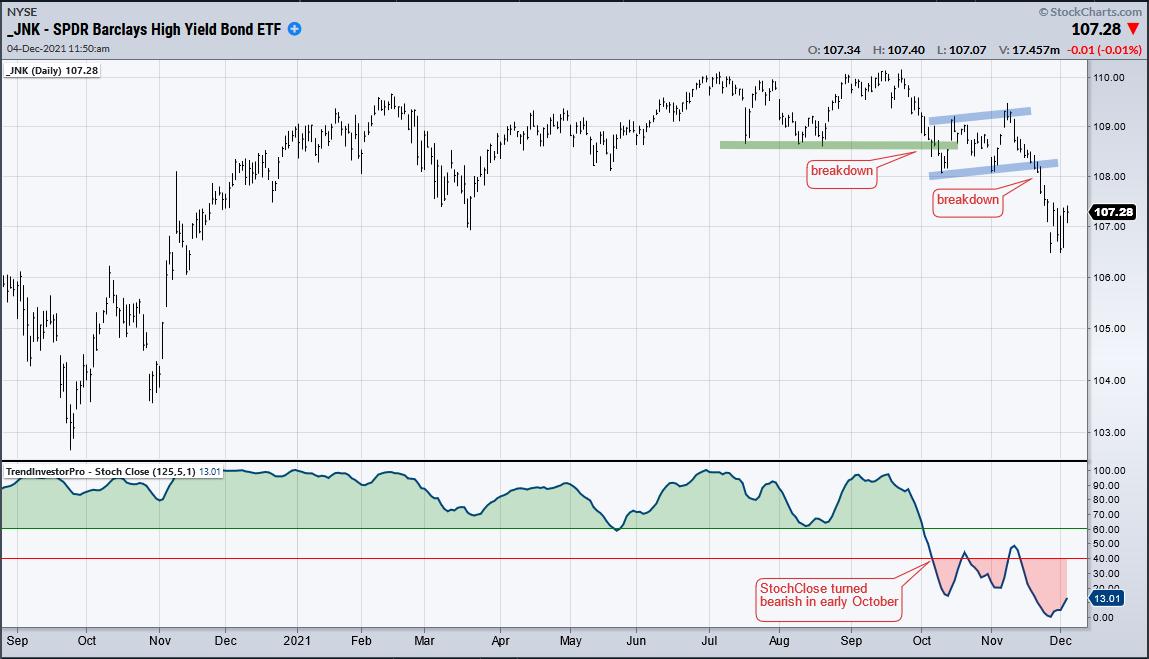
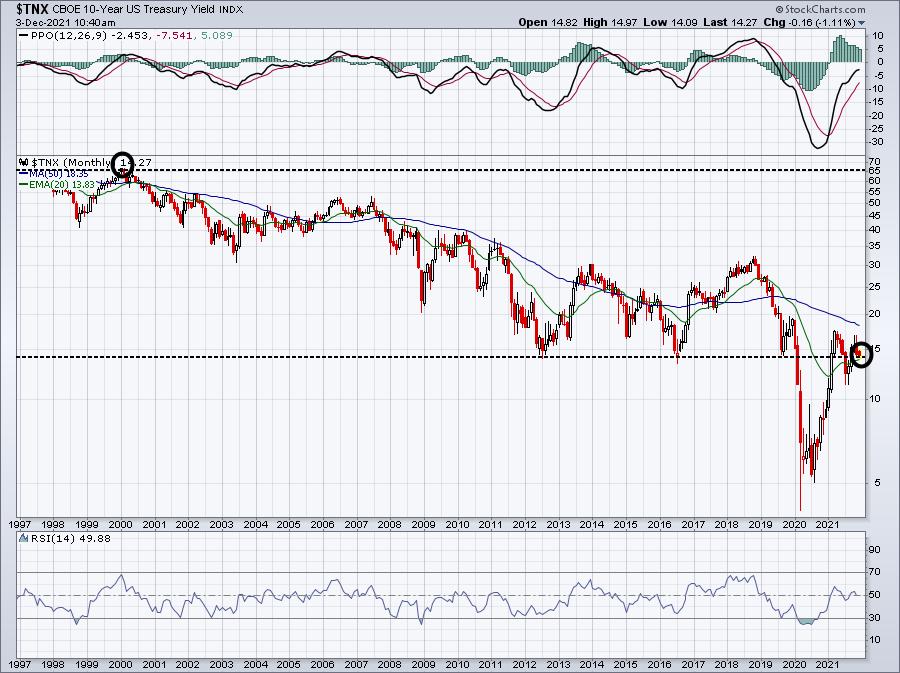
More Signs of Risk Aversion in the Financial Markets
by Arthur Hill,
Chief Technical Strategist, TrendInvestorPro.com
Signs of risk aversion are increasing in the financial markets. Risk aversion first appeared in the junk bond market in October and this week we are seeing money move into Treasury bonds, the ultimate safe-haven assets.
Junk bonds have the highest risk because they are the lowest-rated corporate bonds. As...
READ MORE
MEMBERS ONLY
Panic Selling Accelerating; Watch These Sentiment Indicators For A Bottom
by Tom Bowley,
Chief Market Strategist, EarningsBeats.com
As the Volatility Index ($VIX) rises, it becomes fairly obvious that market makers are "on vacation." The primary role of the market maker is to provide liquidity when there's an imbalance between buyers and sellers. Rarely do we see panicked buying when buyers completely swamp sellers....
READ MORE
MEMBERS ONLY
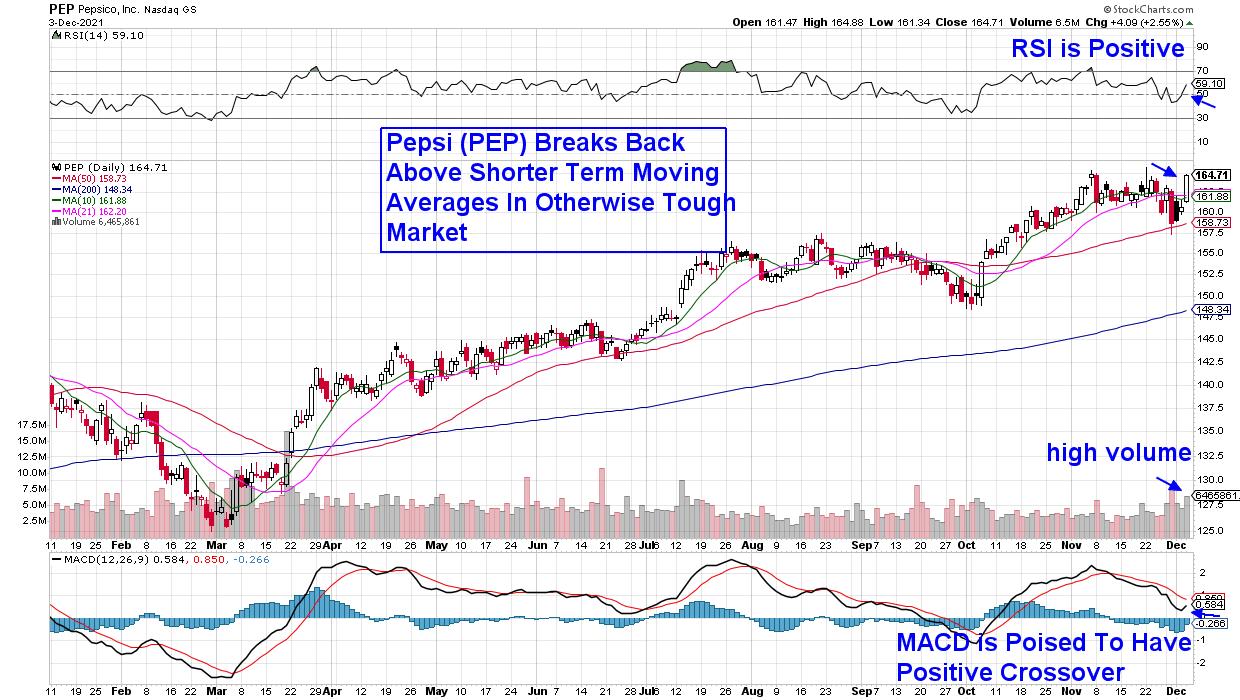
Risk-Off Market Environment Opens Door to These Uptrending Stocks!
by Mary Ellen McGonagle,
President, MEM Investment Research
The S&P 500 closed the week below its key 50-day moving average as investors sold stocks in the face of omicron and inflation fears. The Nasdaq also dropped in a move that pushed this Index below key support as well and into negative territory. In a true indication...
READ MORE
MEMBERS ONLY
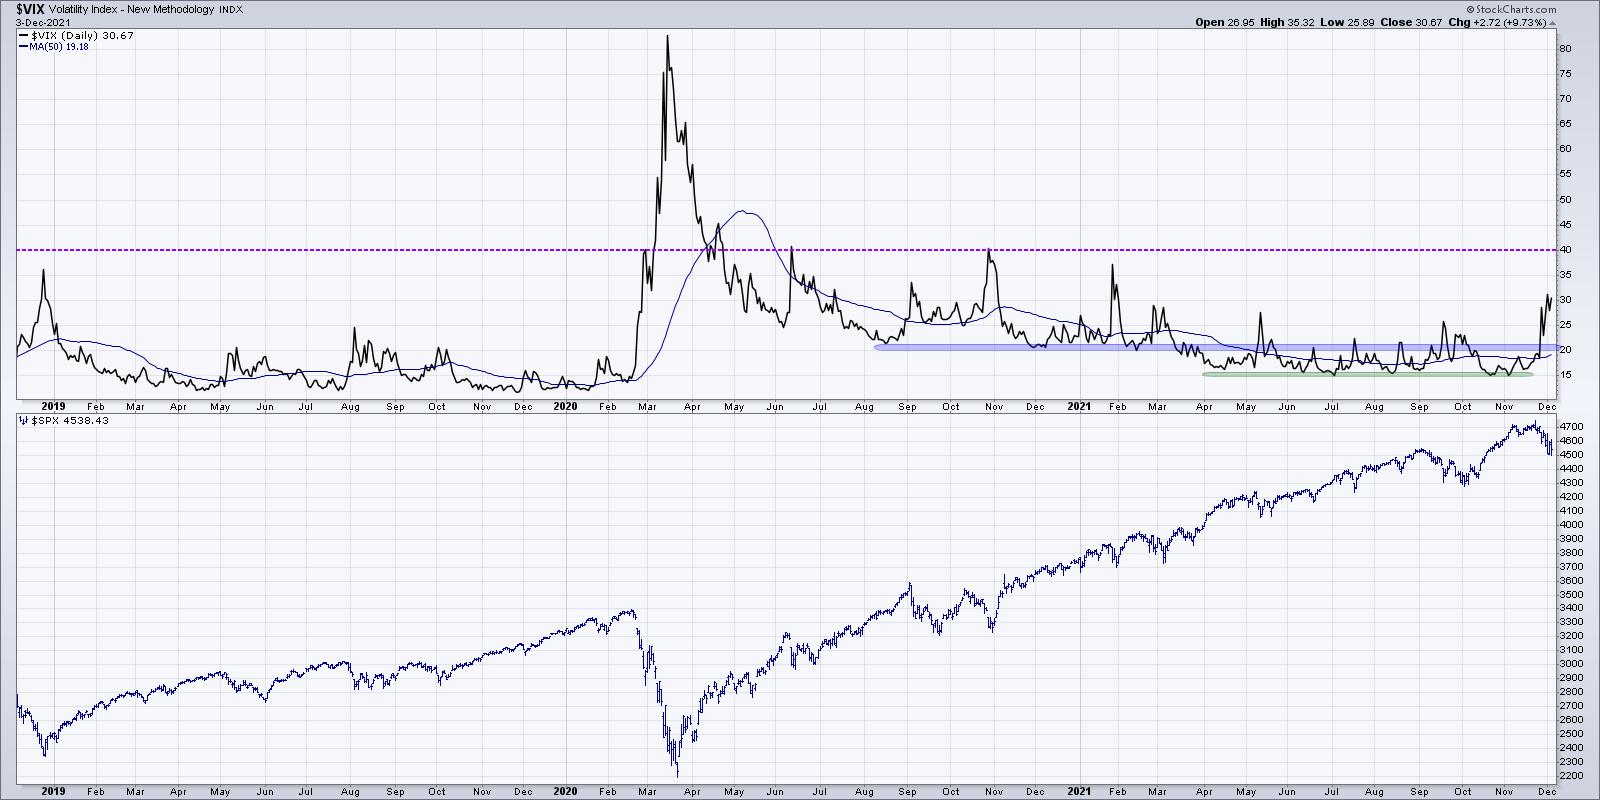
Spike in Volatility Bearish for Stocks?

by David Keller,
President and Chief Strategist, Sierra Alpha Research
The VIX spiked above 30 this week, making that the highest level since January 2021. But is a rapid rise in volatility necessarily bearish for stocks?
In my conversation with Marc Chaikinearlier this week onThe Final Bar, we talked about the move higher in the VIX and how that relates...
READ MORE
MEMBERS ONLY
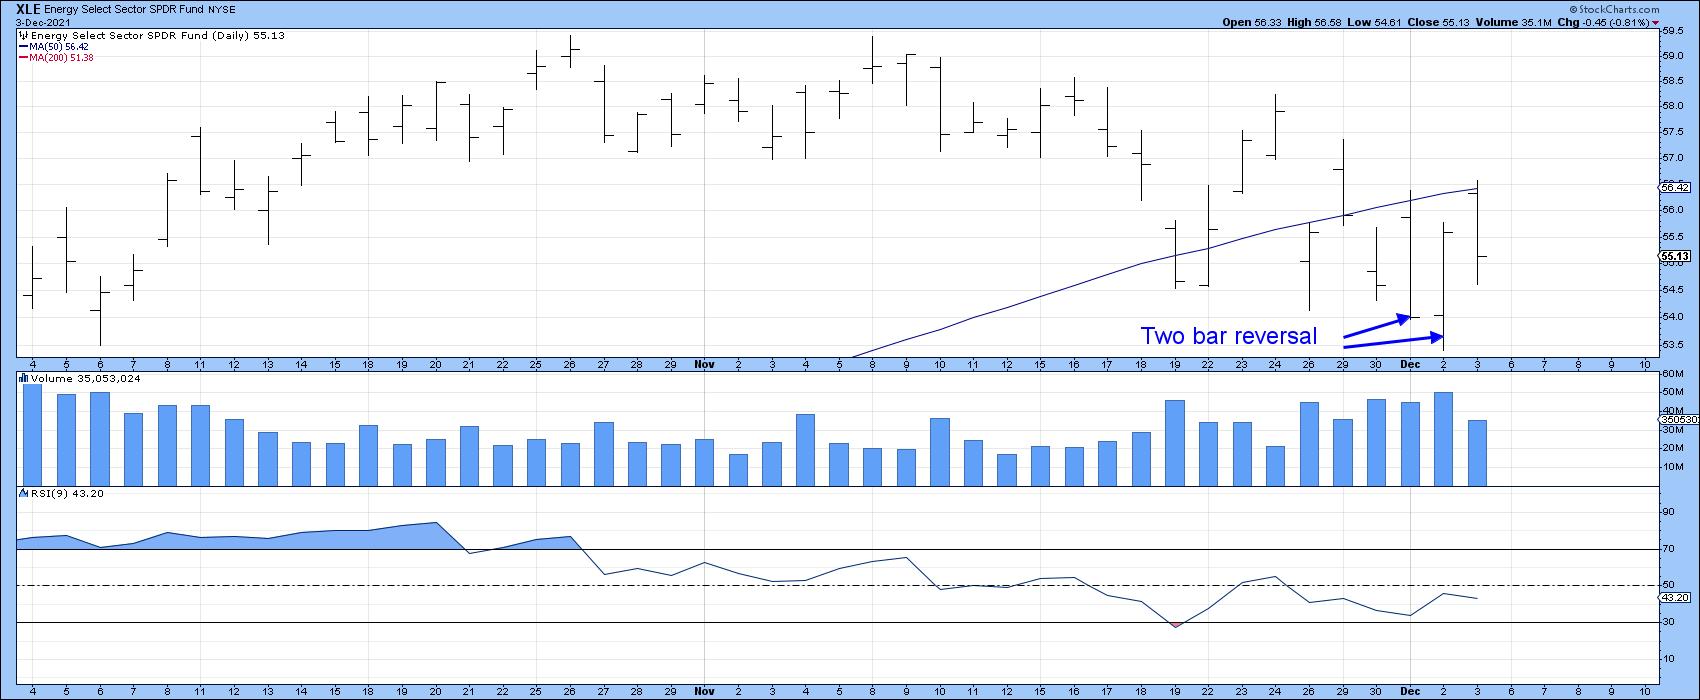
Bullish Two-Bar Reversal Patterns Suggest a Temporary Bottom for Some Sectors -- and Maybe the Market Itself
by Martin Pring,
President, Pring Research
Thursday's action was quite positive for several sectors, as they experienced positive two-day price formations. These patterns are only of a short-term nature and usually have an effect for between 5 and 10 days, so they do not represent major signals. However, since this action is coming off...
READ MORE
MEMBERS ONLY

Should You Buy the Dip in the Markets?
by Mary Ellen McGonagle,
President, MEM Investment Research
On this episode StockCharts TV'sThe MEM Edge, Mary Ellen reviews current market conditions and what to be on the lookout for to turn positive. She also reveals pockets of strength in growth areas that are ideal for your watch-list, as well as risk-off candidates.
This video was originally...
READ MORE
MEMBERS ONLY

3 Important Tips to Improve Trading This Coming Week
I have recently heard a saying stating that the current market behavior can lead to "death by a thousand cuts." This is often the case in a choppy market where buyers and sellers are constantly battling each other, making the stock market tough to trade from either the...
READ MORE
MEMBERS ONLY
Americans are Buying Food and Booze -- But No Cigarettes
by Julius de Kempenaer,
Senior Technical Analyst, StockCharts.com
The S&P 500 is still holding up inside the boundaries of its rising channel, but the market is nervous, which resulted in a VIX reading above 30. That hasn't happened since February.
Nervous markets, or rather their participants, usually mean that people start checking out defensive...
READ MORE
MEMBERS ONLY

Bizarre Market Action Explained

by TG Watkins,
Director of Stocks, Simpler Trading
In this week's edition of Moxie Indicator Minutes, TG talks about how the SPY Daily 50 SMA target was hit, but not on the kind of news that he wanted, which is making the market really weird. Inflation and Omicron are the two factors. He then goes on...
READ MORE
MEMBERS ONLY

STOCKS INDEXES REMAIN UNDER PRESSURE -- MOVING AVERAGE LINES ARE BEING THREATENED -- INVESTORS BUY BONDS AND GOLD
by John Murphy,
Chief Technical Analyst, StockCharts.com
MOVING AVERAGE LINES ARE BEING THREATENED... A combination of factors are pushing stocks lower again today to extend weekly losses. A weak jobs report this morning, fears of accelerated Fed tightening to fight inflation, and worries about the Omicron coronavirus are keeping stocks on the defensive. Ånd moving lines are...
READ MORE
MEMBERS ONLY
Are Valuations Too High? Here are the Three Primary Ingredients to Tell
by Tom Bowley,
Chief Market Strategist, EarningsBeats.com
I practiced in public accounting for 20 years and was involved in a number of company valuations. I worked very little with public companies, but did have to value private companies on occasion. Most of the valuation metrics that I used in the 1980s and 1990s remain absolutely the same...
READ MORE
MEMBERS ONLY

Bullish Two-Bar Reversal Patterns Suggest a Temporary Bottom for Some Sectors -- and Maybe the Market Itself
by Martin Pring,
President, Pring Research
Thursday's action was quite positive for several sectors, as they experienced positive two-day price formations. These patterns are only of a short-term nature and usually have an effect for between 5- and 10-days, so they do not represent major signals. However, since this action is coming off an...
READ MORE
MEMBERS ONLY
Chartwise Women: Investor Sentiment - The Cycle of Market Emotions
by Mary Ellen McGonagle,
President, MEM Investment Research
by Erin Swenlin,
Vice President, DecisionPoint.com
On this week's edition of Chartwise Women, Erin and Mary Ellen discuss the cycle of market emotions and how they're affected by current events. They share what they've learned about investor sentiment and the tools used to gauge it.
This video was originally broadcast...
READ MORE
MEMBERS ONLY
The Most Important Indicators and Their Order of Influence
by Joe Rabil,
President, Rabil Stock Research
In this week's edition of Stock Talk with Joe Rabil, Joe discusses the most important indicators that he uses in his analysis and their order of influence. Price, Price Structure, Moving Average Lines, Fibonacci Retracements, MACD, ADX and Relative Strength are all discussed briefly and when each carries...
READ MORE
MEMBERS ONLY
Is the Stock Market Entering a Distribution Phase?
A distribution phase, as taught through Mish's book Plant Your Money Tree, is when the price of a symbol is trading underneath the 50- and 200-day moving averages while the 50-DMA is trading above the 200-DMA. This can be seen in the above chart of the Russell 2000...
READ MORE
MEMBERS ONLY

The Three Most Important Things About Trading Crypto

by Dave Landry,
Founder, Sentive Trading, LLC
In this edition of Trading Simplified, Dave follows up on his core methodology for trading stocks using live and recent examples. He then goes on to show that it also works well in crypto, but only with these 3 important things-which could be the Holy Grail of Crypto. Finally, he...
READ MORE
MEMBERS ONLY
Sector Spotlight: Sector Rotation Disconnected from Seasonality
by Julius de Kempenaer,
Senior Technical Analyst, StockCharts.com
On this edition of StockCharts TV's Sector Spotlight, I take on both seasonality and the monthly charts for November, starting with a quick look and analysis of current sector rotation and its potential impact on the S&P 500. After that, I look at seasonal patterns for...
READ MORE
MEMBERS ONLY

Keep Your Eyes on Junk and Treasury Bonds
The stock market sits in a dicey situation, with not only the Omicron variant adding stress to economic growth, but the Fed chair Jerome Powell also commenting on the possibility of speeding up tapering. Though the Fed has long stressed inflation to be transitory, it seems as though their tune...
READ MORE
MEMBERS ONLY

Divergence is Back
by Julius de Kempenaer,
Senior Technical Analyst, StockCharts.com
First of all, I need to apologize for the absence of writing a blog article (and publishing a Sector Spotlight Video). In the intro of today's episode of Sector Spotlight, I explain a bit about what happened. But to make a long story very short, on Wednesday evening,...
READ MORE
MEMBERS ONLY
DP TV: Market Bias Bearish in All Timeframes
by Erin Swenlin,
Vice President, DecisionPoint.com
by Carl Swenlin,
President and Founder, DecisionPoint.com
On this episode of DecisionPoint, Carl walks viewers through the broad markets using the Golden Cross Index and Silver Cross Index. As part of the indicator review today, Carl and Erin discuss how to determine market bias using participation and the Golden Cross/Silver Cross Indexes. Currently, the bias is...
READ MORE
MEMBERS ONLY
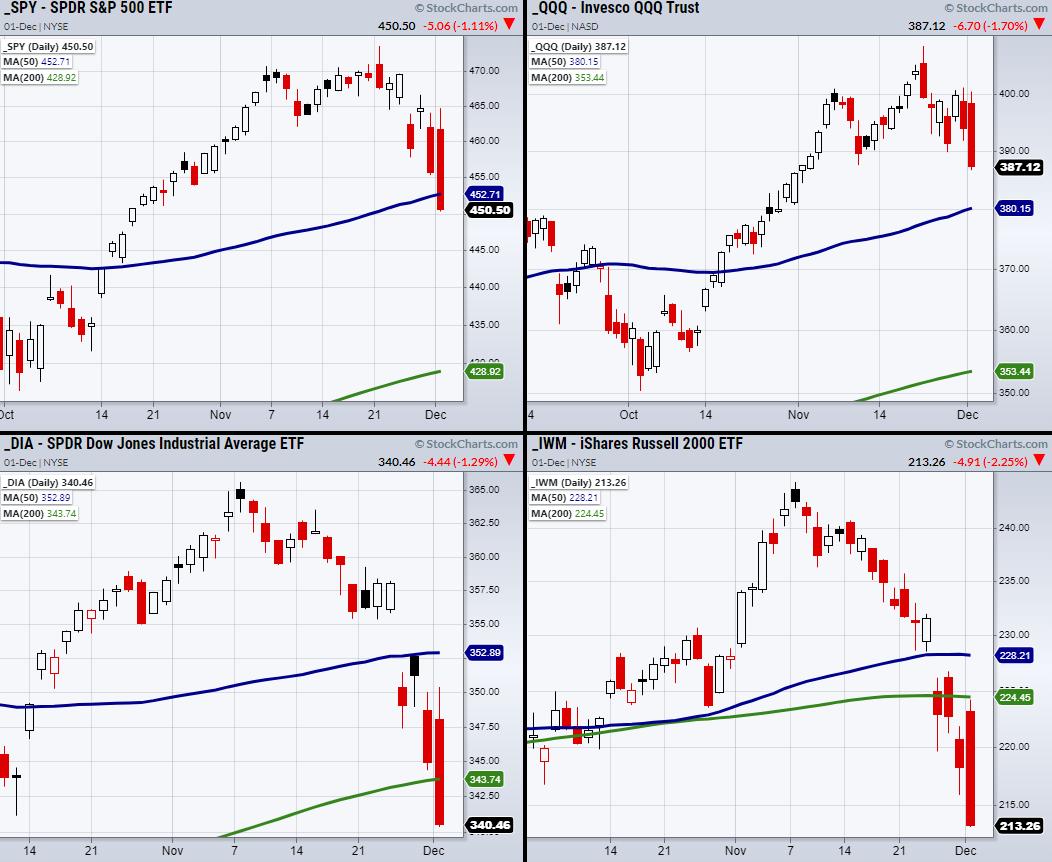
Is the Stock Market Turning Over?
Besides the Russell 2000 (IWM), the Nasdaq 100 (QQQ), S&P 500 (SPY) and the Dow Jones (DIA) have closed over Friday's high, creating a decent reversal. This has placed the four major indices in an interesting spot, as they were showing technical weakness before news surfaced...
READ MORE
MEMBERS ONLY

QQQ Teetering + Point & Figure Workshop TV Special

by Bruce Fraser,
Industry-leading "Wyckoffian"
The Point and Figure charting engine at StockCharts.com is an outstanding tool. It provides incredible flexibility to draw many varied types of PnF charts. Navigating the PnF chart controls is easy once they are understood.
Wyckoffians use these charts to estimate price objectives using a horizontal counting method. There...
READ MORE
MEMBERS ONLY
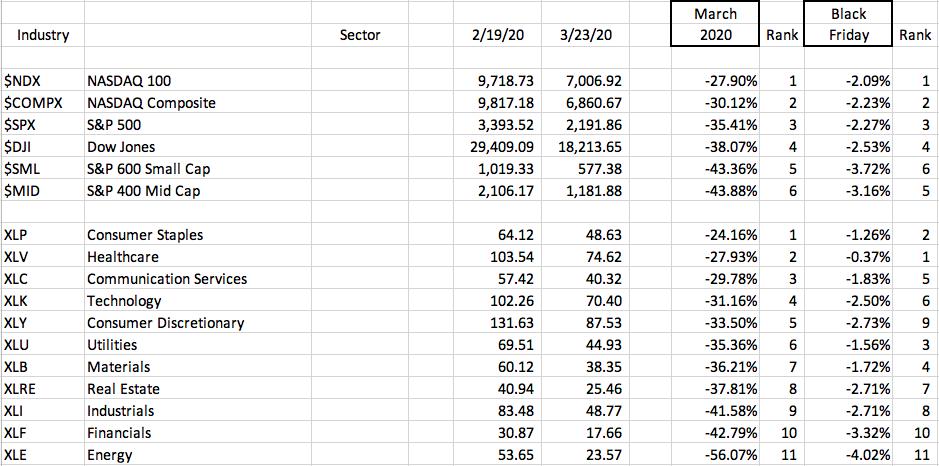
How Did Friday's Selling Compare To March 2020 Selling? My Takeaways
by Tom Bowley,
Chief Market Strategist, EarningsBeats.com
News that a new COVID-19 variant has surfaced in South Africa spooked global equity markets on Friday. Was it an overreaction and an opportunity to buy some of your favorite stocks cheaper? Or is the start of a much deeper, panic-driven selloff. Unless you're a scientist with inside...
READ MORE
MEMBERS ONLY
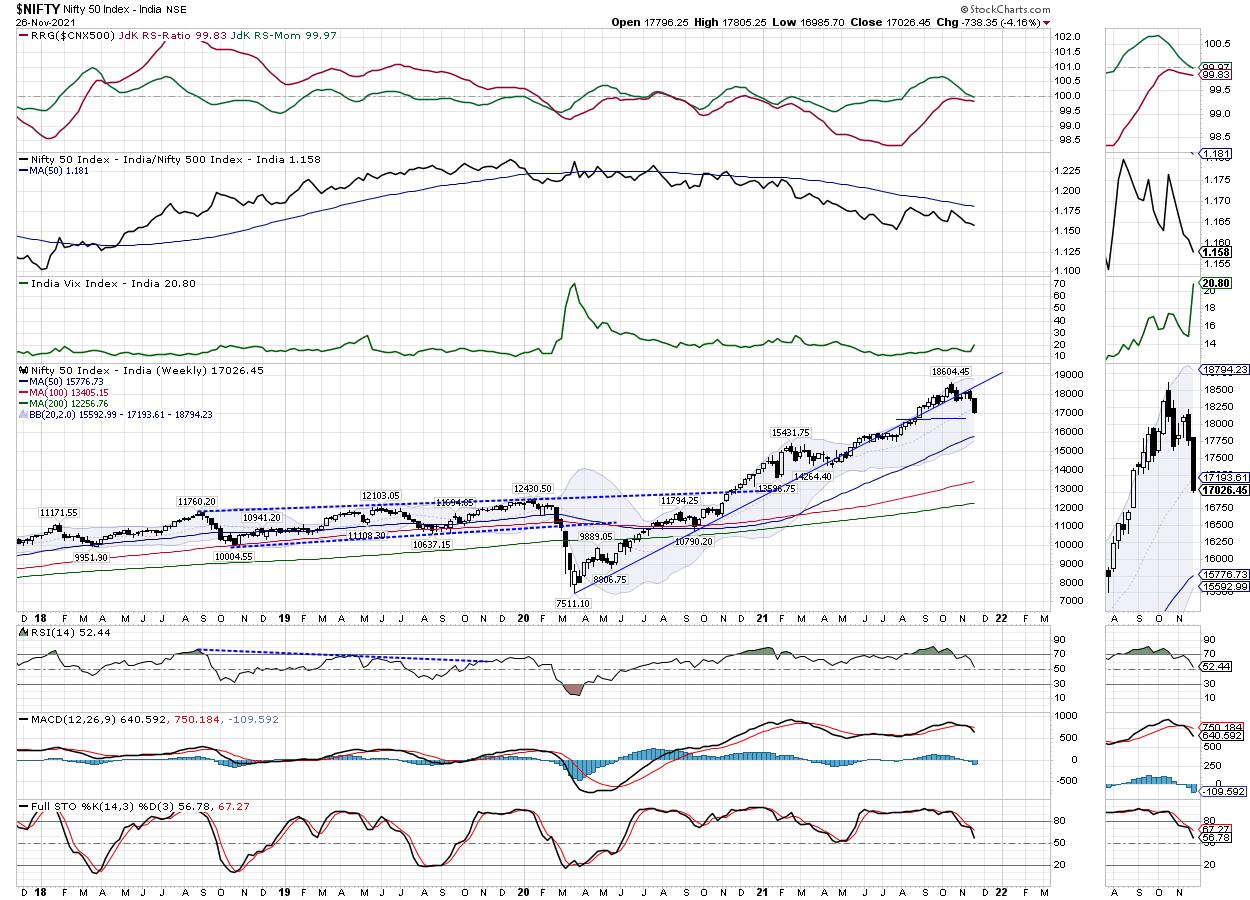
Week Ahead: NIFTY Set to Have Jittery Days Ahead; RRG Charts Show No Major Change in Sectoral Setup
by Milan Vaishnav,
Founder and Technical Analyst, EquityResearch.asia and ChartWizard.ae
The Indian equity markets were just consolidating and trying to find a base for themselves in the first four of the last five trading sessions. However, it was the last session of the week, on Friday, that did much of the undoing for the markets. Even though there were no...
READ MORE
MEMBERS ONLY
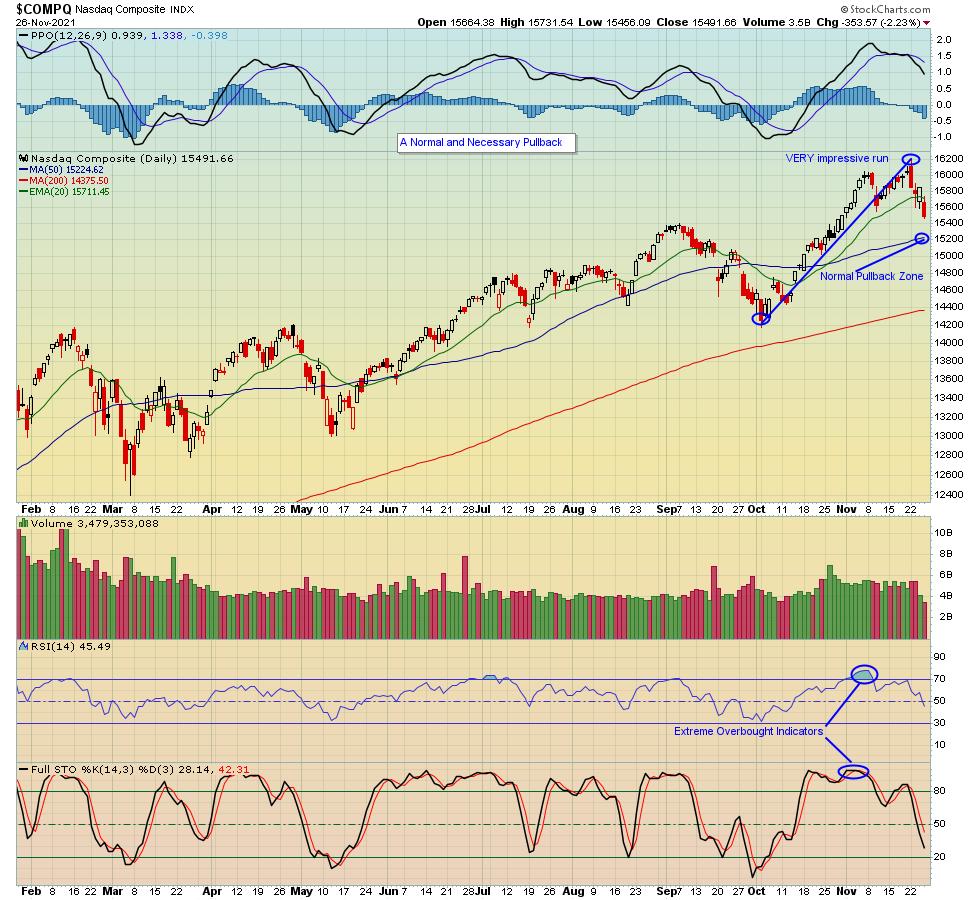
Trouble Ahead? Or Just a Hiccup?

by John Hopkins,
President and Co-founder, EarningsBeats.com
The news that a new variant has popped up spooked the market on Friday, with all of the major indexes getting hit hard. But the truth is the market had gotten overextended and really was in need of a pullback. It just so happens to be that the news about...
READ MORE
MEMBERS ONLY

Eight Things You Can Do To Boost The Profitability Of Your Own ChartLists

by Gatis Roze,
Author, "Tensile Trading"
Yes - believe it!
The organization of your ChartLists is an extremely high leverage investing activity that YOU control. It does and will determine your profitability. Hence, it's worthy of your time and effort. As I often quote the entrepreneur and investor Michael Dell, "You don'...
READ MORE
