MEMBERS ONLY

Trend Indicator Turns Bullish for IWM: What should we Expect?

by Arthur Hill,
Chief Technical Strategist, TrendInvestorPro.com
Moving averages are classic trend-following indicators and the 200-day SMA is perhaps the most widely used long-term moving average. This article will put the 200-day to the test using the Russell 2000 ETF (IWM).
The ETF just came off its best "trend" trade ever using the 5/200...
READ MORE
MEMBERS ONLY

A LONGER TERM LOOK AT OIL -- ENERGY STOCKS TESTING MAJOR TRENDLINE

by John Murphy,
Chief Technical Analyst, StockCharts.com
A LONGER TERM LOOK AT OIL... Energy inflation is grabbing a lot of headlines these days and for good reason. Energy prices are hitting the highest level in years. That includes natural gas and crude oil. Today's message will focus on the next potential upside target for oil....
READ MORE
MEMBERS ONLY
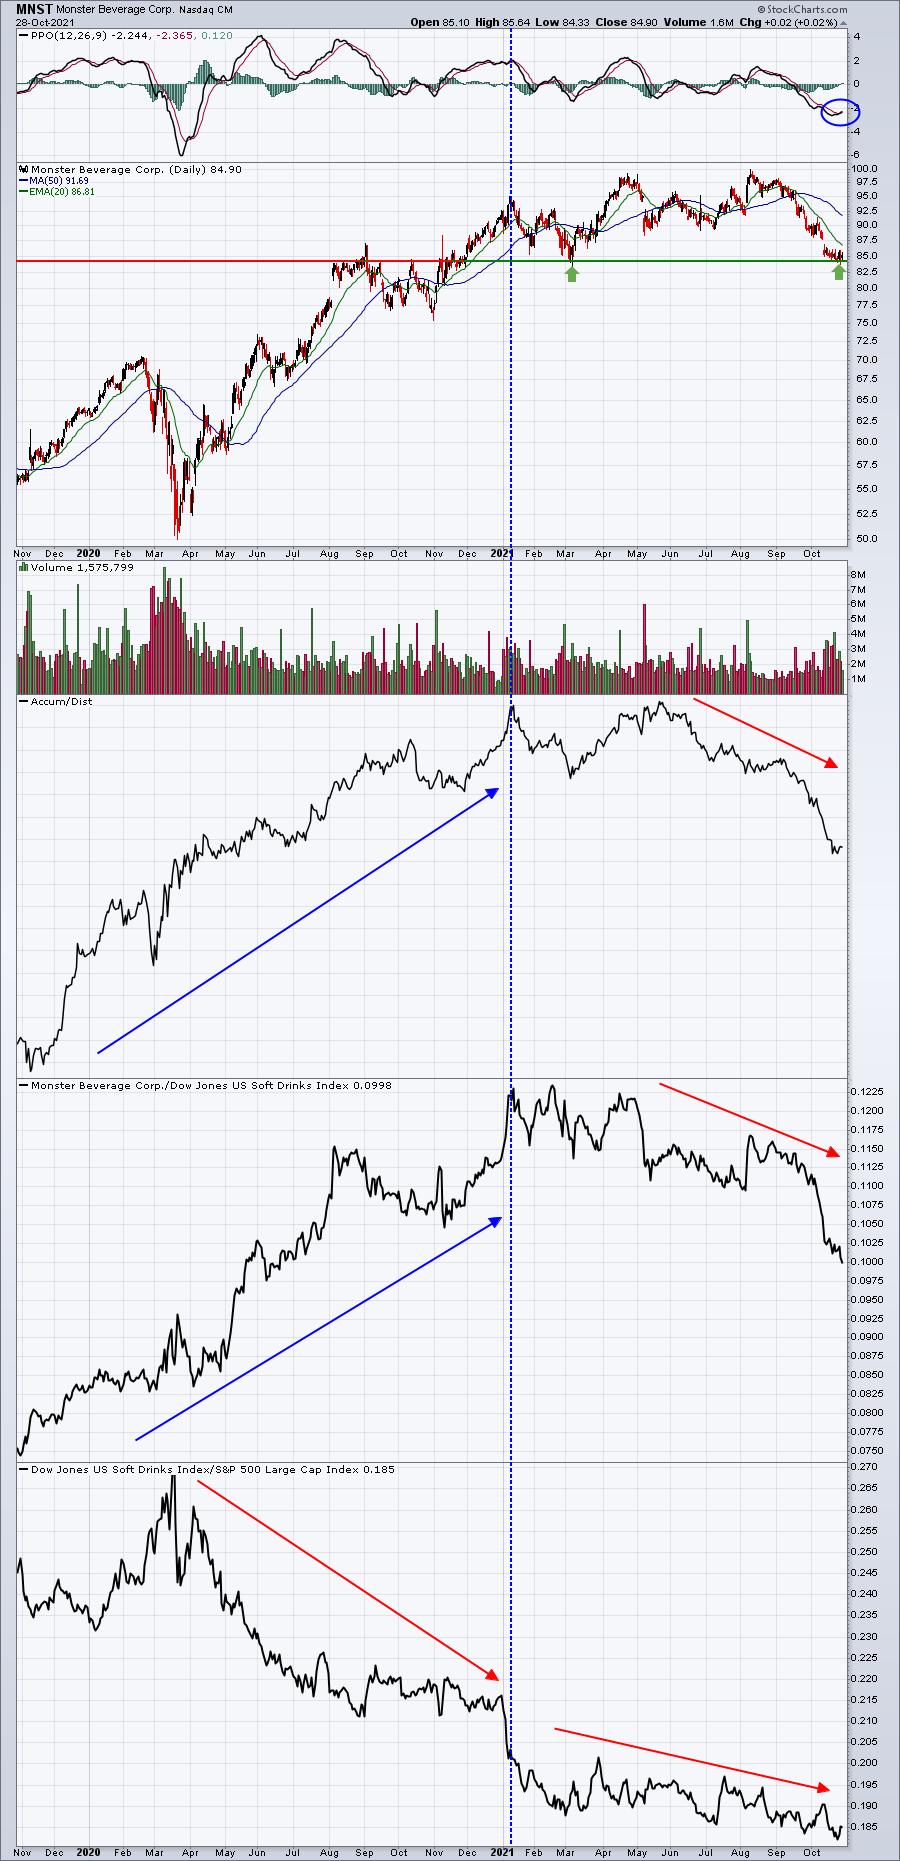
This Company is About to Start a Monster Seasonal Period

by Tom Bowley,
Chief Market Strategist, EarningsBeats.com
As we wrap up another October, it's time to start looking ahead at the seasonally bullish November period. U.S. equities have LOVED November for many years, as the S&P 500 has risen during November in each of the last 10 years. But which stocks ride...
READ MORE
MEMBERS ONLY

Is Market Melt-Up Possible?

by Carl Swenlin,
President and Founder, DecisionPoint.com
Lately I have been seeing many TV pundits predicting a market melt-up, so let's take a look at participation and see if there is a set-up compatible with that notion. Surely, the rally from the early-October lows is a good start on a melt-up, but the recent new...
READ MORE
MEMBERS ONLY

Chartwise Women: Managing Risk & Haunting Trades

by Mary Ellen McGonagle,
President, MEM Investment Research

by Erin Swenlin,
Vice President, DecisionPoint.com
On this week's edition of Chartwise Women, Mary Ellen and Erin talk risk and risk management. In keeping with Halloween season, Erin presents some "tricks & treats" charts and the two reminisce on "haunting" past trades.
This video was originally broadcast on October 14,...
READ MORE
MEMBERS ONLY

Learn to Trade Around a Core Holding

by Joe Rabil,
President, Rabil Stock Research
In this week's edition of Stock Talk with Joe Rabil, Joe discusses how he would add and reduce to a long-term holding that you like and want to hold as long as the trend is positive. He shows how many of the institutional portfolio managers he has worked...
READ MORE
MEMBERS ONLY

Identifying Intermediate Buying Opportunities with the Hourly Special

by Martin Pring,
President, Pring Research
Sometimes, when I mess around with the charts, I discover an entirely new approach that I had not thought of before. Last week saw one of those breakthrough moments when, for the first time ever, I applied the Special K to hourly charts and came up with some interesting results....
READ MORE
MEMBERS ONLY

Maybe not what you want, but probably what you need.

by Greg Morris,
Veteran Technical Analyst, Investor, and Author
Investing successfully for the long term requires a balance between give and take, choosing the pros and the cons of different investment approaches, taking the good with the bad, and accepting the risks with the rewards of investing. In other words, you can't have it both ways. You...
READ MORE
MEMBERS ONLY
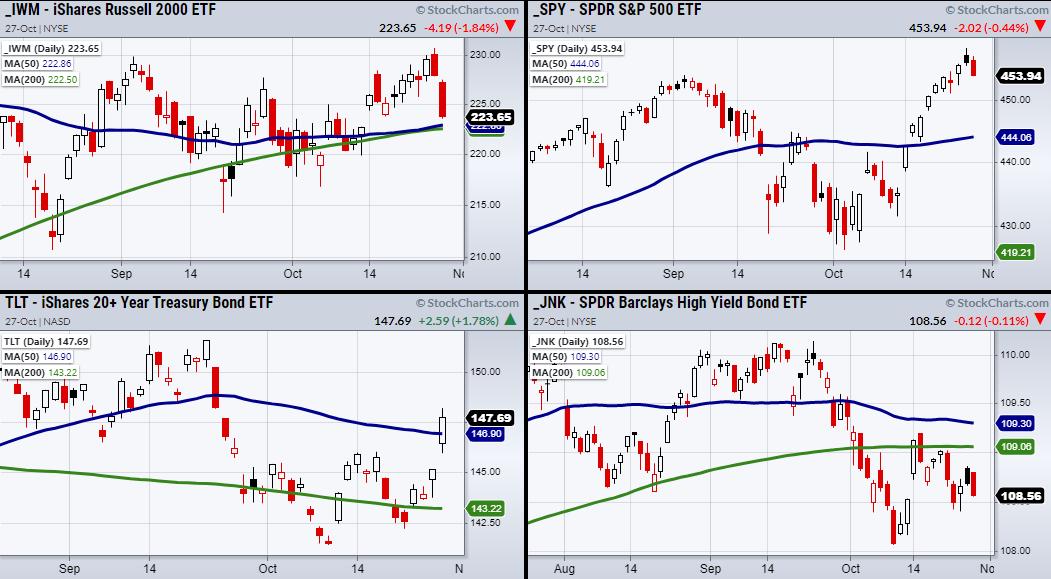
Rotation Into Big Cap Stocks -- Will It Last?
Both the tech-heavy Nasdaq 100 (QQQ) and the S&P 500 (SPY) sit near their recent breakout levels. This is a pivotal place for large-cap companies, as the small-cap Russell 2000 (IWM) has already given up almost two weeks of progress. Now, IWM will look for support from both...
READ MORE
MEMBERS ONLY

Go Where the Money Is!

by Dave Landry,
Founder, Sentive Trading, LLC
In this edition of Trading Simplified, Dave shows his methodology in action - both good and bad - including a new mystery chart. He then resumes his discussion on how inefficient markets are the holy grail by using IPOs and cryptos as examples. He highlights the fact that, even if...
READ MORE
MEMBERS ONLY
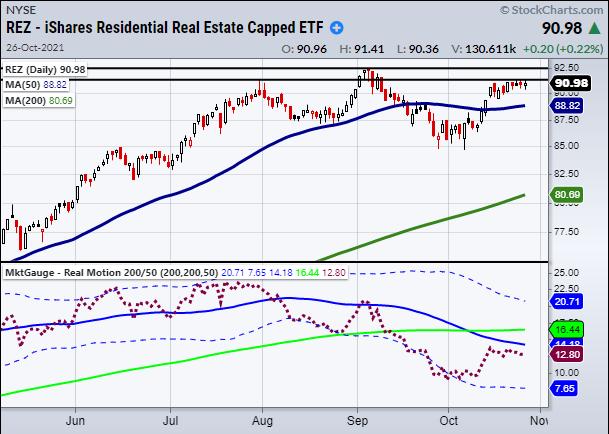
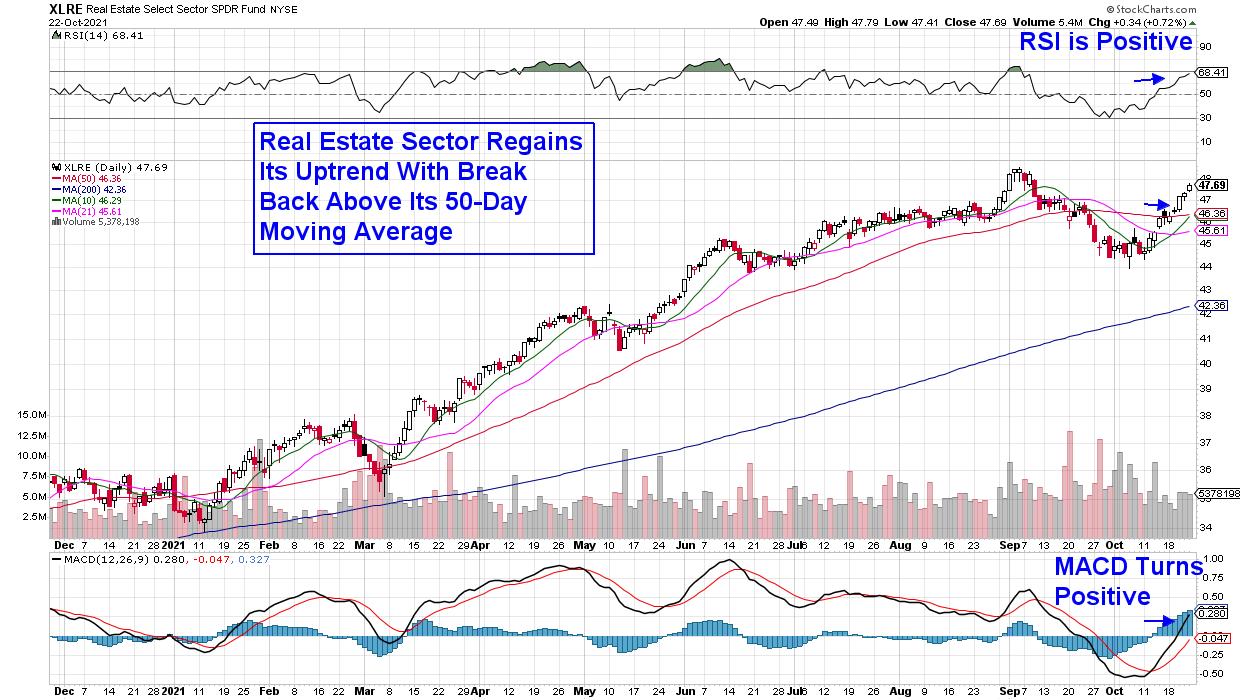
Has the Housing Market Topped?
Tuesday's market shows mixed price action amid positive earnings reports and a 14% increase in home sales for September.
Focusing on the residential sector, many are looking for a top of the market, as home sales have skyrocketed since the pandemic began. Residential and Multisector Real Estate ETF...
READ MORE
MEMBERS ONLY

Sector Spotlight: Strong Seasonal Trends for November

by Julius de Kempenaer,
Senior Technical Analyst, StockCharts.com
On this edition of StockCharts TV's Sector Spotlight, I take a quick look at the current state of Asset Class rotation through the RRG lens. After that, I move on to Sectors. After a quick assessment of last week's rotation, I bring in BETA again to...
READ MORE
MEMBERS ONLY
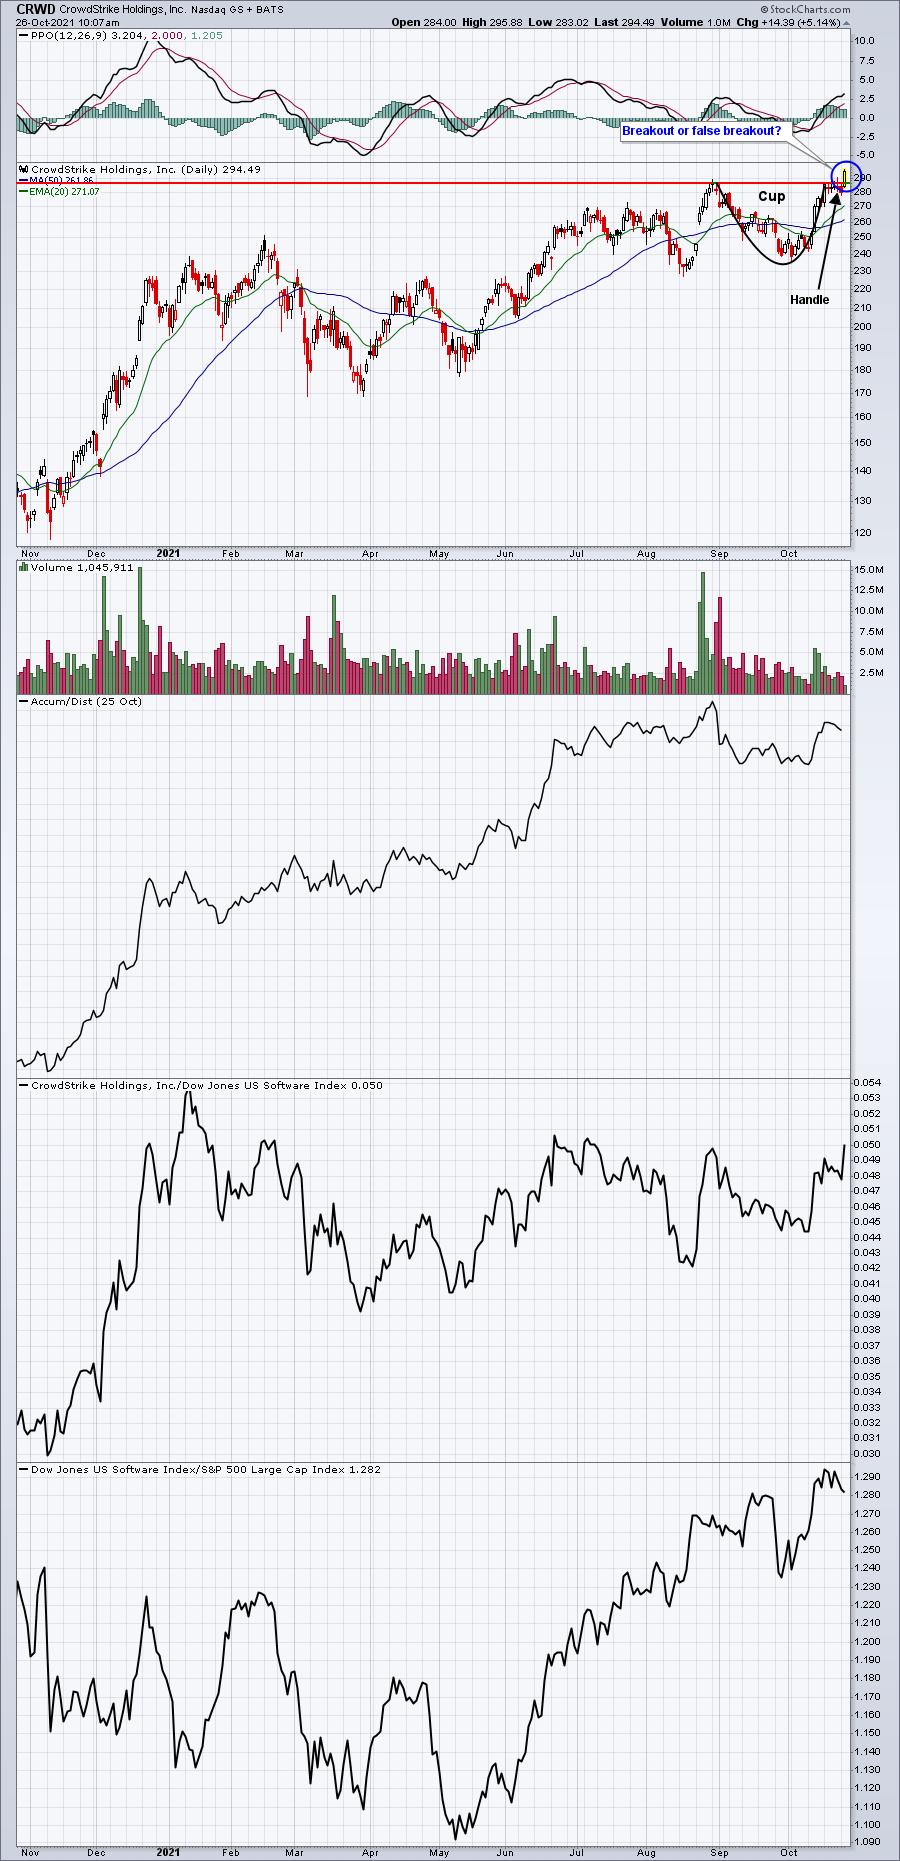
Catching Breakouts One at a Time - Here's Another
by Tom Bowley,
Chief Market Strategist, EarningsBeats.com
Earnings season presents so many opportunities, especially during a secular bull market advance. We appear to have another one of those advances underway and the daily opportunities are increasing. The difference between a breakout and a failed breakout, however, many times comes down to one simple number - the closing...
READ MORE
MEMBERS ONLY
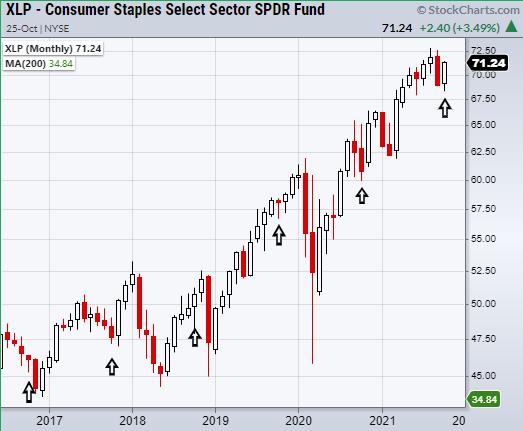
Why Is Consumer Staples (XLP) Outperforming the Season?
The Consumer Staples ETF (XLP) is known to be an area of focus through market downturns, as it offers exposure to companies that are historically safety plays. Some of XLP's biggest holdings include companies such as Walmart, Pepsi, Colgate and more. However, major indices are sitting at or...
READ MORE
MEMBERS ONLY

Natural Gas (UNG) "Personality" Suggests Rally Will Continue
by Erin Swenlin,
Vice President, DecisionPoint.com
(This is an excerpt from today's 10/25 DecisionPoint Alert article)
Natural Gas (UNG) had a huge rally today and looks bullish moving forward. We presented UNG as a "Diamond in the Rough" back on April 14th. The stop was never hit and the position, at...
READ MORE
MEMBERS ONLY

DP TV: Utilities is a Sleeper Sector
by Erin Swenlin,
Vice President, DecisionPoint.com
by Carl Swenlin,
President and Founder, DecisionPoint.com
On this episode of DecisionPoint, Carl opens the show with his take on the current market rally and reviews all of the "under the hood" indicators on the SPY. Carl and Erin comment on the health of all of the sectors. Erin takes a deep dive into the...
READ MORE
MEMBERS ONLY

Base Breakouts and Downtrend Reversals
by Mary Ellen McGonagle,
President, MEM Investment Research
On this episode StockCharts TV'sThe MEM Edge, Mary Ellen shares areas of the market that are setting up to outperform. She reviews base breakouts and downtrend reversals in companies that have reported strong earnings, and reveals new industry groups that are coming into play!
This video was originally...
READ MORE
MEMBERS ONLY
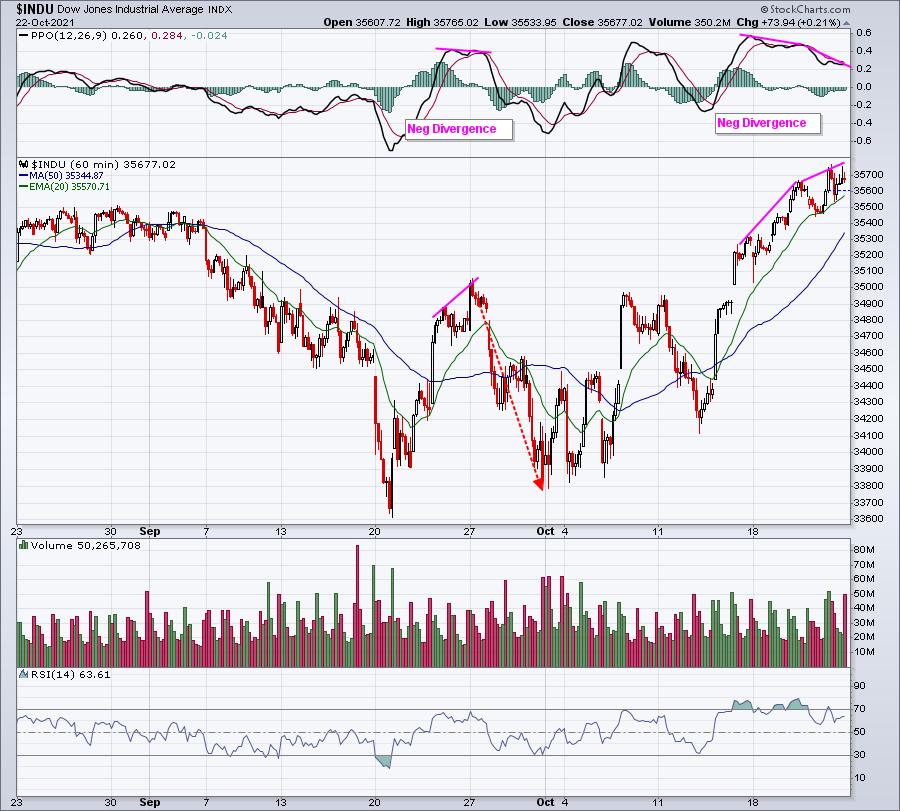
U.S. Equities Have One VERY Serious Short-Term Problem
by Tom Bowley,
Chief Market Strategist, EarningsBeats.com
When I began looking at my key index charts this morning, along with sector and industry charts, one thing became apparent very, very quickly. In the near-term, we appear to be running out of bullish momentum. 60-minute divergences are negative across many key indices, sectors, and industries, not to mention...
READ MORE
MEMBERS ONLY
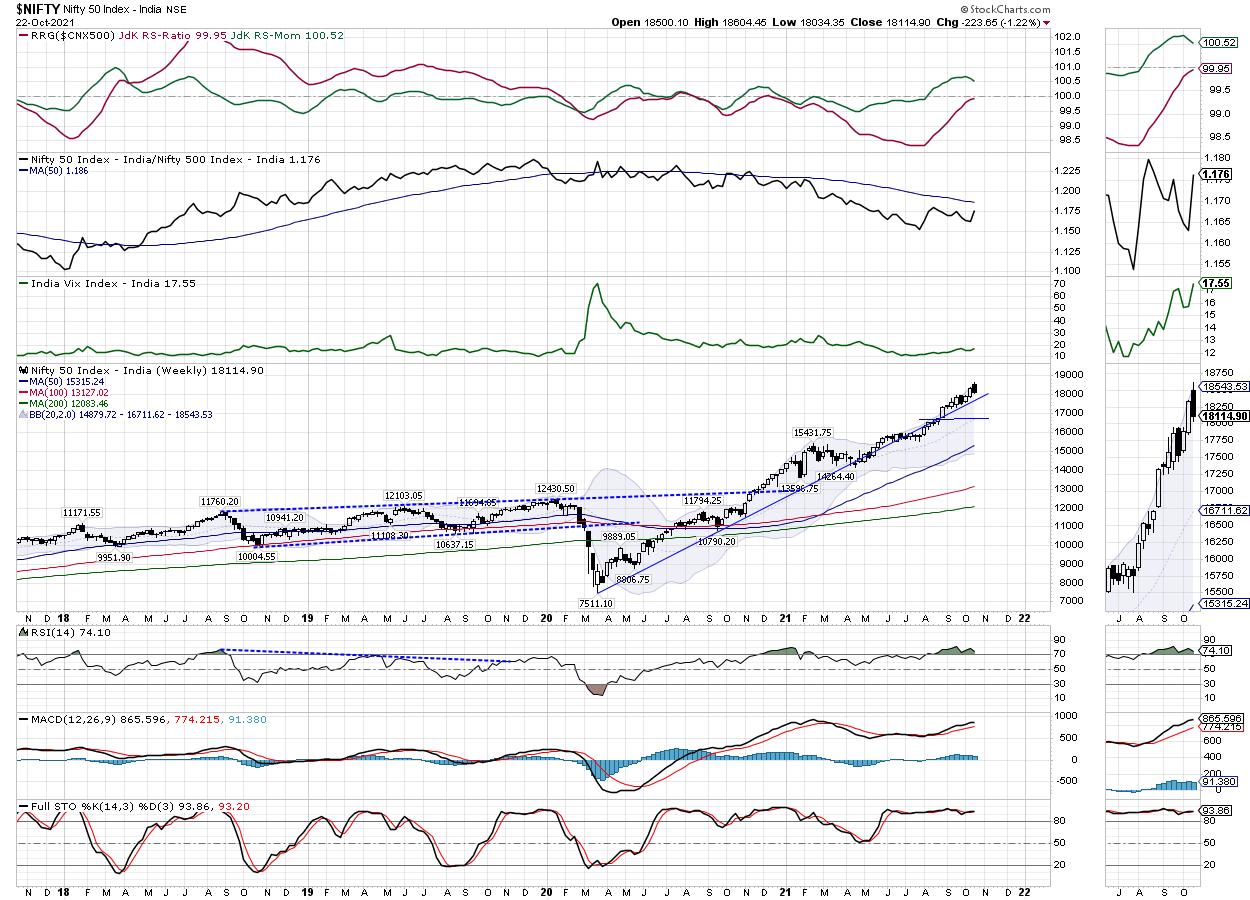
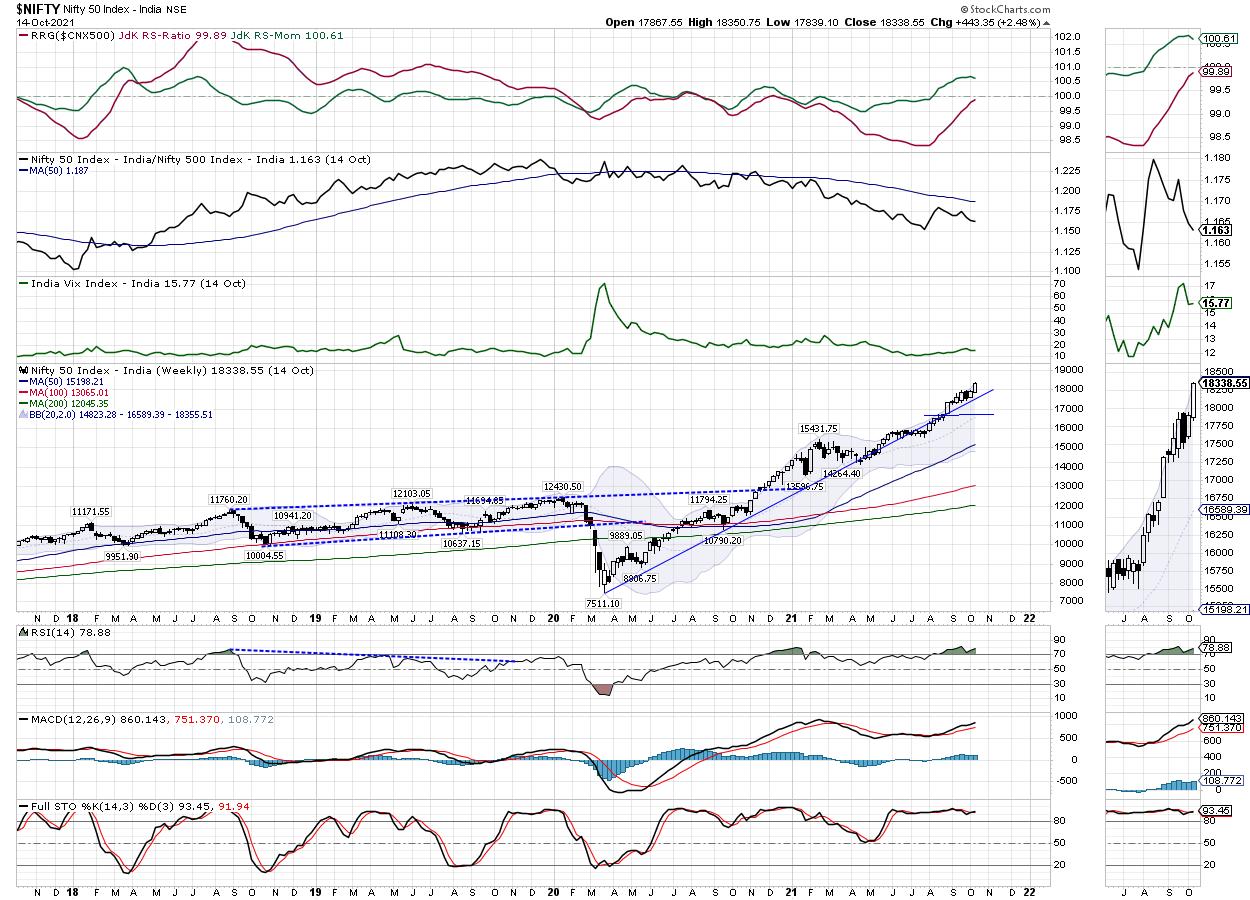
Week Ahead: NIFTY May Largely Stay In A Defined Range; These Sectors Are Showing Signs Of Relative Strength

by Milan Vaishnav,
Founder and Technical Analyst, EquityResearch.asia and ChartWizard.ae
After testing a fresh lifetime high at 18604, the Indian equity markets slipped into some corrective consolidation within a broad range. The bulk of the previous week was spent in the corrective mode as the NIFTY rapidly lost ground after testing a fresh lifetime high. The past five days saw...
READ MORE
MEMBERS ONLY

Get the Jump by Timing the Swing within the Pattern
by Arthur Hill,
Chief Technical Strategist, TrendInvestorPro.com
The Infrastructure ETF (IFRA) came to life here in October with a six percent surge that could signal the beginning of the end for a long correction. IFRA underperformed from May to mid September, but is now showing some relative strength. We will look at the long-term picture and show...
READ MORE
MEMBERS ONLY

Did Jerome Powell Jump Scare the Major Stock Indices?
Friday, the chair of the Federal Reserve –Jerome Powell spooked the market when he announced that the Fed would keep rates near zero and continue with its tapering schedule. Though the market cannot blame Powell for stating already well-known information, it was enough to help create an intra-day selloff.
While...
READ MORE
MEMBERS ONLY
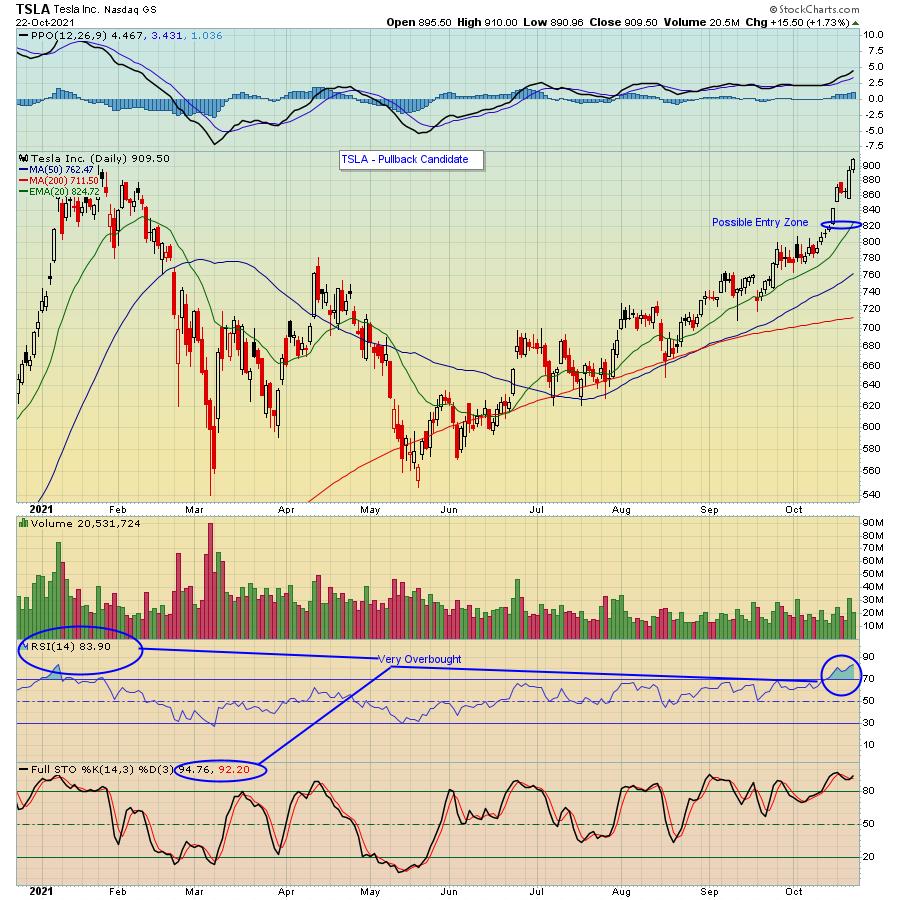
Earnings Season Presents Great Buying Opportunities

by John Hopkins,
President and Co-founder, EarningsBeats.com
Tesla (TSLA) reported its earnings last week with the stock getting a nice boost in spite of a steady move higher since its mid May low. In fact, the company notched an all-time high on Friday as it exceeded $900 for the first time.
TSLA wasn't the only...
READ MORE
MEMBERS ONLY
Fed Chair Fears Inflation - Here's An Uptrending Area And Stocks That Are A Great Hedge
by Mary Ellen McGonagle,
President, MEM Investment Research
Fed Chair Powell signaled new concerns about inflation today after remarking that global supply-chain constraints and shortages that have led to elevated inflation "are likely to last longer than previously expected". He also added that "it is still the most likely case" that it will last...
READ MORE
MEMBERS ONLY
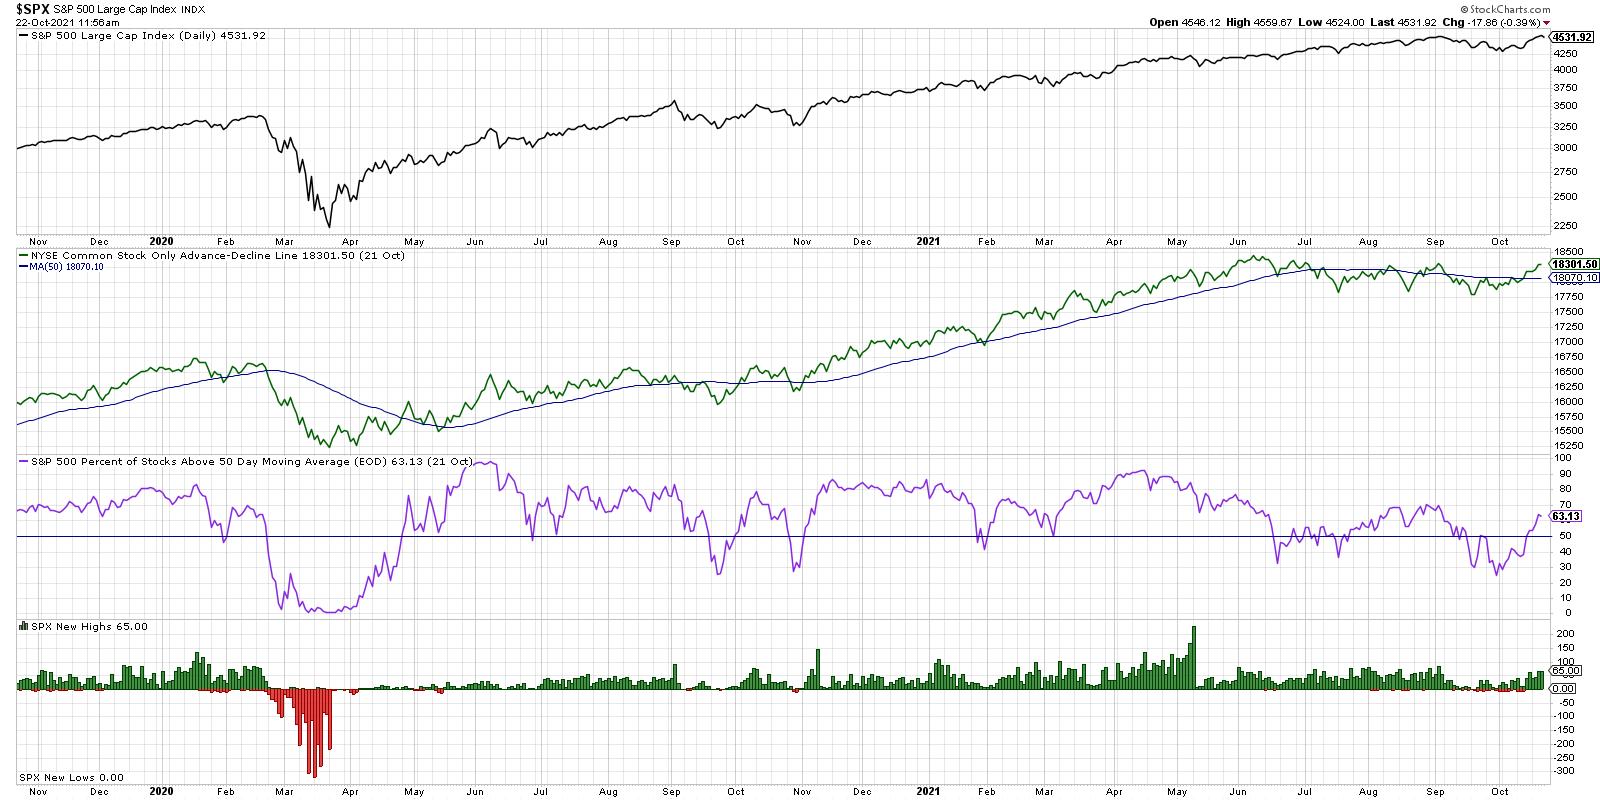
Why Breadth Matters as S&P Tests 4550

by David Keller,
President and Chief Strategist, Sierra Alpha Research
The worst crime that an analyst can commit is remaining bearish in the face of a rising market. -Richard Russell
The S&P 500 has now round tripped from its early September high around 4550 and the low around 4300 in early October. Will there be enough buying power...
READ MORE
MEMBERS ONLY
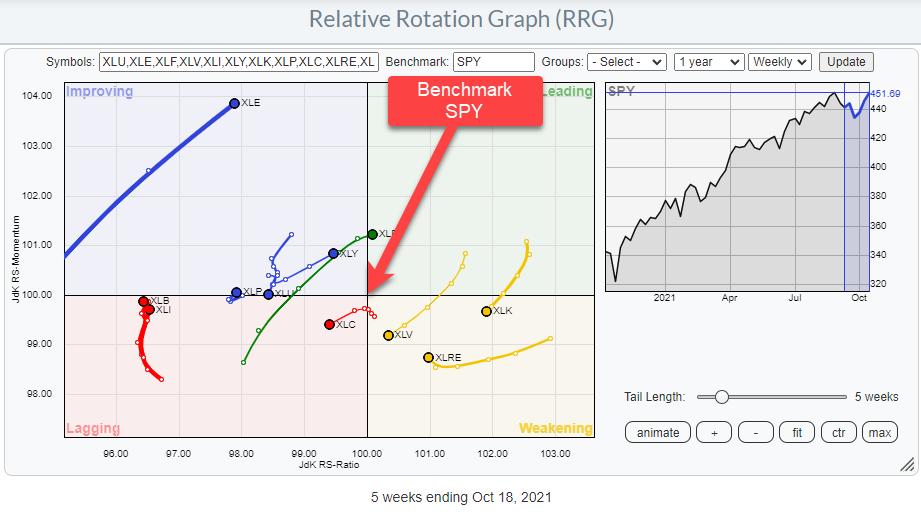
What You Need to Know About Universes and Benchmarks on RRG
by Julius de Kempenaer,
Senior Technical Analyst, StockCharts.com
The two crucial elements of a Relative Rotation Graph (RRG) are the "universe" and the "benchmark".
The Benchmark
The benchmark for a Relative Rotation Graph is the common denominator for all securities that are present in the universe. Theoretically, the benchmark can be any index or...
READ MORE
MEMBERS ONLY

RAILS AND TRUCKERS LEAD THE TRANSPORTS HIGHER
by John Murphy,
Chief Technical Analyst, StockCharts.com
DOW TRANSPORTS CONTINUE TO RALLY... While the Dow Industrials continue to test their old highs, transportation stocks continue to act much stronger. Chart 1 shows the Dow Transports rising today to the highest level in nearly five months. That shouldn't be too surprising with companies dealing with supply...
READ MORE
MEMBERS ONLY
Chartwise Women: Knowledge is Power During Earnings Season
by Mary Ellen McGonagle,
President, MEM Investment Research
by Erin Swenlin,
Vice President, DecisionPoint.com
On this week's edition of Chartwise Women, Mary Ellen and Erin talk all about earnings season! The pair explain why earnings season is so important and share stocks that have propelled the market into an uptrend. The duo also discuss how having expert knowledge can really set you...
READ MORE
MEMBERS ONLY
Learn to Improve Timing and Reduce Risk with Multiple Time Frames
by Joe Rabil,
President, Rabil Stock Research
In this week's edition of Stock Talk with Joe Rabil, Joe explains how he uses 2 time frames side-by-side to identify trades with low risk. He discusses the "opposing trend trigger", where it came from and how it can be used to improve timing and lower...
READ MORE
MEMBERS ONLY
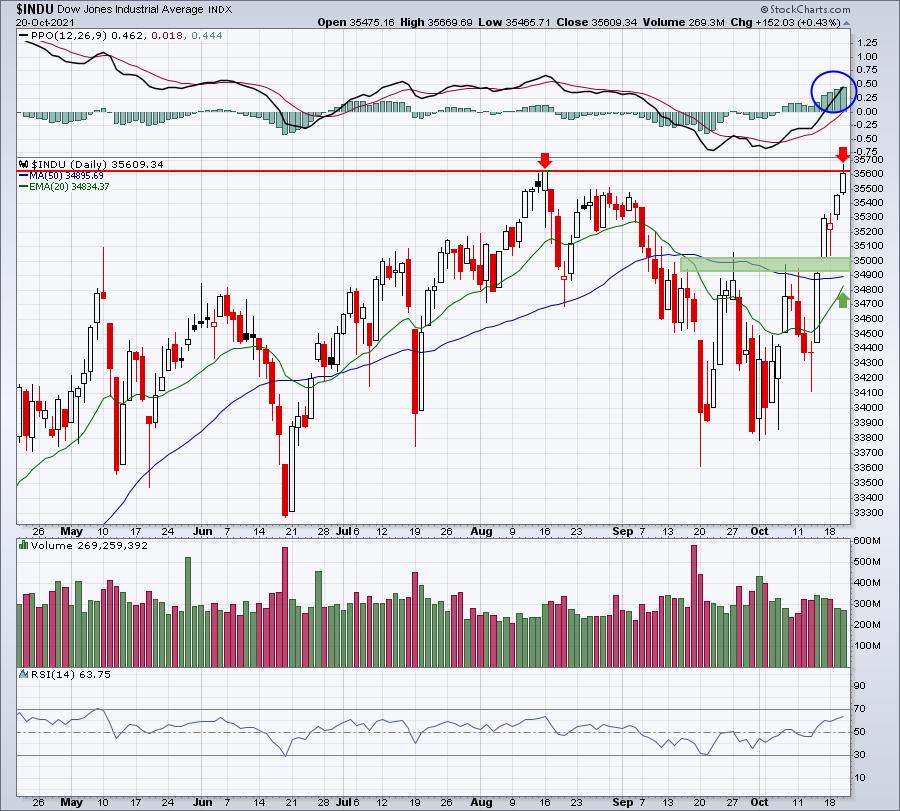
Could We Have Just Topped?
by Tom Bowley,
Chief Market Strategist, EarningsBeats.com
I guess the first question I'd ask is, "Are we talking about the short-term or the long-term?" Because I'd say there's very little chance that we've just reached a long-term top. But could this be a short-term top? Absolutely. Let...
READ MORE
MEMBERS ONLY
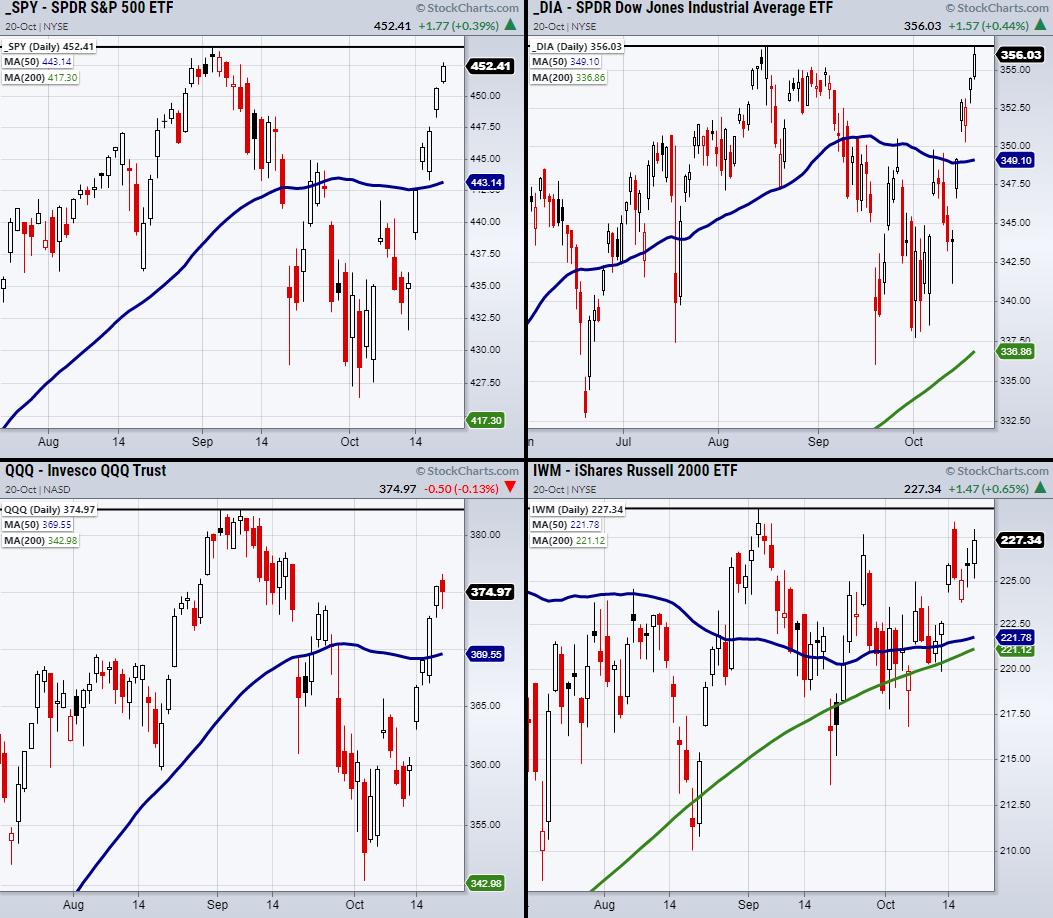
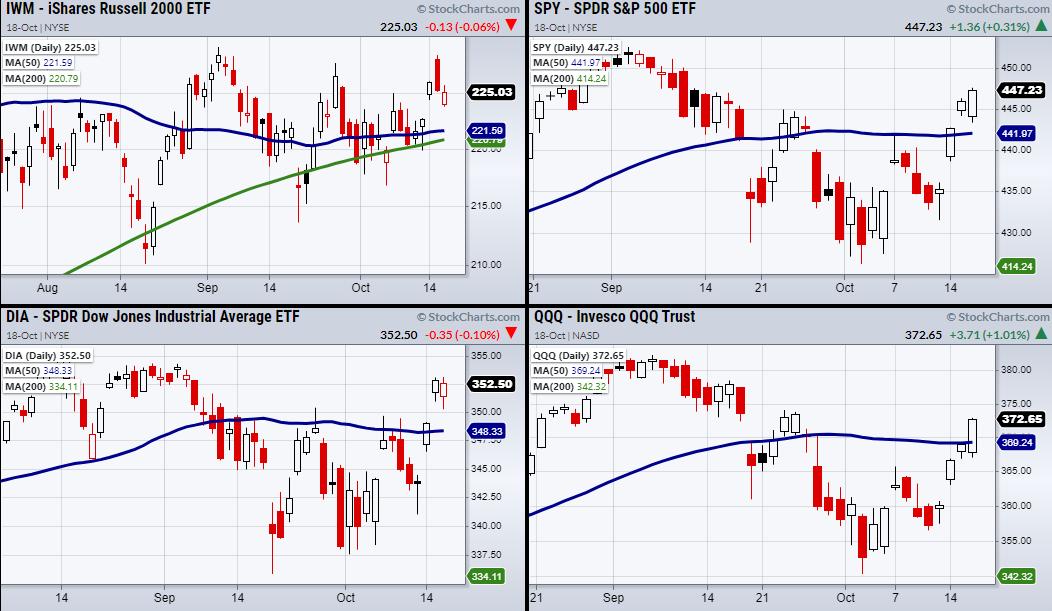
Can the Major Indices Clear Their Pivotal Resistance Levels?
Both the S&P 500 (SPY) and the Dow Jones (DIA) are poised to hit new highs, while the Nasdaq 100 (QQQ) and the small-cap index Russell 2000 (IWM) have a bit more territory to clear. The above chart shows pivotal areas to clear in each index (Black Line)...
READ MORE
MEMBERS ONLY

Which Asset Class is Likely to Outperform Going Forwards?
by Martin Pring,
President, Pring Research
The business cycle undergoes a set series of chronological sequences, just like the calendar year goes through seasons. Over the course of many decades, economists have recognized this phenomenon and devised composite indicators to follow this progression. By way of an example, the Conference Board publishes leading, coincident and lagging...
READ MORE
MEMBERS ONLY

Impending Super Cycle Commodity Signal Argues Against Transitory Inflation
by Martin Pring,
President, Pring Research
Aging demographics, technological innovation and an ever-expanding debt overhang are three reasons why inflation has been largely kept under wraps in the last three decades. They are still relevant, so why not extrapolate a benign inflation trend into the future?
One reason might lie in the Fed's extraordinary...
READ MORE
MEMBERS ONLY
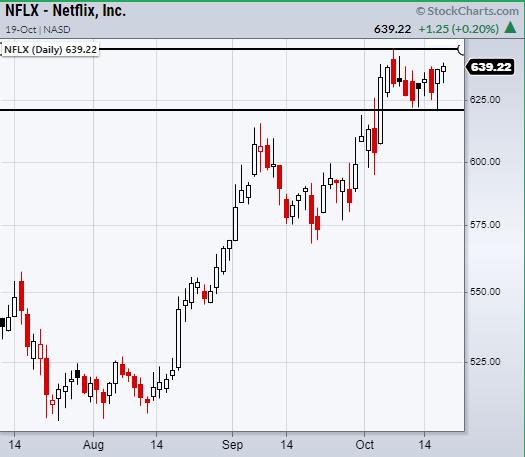
Key Price Levels to Watch for an Active Netflix (NFLX) Trade
Netflix (NFLX) will report earnings after Tuesday's market close. Although previous earnings for the company have been dreary at best, with an average earnings surprise of less than half a percent for the past three quarters, investors are now looking for a major improvement.
The most common cause...
READ MORE
MEMBERS ONLY
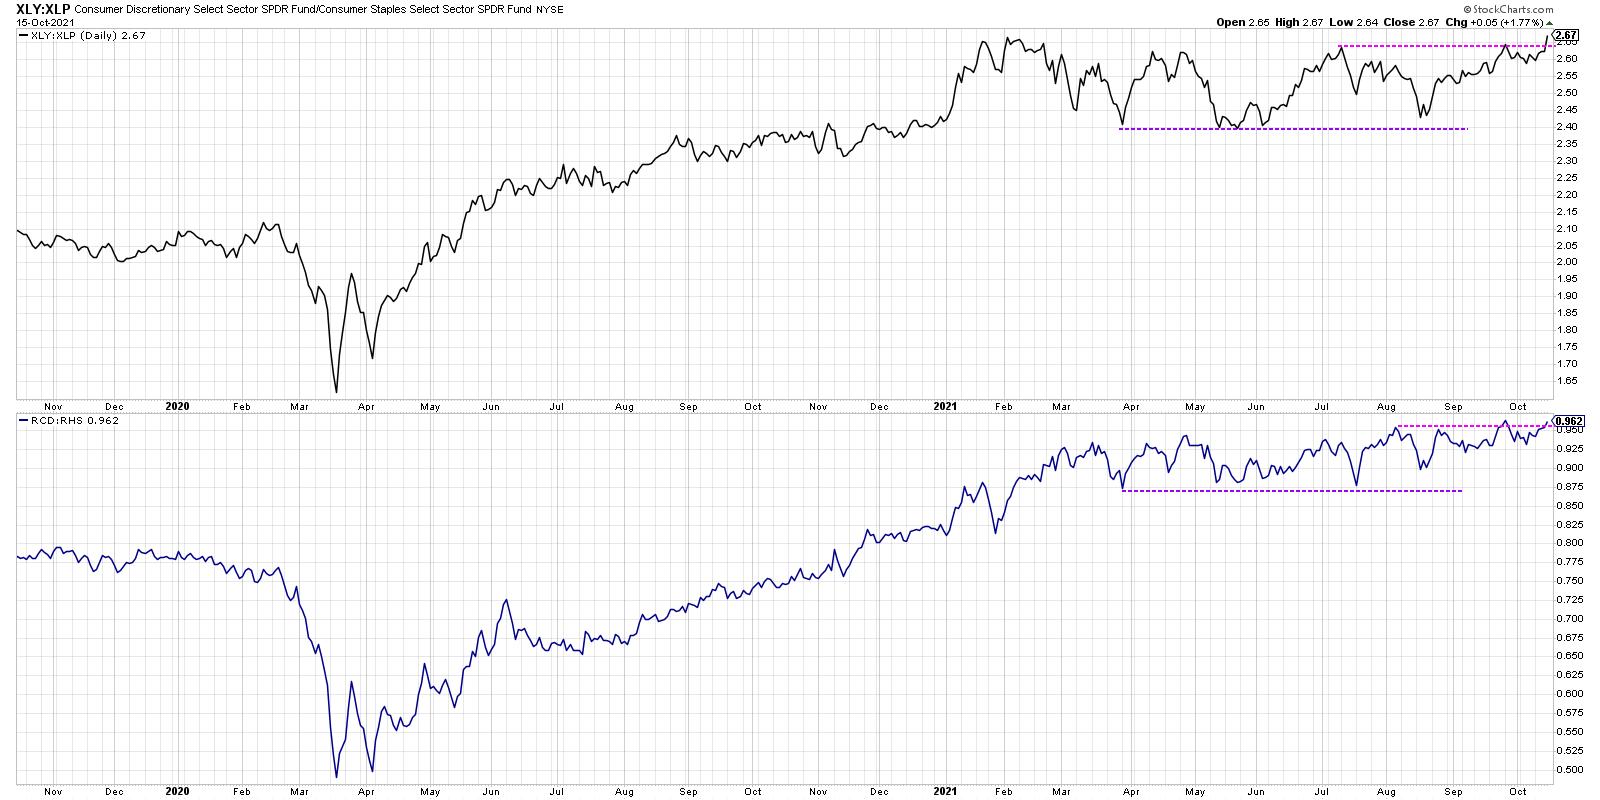
Sector Spotlight: Offense Pulling Away While SPY Improves
by Julius de Kempenaer,
Senior Technical Analyst, StockCharts.com
On this edition of StockCharts TV's Sector Spotlight, I dive into the current state of sector rotation and highlight the relationship between the Consumer Discretionary and Consumer Staples sectors, as Discretionary is trying to pull away after a period of indecisiveness. The XLP:XLY ratio is breaking out...
READ MORE
MEMBERS ONLY
Why We are Watching These Two Companies Through Thursday's Trading Session
Earnings season has taken the stage for the next couple of weeks as the market steadies itself for another move higher. Of course, another push higher means that companies will need to outperform or show signs of continued growth into the fourth quarter. So far, the financial sector has started...
READ MORE
MEMBERS ONLY
DP TV: Tech and Rare Earth Metals Very Bullish!
by Erin Swenlin,
Vice President, DecisionPoint.com
After reviewing the DecisionPoint indicators and discussing last week's upside climax, Erin takes a deep dive into the sectors on this episode of DecisionPoint, focusing on Technology (XLK) chart with very bullish "under the hood" indicators. She walks viewers through rare earth metals, uranium, lithium and...
READ MORE
MEMBERS ONLY
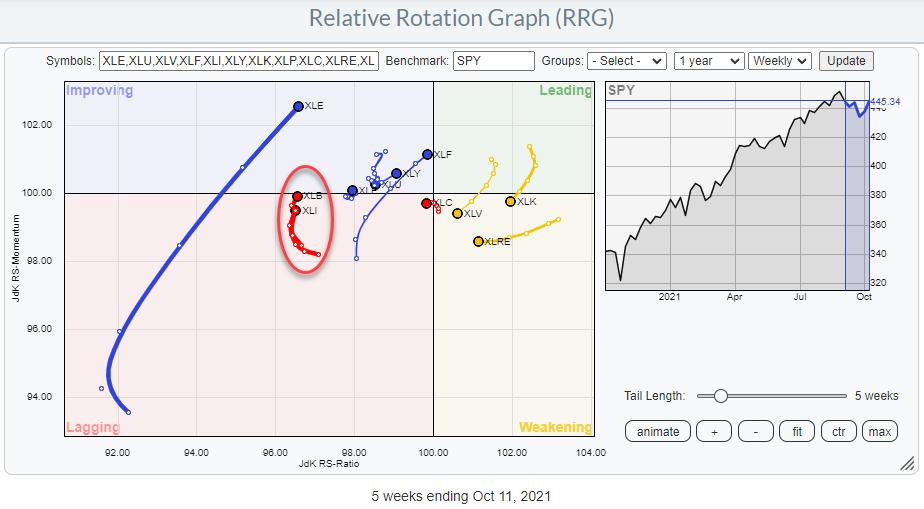
Sector Rotation Remains Confusing, But S&P Chart Improves
by Julius de Kempenaer,
Senior Technical Analyst, StockCharts.com
The sector rotations on the Relative Rotation Graph are still confusing. The Consumer Staples and Discretionary sectors are currently moving in the same direction where they normally move in opposite directions. Based on rising rates, one would expect both Banks/Financials and Real-Estate to benefit, but where XLF is definitely...
READ MORE
MEMBERS ONLY
Week Ahead: Buoyant NIFTY May Positively Consolidate; RRG Charts Show Sector-Specific Shows May Continue
by Milan Vaishnav,
Founder and Technical Analyst, EquityResearch.asia and ChartWizard.ae
In the interrupted week that was truncated on account of Dussehra on Friday, the Indian equity markets traded very much on the expected and analyzed lines. In the previous note, it was mentioned that, given the structure of the technical patterns and the analysis of F&O data, the...
READ MORE
MEMBERS ONLY
Three Charts to Watch Through Year-End
by David Keller,
President and Chief Strategist, Sierra Alpha Research
This has been a confusing market in so many ways. The S&P 500 moved higher for the first nine months of the year, but many stocks had a very different experience over that time frame. Leadership themes have rotated a number of times, with growth- and value-oriented sectors...
READ MORE
MEMBERS ONLY
Finding Top Opportunities for New Bull Trend
by Mary Ellen McGonagle,
President, MEM Investment Research
This week on StockCharts TV'sThe MEM Edge, Mary Ellen shares top opportunities within the markets following last week's move into a bullish position. She also reviews Industrial and Material stocks poised to participate in the rotation into these sectors.
This video was originally recorded on October...
READ MORE
