MEMBERS ONLY

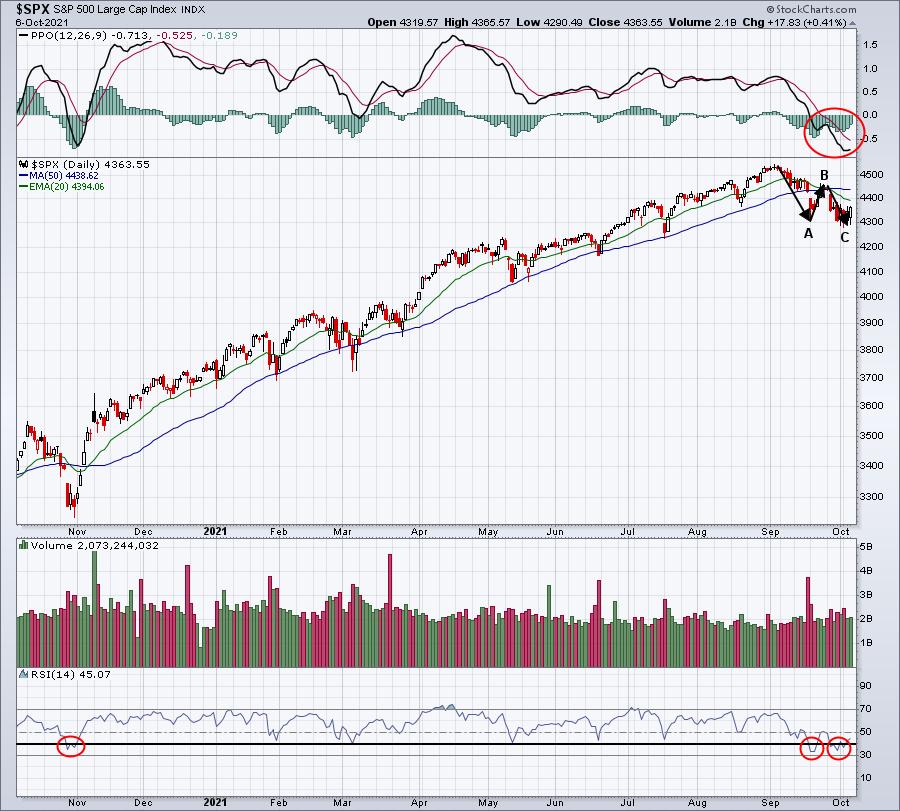
There is a Pretty Good Chance the Correction is Over

by Martin Pring,
President, Pring Research
The S&P peaked in early September, but most other major averages and many internal indicators of breadth have been rangebound since March. Price action this week, though, suggests that there is a good chance this corrective process has run its course and we will see significant new highs...
READ MORE
MEMBERS ONLY

Mortgage Rates are Rising - This Chart Says They Will Move Higher Still

by Erin Swenlin,
Vice President, DecisionPoint.com

by Carl Swenlin,
President and Founder, DecisionPoint.com
(This is an excerpt from Thursday's (10/14) DecisionPoint Alert)
We want to watch the 30-Year Fixed Mortgage Interest Rate, because, for the most part, people buy homes based upon the maximum monthly payment they can afford. As rates rise, a fixed monthly payment will carry a smaller...
READ MORE
MEMBERS ONLY

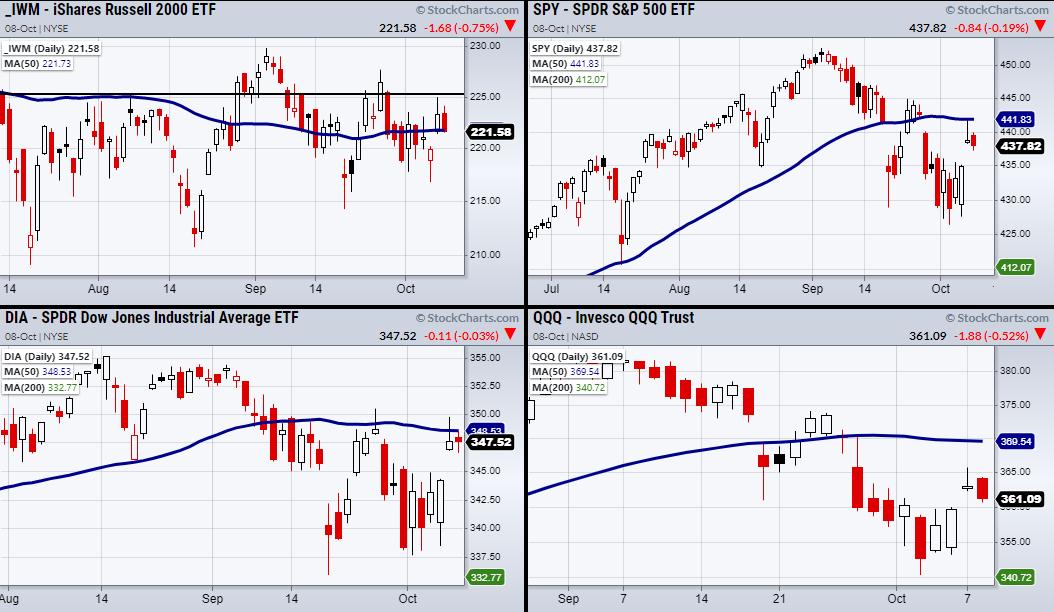
Are the Major Indices Geared for Another Move Up on Monday?
As seen on the above chart, two of the major indices, including the S&P 500 (SPY) and the Dow Jones (DIA) cleared prior resistance from their 50-day moving averages (DMA). On the other hand, the Russell 2000 (IWM) has resistance near $230 and the Nasdaq 100 (QQQ) has...
READ MORE
MEMBERS ONLY

Follow Through with A Big Participation Pop

by Arthur Hill,
Chief Technical Strategist, TrendInvestorPro.com
Stocks surged for the second Thursday in as many weeks, but this Thursday's surge was a lot different than the previous week. This week's surge featured a strong open and strong close as well as the strongest breadth in four months. What does it mean going...
READ MORE
MEMBERS ONLY
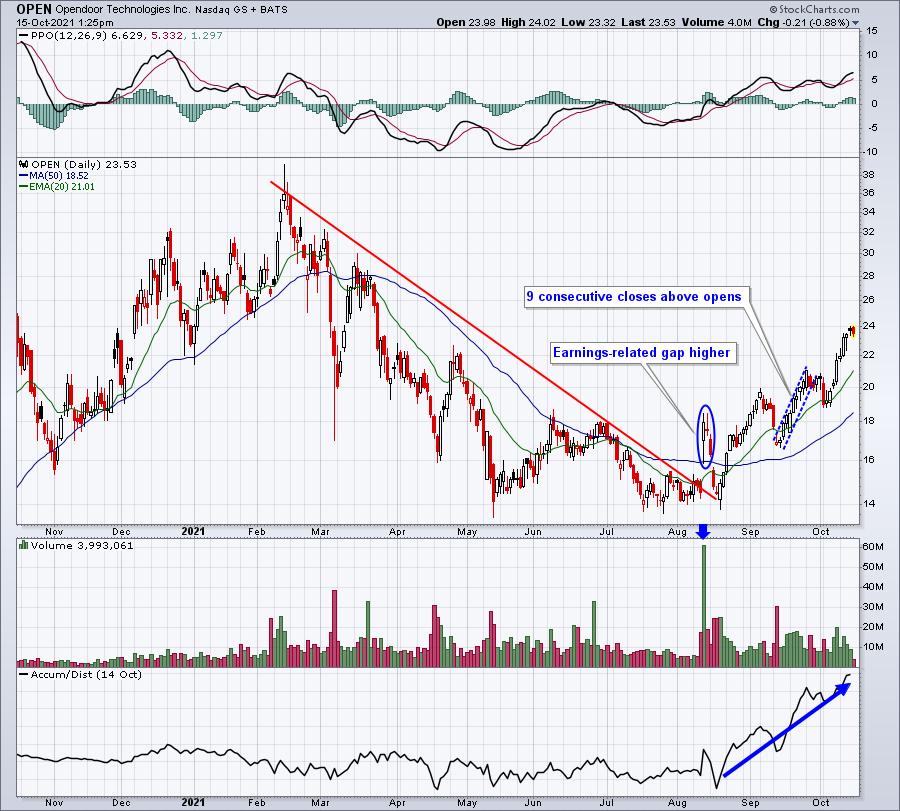
Finding Stocks Under Heavy Accumulation - Three Examples of What I Look For

by Tom Bowley,
Chief Market Strategist, EarningsBeats.com
On September 28th, I wrote a "Trading Places" blog article titled "Rising Yields Have A History of Favoring These Stocks; One Such Stock is Being Heavily Accumulated". The stock I wrote about was Opendoor Technologies (OPEN), which, after pulling back temporarily, has exploded higher recently. A...
READ MORE
MEMBERS ONLY

STOCK INDEXES END WEEK ON A STRONG NOTE -- CONSUMER DISCRETIONARY AND FINANCIALS ARE HITTING NEW RECORDS

by John Murphy,
Chief Technical Analyst, StockCharts.com
STOCK INDEXES CLEAR 50-DAY LINES... Stocks are rising again today following yesterday's strong rally. And their technical condition is looking stronger. Chart 1 shows the Dow Industrials rising to the highest level in a month and moving back above its blue 50-day average. Chart 2 shows the S&...
READ MORE
MEMBERS ONLY

PayPal Holdings (PYPL) Looks Like A Solid Long-Term Buy
by Tom Bowley,
Chief Market Strategist, EarningsBeats.com
When I look at longer-term trading opportunities, I typically step back and view the weekly charts, which differs from my typical review of daily charts. There are times, however, that the bigger picture shows opportunities that you cannot see on the daily chart. Let me show you two charts of...
READ MORE
MEMBERS ONLY
Hips Don't Lie, But Lips Do
by Tom Bowley,
Chief Market Strategist, EarningsBeats.com
I follow the money. Not the hype. Not the talk. Just show me the money! I remember growing up and learning to play basketball. Defensively, my first coach told me to "follow their hips". They can fake you with their eyes, they can fake you with their legs,...
READ MORE
MEMBERS ONLY

Chartwise Women: Motivational Investing

by Mary Ellen McGonagle,
President, MEM Investment Research
by Erin Swenlin,
Vice President, DecisionPoint.com
On this week's edition of Chartwise Women, Mary Ellen and Erin share their tips and insights to staying motivated while navigating rough investment waters. During "Chart Chat", they show you diamond in the rough charts that they find exciting.
This video was originally broadcast on October...
READ MORE
MEMBERS ONLY

Find Profitable Setups with the ADX Indicator

by Joe Rabil,
President, Rabil Stock Research
In this week's edition of Stock Talk with Joe Rabil, Joe explains two different types of low ADX patterns to watch for. He also discusses a few screens for low ADX as well. He then analyzes the stock requests from viewers for the week, including AAL, LPX and...
READ MORE
MEMBERS ONLY
Will the Fed Admit They are Wrong About Transitory Inflation?
For the past year, the Fed has stuck to its guns on the idea that supply-chain disruptions are causing a short-term increase in inflation and that, in 2022, inflation will decrease towards their 2% target. However, with continuous news of job shortages, shipping problems, rising food costs and more, it...
READ MORE
MEMBERS ONLY

Finding the REAL Money

by Dave Landry,
Founder, Sentive Trading, LLC
In this edition of Trading Simplified, Dave shows that even if you consider yourself an investor, you should think and act like a trader when it comes to the markets. He also continues to show his methodology in action with a new mystery chart, a mystery chart reveal and several...
READ MORE
MEMBERS ONLY
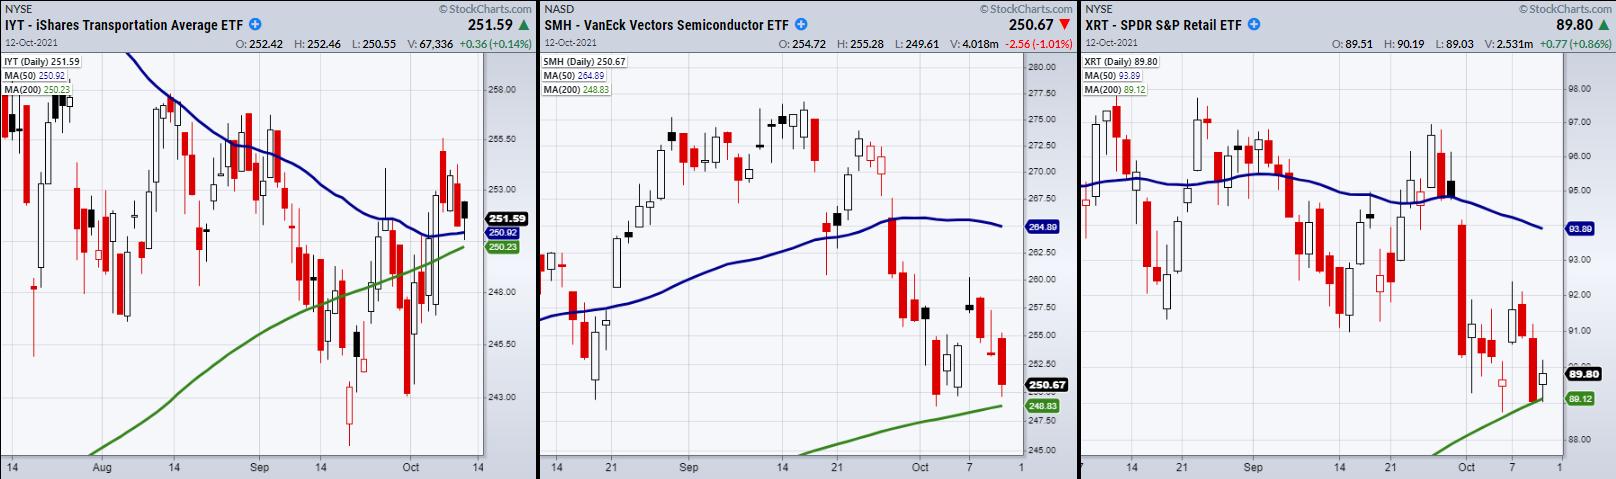
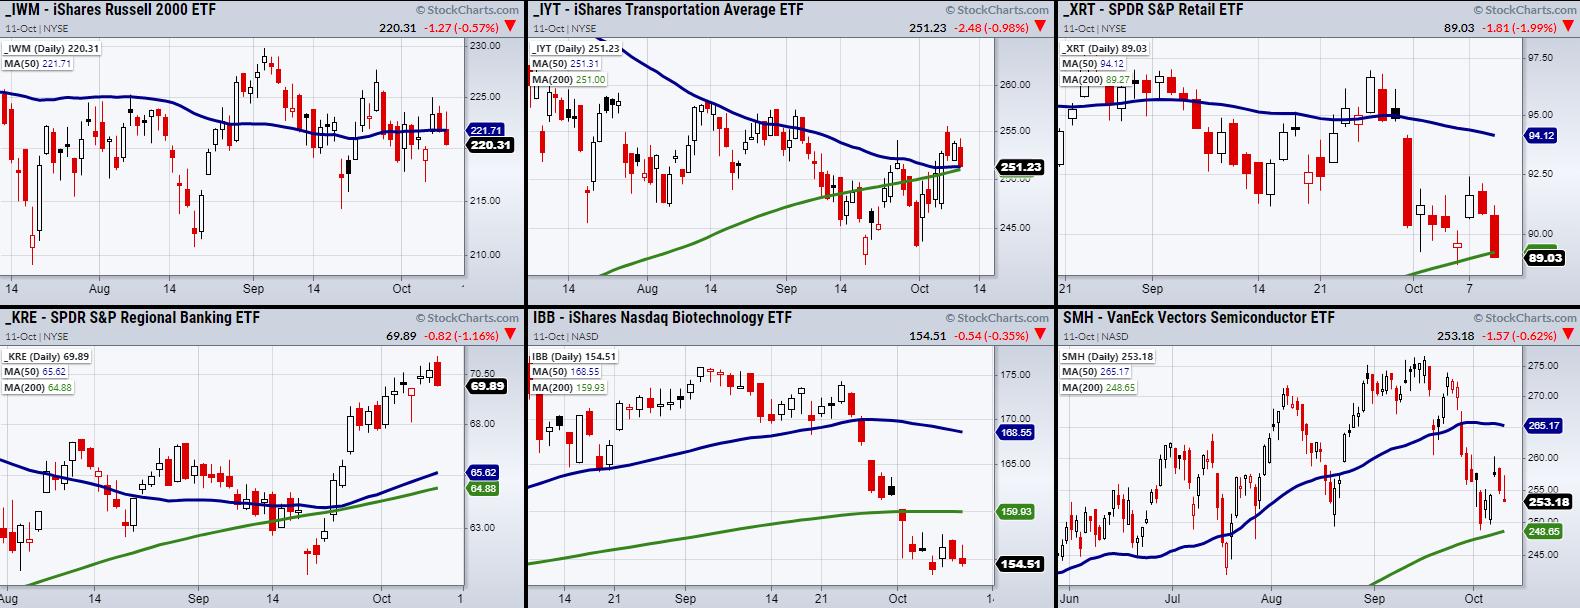
Key Sectors Hover Over Support While the Major Indices Flounder
On Monday, we talked about specific sectors weakening as they teetered on the edge of support from their major moving averages. The main three were Transportation (IYT), Retail (XRT) and Semiconductors (SMH). It just so happens that these sectors perfectly align with the holiday season as people begin to do...
READ MORE
MEMBERS ONLY
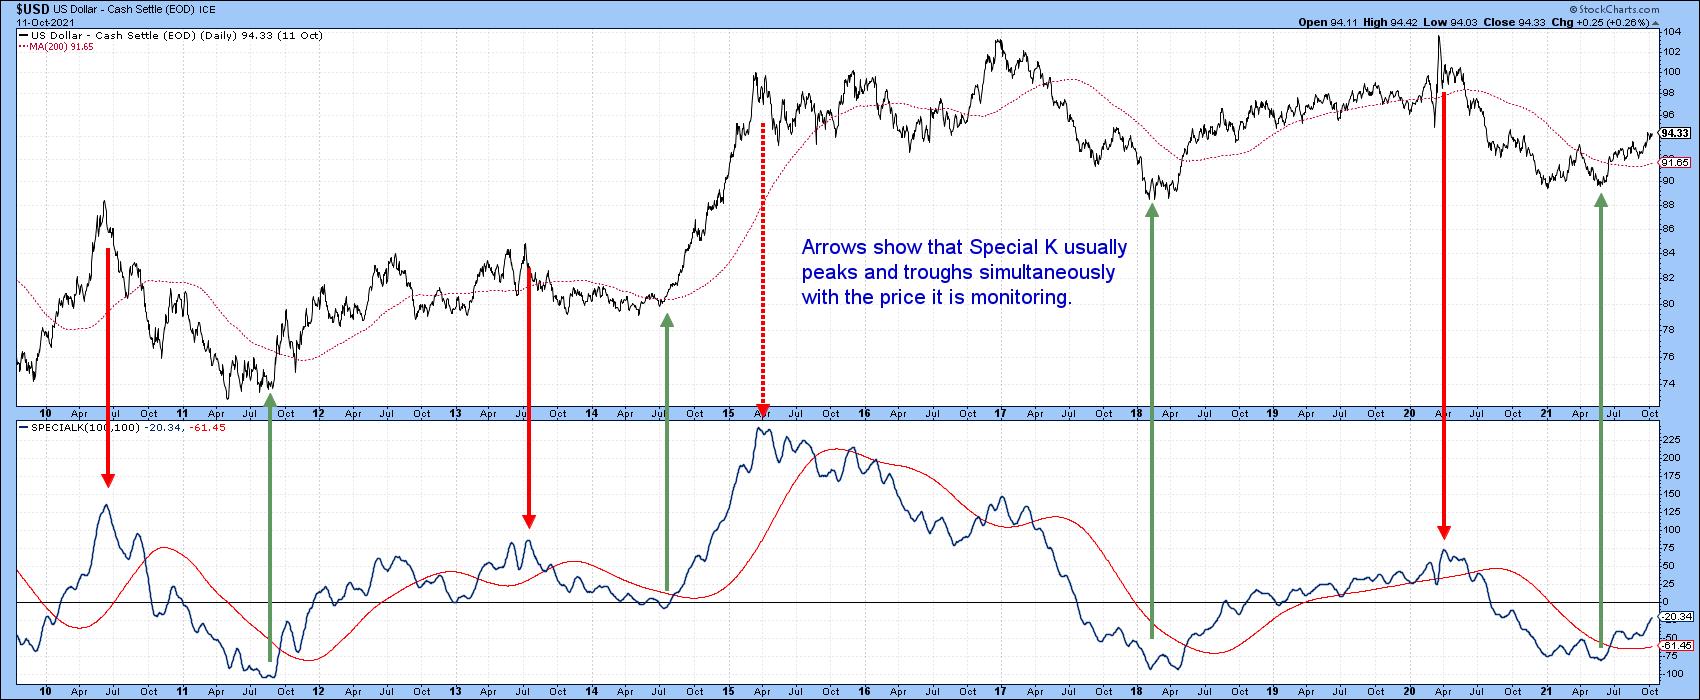
Using the Special K to Analyze the Dollar
by Martin Pring,
President, Pring Research
One of my favorite indicators is the Special K. It does not speak to us very often, but when it does, it's usually pretty reliable. I'll outline a few principles below, but for further reading, look hereandhere.
The Special K, or SPK, recognizes the fact that...
READ MORE
MEMBERS ONLY

Trick or Treat Comes to Wall Street

by Larry Williams,
Veteran Investor and Author
It's time for Halloween and Larry has some really nice treats for you in this new StockCharts TV special! One treat is in Gold and one is in the stock market itself, so grab your pens and get ready!
This video was originally broadcast on October 12, 2021....
READ MORE
MEMBERS ONLY

Sector Spotlight: 100th Episode Special with Tom Dorsey!

by Julius de Kempenaer,
Senior Technical Analyst, StockCharts.com
For the 100th edition of StockCharts TV's Sector Spotlight, I invite market veteran Tom Dorsey to join me for a chat and celebrate these past 100 episodes! We touch on how and when we had our ah-ha moments, or "epiphanies" as Tom refers to it, where...
READ MORE
MEMBERS ONLY

Max Pain: Market Makers' Monthly Miracle
by Tom Bowley,
Chief Market Strategist, EarningsBeats.com
I've seen it over and over and over again. Very short-term, almost inexplicable moves, seem to occur around the 3rd Friday of each month, which just so happens to represent monthly options expiration. When stock market traders, particularly options traders, all line up on one side of the...
READ MORE
MEMBERS ONLY
Is the Market Ready to Take Another Step Lower?
On Monday, the major indices attempted a reversal of Friday's price action but failed. This created another late-day selloff. Does this mean we should prepare ourselves for another move lower, or does the market have support to lean on through the coming week?
To get a quick but...
READ MORE
MEMBERS ONLY
Know What You Own - It Sounds Much Simpler Than It Is
by Tom Bowley,
Chief Market Strategist, EarningsBeats.com
There's an assumption that ETFs are well-diversified and that buying leading ETFs will be profitable. That may turn out to be true, but it may not. ETFs are no better than the stocks they own and they could be extremely risky depending on the weighting of their top...
READ MORE
MEMBERS ONLY

Week Ahead: NIFTY Stares at a Potentially Strong Week; RRG Charts Many Sectors Strongly Placed

by Milan Vaishnav,
Founder and Technical Analyst, EquityResearch.asia and ChartWizard.ae
In the previous weekly note, it was mentioned that the markets have formed a broad trading and consolidation range between 17950 on the higher side and 17400 on the lower side. It was also noted that, unless the NIFTY breaches the upper edge or violates the lower edge, the NIFTY...
READ MORE
MEMBERS ONLY
A Stealth Area of the Markets is Heating Up - Here Are Three Stocks That'll Benefit
by Mary Ellen McGonagle,
President, MEM Investment Research
The broader markets have been struggling amid inflation and interest rate fears that have collided with a global energy crisis. After peaking in price in early September, the S&P 500 has been in a downtrend that it's been struggling to reverse. Not all areas are seeing...
READ MORE
MEMBERS ONLY

Avoid These Areas of the Market!
by Mary Ellen McGonagle,
President, MEM Investment Research
This week on StockCharts TV'sThe MEM Edge, Mary Ellen reviews areas of the market that are in confirmed uptrends, with further upside ahead and what areas to stay away from. She also highlights what to be on the lookout for to confirm that the broader markets are safe....
READ MORE
MEMBERS ONLY
Are Investors Worried Over the Latest Jobs Report?
The recent jobs report came in less than expected, with analysts' estimates running anywhere from 250,000 to 500,000 new jobs created. Disappointingly, employers added only 194,000 jobs in September.
Although the numbers mean slower progress towards the 2-3% unemployment goal, will investors take a cautious note?...
READ MORE
MEMBERS ONLY
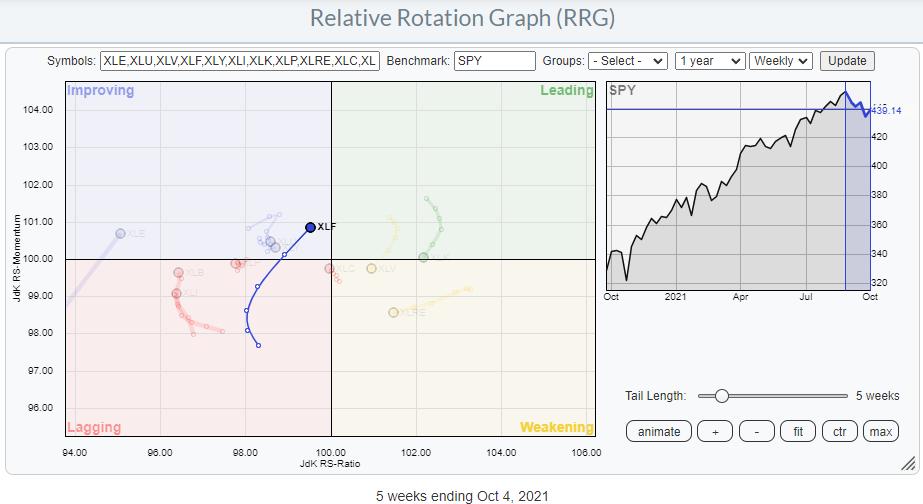
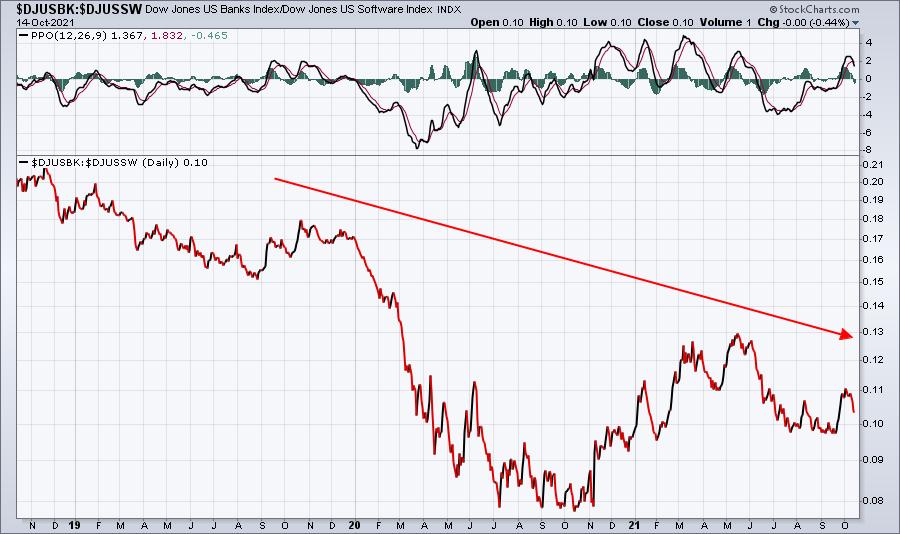
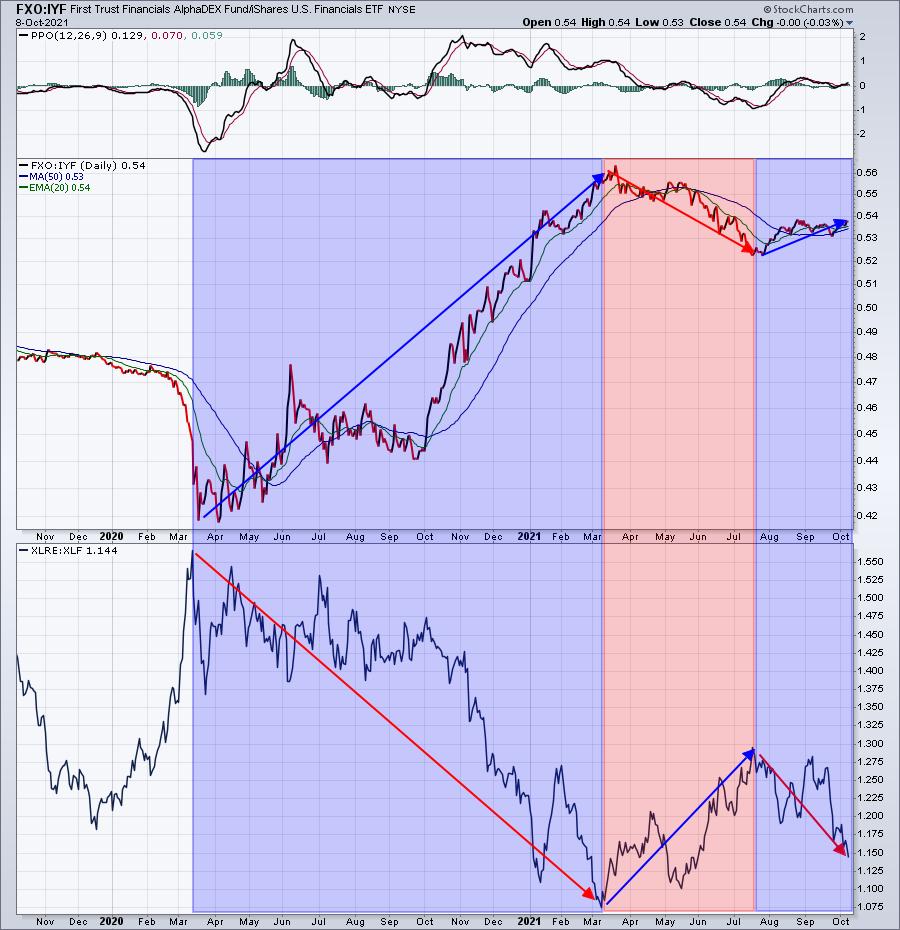
A Run on Banks
by Julius de Kempenaer,
Senior Technical Analyst, StockCharts.com
On the Relative Rotation Graph for sectors, the tail on XLF is showing one of the most promising rotations, being inside the improving sector and traveling at a strong RRG-Heading towards leading. Relative and price-technical arguments aside, I think there are two charts that support a further rotation towards and...
READ MORE
MEMBERS ONLY

ENERGY AND FINANCIALS CONTINUE TO LEAD -- S&P 500 REGAINS ITS 100-DAY AVERAGE
by John Murphy,
Chief Technical Analyst, StockCharts.com
ENERGY ETFS ACHIEVE BULLISH BREAKOUTS... Rising energy prices continue to fuel a rally in energy shares which are the day's strongest sector. Crude oil and natural gas are trading at the highest level in several years and show no signs of slowing down. That's contributing to...
READ MORE
MEMBERS ONLY
The Secret to Selecting the ETFs that are Right For You
by Tom Bowley,
Chief Market Strategist, EarningsBeats.com
I have two reasons for writing this article. First, I'm hosting a FREE webinar relating to ETF selection on Saturday morning that I'll discuss later. Second, I was having a market-related discussion with a good friend a few nights ago and he was explaining his investment...
READ MORE
MEMBERS ONLY
Chartwise Women: How to Invest with Confidence in Risky Times
by Mary Ellen McGonagle,
President, MEM Investment Research
by Erin Swenlin,
Vice President, DecisionPoint.com
On this week's edition of Chartwise Women, Mary Ellen and Erin share their advice on boosting your investment confidence.
This video was originally broadcast on October 7, 2021. Click on the image above to watch on our dedicated Chartwise Womenpage, orclick this linkto watch on YouTube. You can...
READ MORE
MEMBERS ONLY
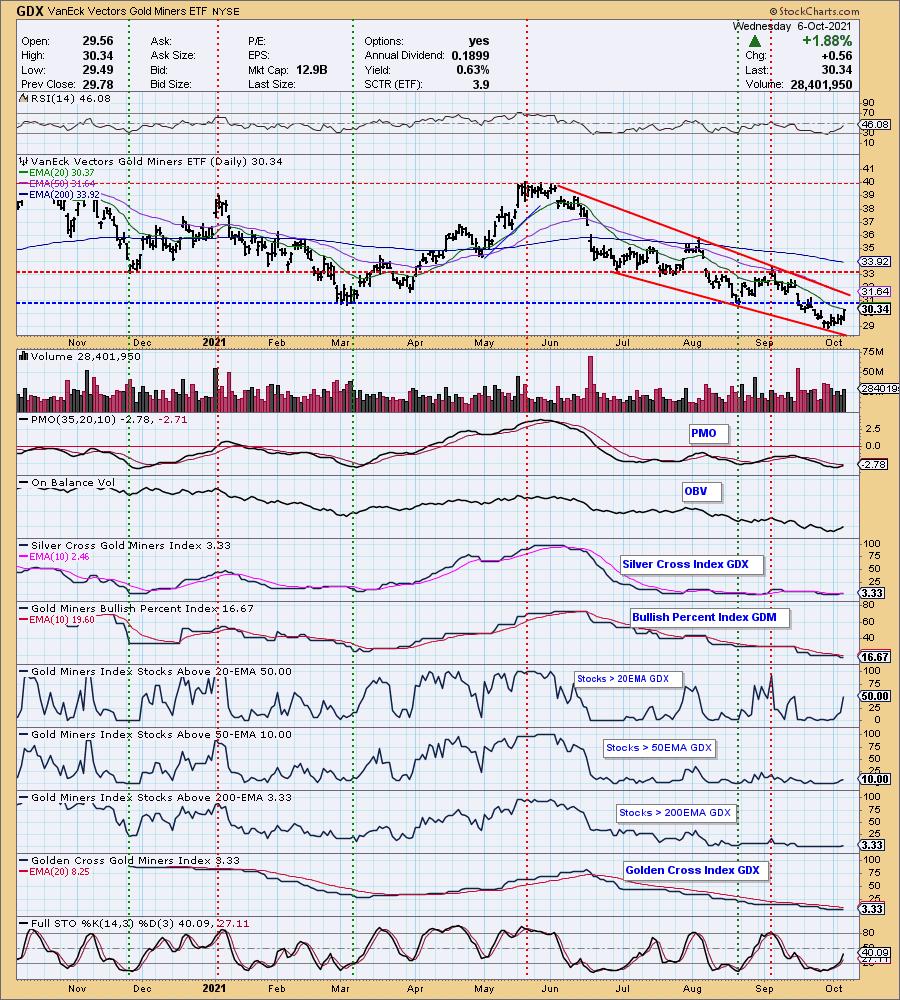
Gold Miners Have a Pulse - My Top Three Right Now
by Erin Swenlin,
Vice President, DecisionPoint.com
(This is a copy of last night's DecisionPoint Diamonds Report. I promised in today's Chartwise Women show that I would give some examples of how I set stops.)
One of the charts that I review every market day in the DP Alert is the Gold Miners...
READ MORE
MEMBERS ONLY
Important Zero Line MACD Signals You Can Use to Improve Timing
by Joe Rabil,
President, Rabil Stock Research
In this week's edition of Stock Talk with Joe Rabil, Joe explains several different MACD signals that can be used to improve timing during a pullback. He discusses Zero Line Reversals, Zero Line/Reverse Divergence, Zero Line Overrun vs. Zero Line Breaks, Counter Trend Lines, Momentum Divergence and...
READ MORE
MEMBERS ONLY
Has The September Swoon Ended? Well....
by Tom Bowley,
Chief Market Strategist, EarningsBeats.com
That's never an easy question to answer while you're in the midst of a downtrend. It's a whole lot easier to be a Monday Morning Quarterback and say it's over when you've returned to a new all-time high. That'...
READ MORE
MEMBERS ONLY
Simple Techniques to Stay on the Right Side of the Trend
by Dave Landry,
Founder, Sentive Trading, LLC
In this edition of Trading Simplified, Dave shows his methodology in action, with an emphasis on waiting for entries, sticking with positions even during adverse conditions (unless stopped out) and how, sometimes, you can just buy markets when they are going up. He then went on to discuss simple techniques...
READ MORE
MEMBERS ONLY

How to Predict Short-Term Price Direction With Two Special ETFs
On Tuesday, we talked about the 6-month calendar range as a support level to hold in both the S&P 500 (SPY) and the Nasdaq 100 (QQQ). On Wednesday, both indices were able to hold support from their calendar range lows around $427 (for the SPY) and $352 (for...
READ MORE
MEMBERS ONLY

NYFANG, The Index and ETF Nobody Talks About
by Julius de Kempenaer,
Senior Technical Analyst, StockCharts.com
In a recent conversation, somebody mentioned "New York Fang" to me. I was under the impression he was referring to the FANG stocks. Only later did I understand that he was talking about an ETF and an associated index which is a bit broader than "just"...
READ MORE
MEMBERS ONLY

STOCK INDEXES FALL BELOW 100-DAY AVERAGES -- FOUR SECTORS ARE TESTING THEIR 200-DAY LINES
by John Murphy,
Chief Technical Analyst, StockCharts.com
WATCHING 100-DAY AVERAGES...Stocks remain in a short- to intermediate term downturn that started during September. And moving average lines are being broken. It started with stock indexes falling below their 50-day moving averages. And then falling below their 100-day lines. Chart 1 shows the Dow Industrials trading below its...
READ MORE
MEMBERS ONLY
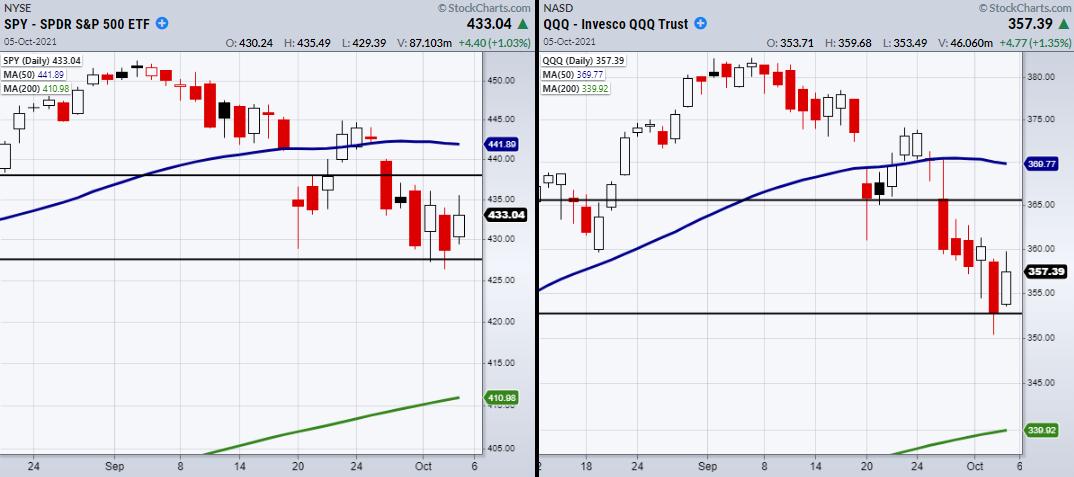
The S&P 500 and the Nasdaq 100 Bounce Off Their 6-Month Calendar Range
Calendar ranges have been used for a long time in charting as important levels to clear or break down from. Investors can view price as bullish when over the range and bearish when trading under. We like to use the 6-month calendar range, as it shows long-term support or resistance...
READ MORE
MEMBERS ONLY

This Sector is Likely to Outperform the NASDAQ in a Major Way
by Martin Pring,
President, Pring Research
Back in AprilandMay, I wrote about the possibility that the tech-dominated NASDAQ had begun to lose its mojo. The argument was based more on relative action than the absolute price, as I was, and still am, bullish on the primary trend.
Recent NASDAQ Underperformance is Likely to Extend
Chart 1...
READ MORE
MEMBERS ONLY
Sector Spotlight: Bearish Engulfing Candle for S&P
by Julius de Kempenaer,
Senior Technical Analyst, StockCharts.com
On this edition of StockCharts TV's Sector Spotlight, I start the month by evaluating the monthly charts for asset classes and sectors. Despite the weak ending of the month in September, three sectors managed to squeeze out a new all-time-high. However, none of them were able to hold...
READ MORE
MEMBERS ONLY

Which Commodities Are Countering the Market?
While the major indices continue to weaken, U.S factories have seen a 1.2% increase in orders in August. This shows that although equities are struggling, the demand for goods is steady. Therefore, now is the time to pay close attention to which spaces are holding up while the...
READ MORE
MEMBERS ONLY

DP TV: SPY Loses Its "Silver Cross" Buy Signal!
by Erin Swenlin,
Vice President, DecisionPoint.com
An eventful day of trading provides an excellent backdrop for this episode of DecisionPoint. Carl starts with an "inside baseball" look at the small-caps vs large-caps, explaining in charts the downward pressure the mega-cap stocks are having on the broad markets. He then reviews our indicators and identifies...
READ MORE
MEMBERS ONLY

2021 Q2 Earnings: Market Still Overvalued
by Carl Swenlin,
President and Founder, DecisionPoint.com
The following chart shows us the normal value range of the S&P 500 Index, indicating where the S&P 500 would have to be in order to have an overvalued P/E of 20 (red line), a fairly valued P/E of 15 (blue line), or an...
READ MORE
