MEMBERS ONLY

Can Key Sectors Along with Bitcoin Hold Nearby Support?
The Economic Modern Family now has 5 members sitting in a confirmed cautionary phase. A cautionary phase is defined by the 50-day moving average stacked over the 200-DMA, with the price between both moving averages.
As seen above, the only member holding a bullish trend with its price over the...
READ MORE
MEMBERS ONLY

The Importance of Being Patient

by Dave Landry,
Founder, Sentive Trading, LLC
In this edition of Trading Simplified, Dave continues his discussion on finding trading answers through asking the right questions, continuing to stress the importance of patience. He goes on to discuss that you should not put capital into harm's way by trading when conditions aren't conducive,...
READ MORE
MEMBERS ONLY

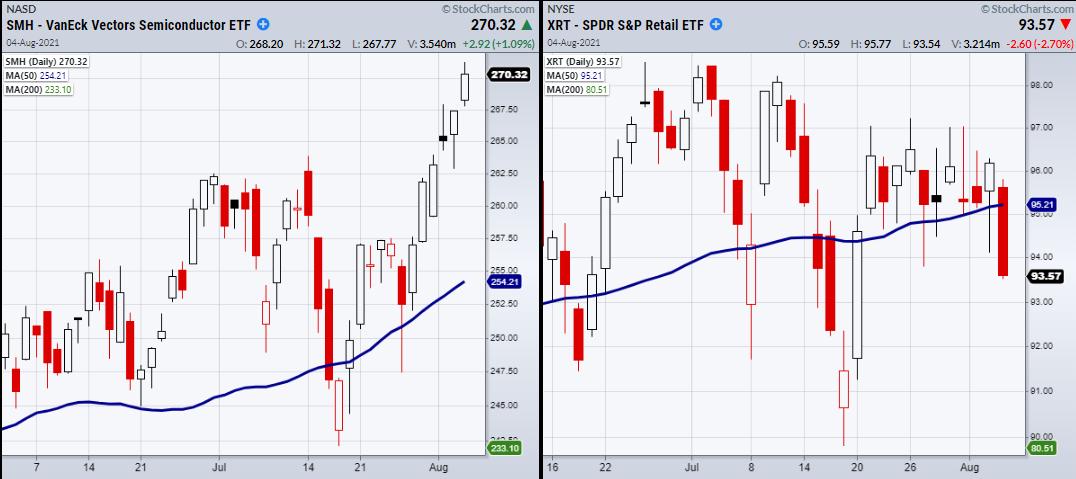
Will the Market Bounce After the Nasty Retail Earnings Report?
On Tuesday, the retail earnings report came out -0.8% lower than expected, amid recent highs in two of the major indices. This caused the market to gap lower following a continued selloff throughout the day. However, the market did not close at the lows of the day, which could...
READ MORE
MEMBERS ONLY

Sector Spotlight: Conflicting Sector Rotations

by Julius de Kempenaer,
Senior Technical Analyst, StockCharts.com
On this edition of StockCharts TV's Sector Spotlight, I look at last week's rotations for asset classes and sectors and conclude that the current sector rotation is throwing curve balls at investors making it difficult to come up with a very clear and well-defined trend or...
READ MORE
MEMBERS ONLY

Michigan Consumer Sentiment Drops 13.5% in July; What Does that Mean for US Equities?

by Martin Pring,
President, Pring Research
Last Friday, the University of Michigan released the initial August response to their consumer sentiment survey. A sharp 13.5% retreat was recorded. The Expectations Index fared even worse with a 17.5% drop. According to the summary report, only six of these monthly surveys since the late 1970s have...
READ MORE
MEMBERS ONLY

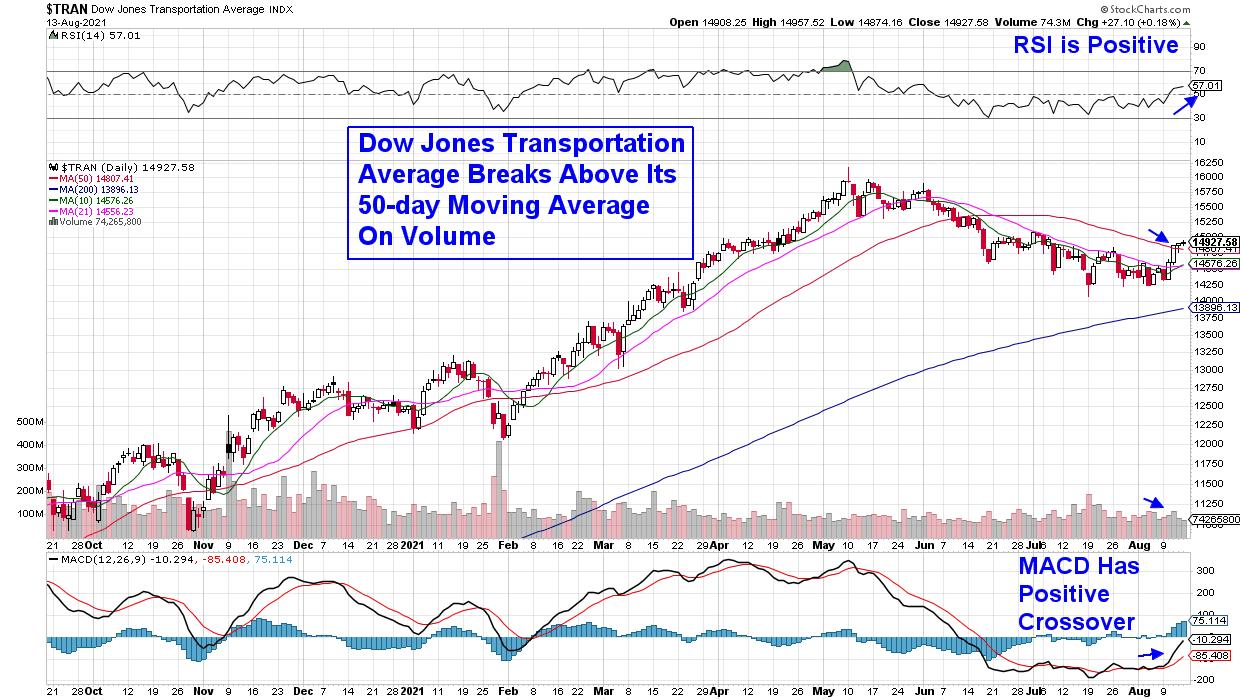
Which Symbols Hold the Key to the Next Market Run?
Since mid-May, the Transportation sector (IYT) has been trending lower. Currently, IYT sits just under resistance from its 50-day moving average at $257.97. Additionally, the small-cap index Russell 2000 (IWM) has traded sideways for over a month and continues to have trouble clearing its pivotal $225 resistance level. Because...
READ MORE
MEMBERS ONLY

DP TV: Strong Industry Groups Right Now

by Erin Swenlin,
Vice President, DecisionPoint.com

by Carl Swenlin,
President and Founder, DecisionPoint.com
In this episode of DecisionPoint, Carl and Erin turn the agenda upside down! Erin begins the show talking about three industry groups that have been showing new strength and a few stocks to review within those industry groups. Her "Diamond of the Week" takes advantage of momentum shifts...
READ MORE
MEMBERS ONLY
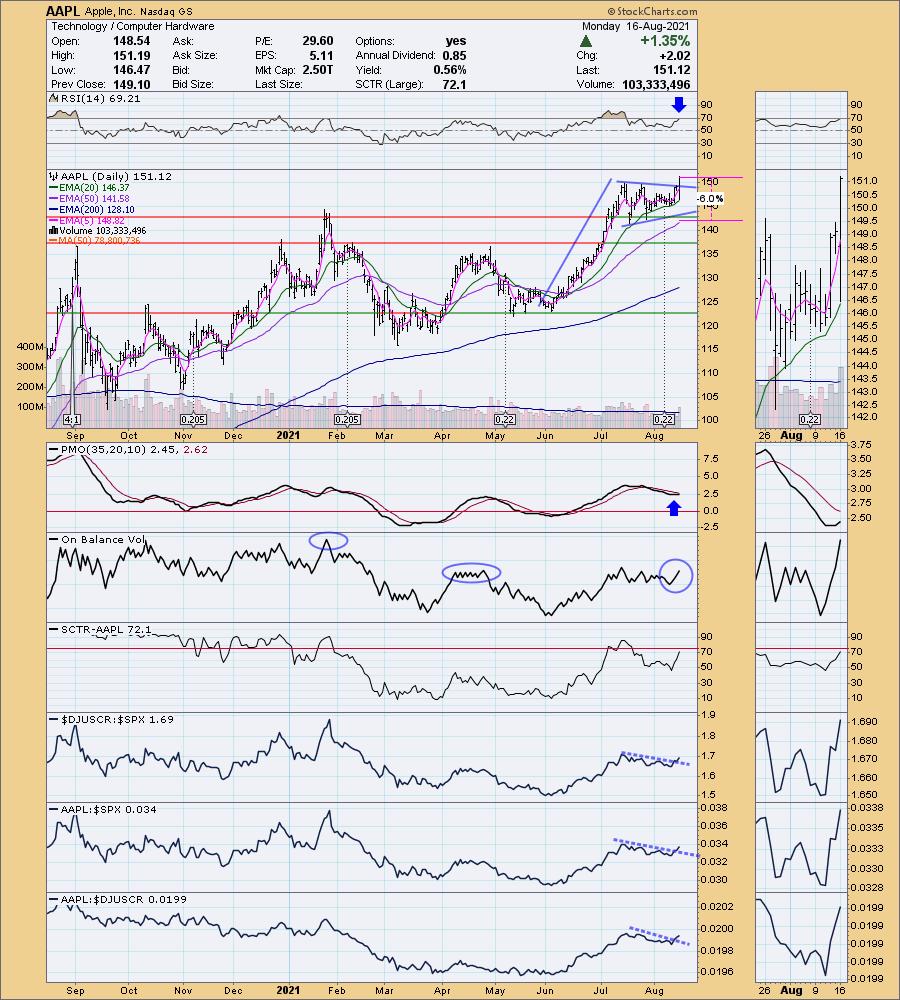
Is It Time to Sell Apple (AAPL)?
by Erin Swenlin,
Vice President, DecisionPoint.com
Today on the DecisionPoint Show Carl brought up the chart on Apple (AAPL) to discuss a recent comment from Jonathan Hoenig of the Capitalist Pig Hedge Fund on Fox Business news last week. At the time, he went out on a limb and said that he was shorting Apple. We...
READ MORE
MEMBERS ONLY
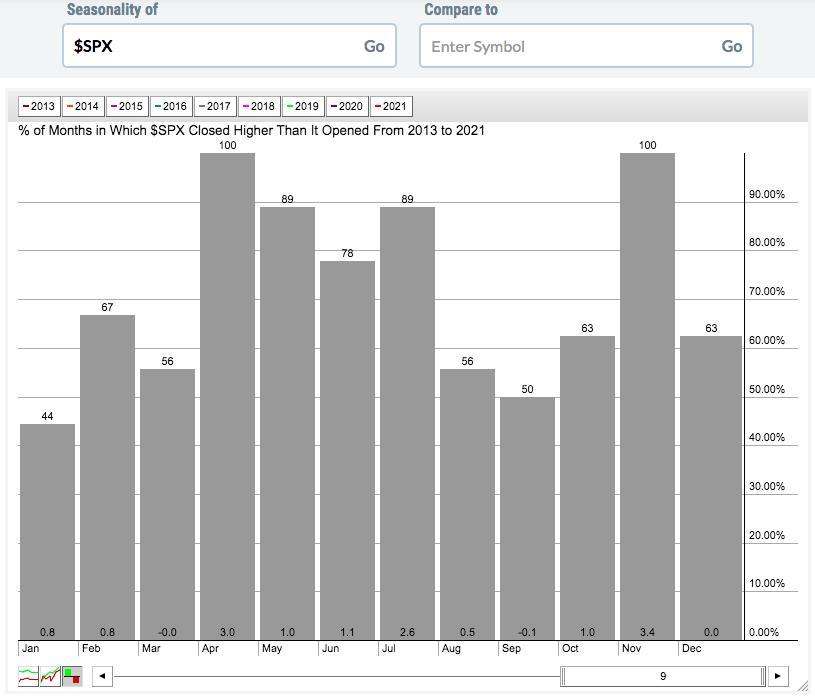
Should We Pay Attention To Bearish Seasonal Tendencies?

by Tom Bowley,
Chief Market Strategist, EarningsBeats.com
I've studied the major indices from a historical perspective for decades. I believe there are reasons why bullish and bearish tendencies develop over time and why such seasonality repeats itself. For instance, I've published articles here in this blog and in ChartWatchers discussing significant tendencies before,...
READ MORE
MEMBERS ONLY

Using RSI to Identify Trend Reversals - XOP Example with Short-term Bearish Setup

by Arthur Hill,
Chief Technical Strategist, TrendInvestorPro.com
RSI is a momentum oscillator that many chartists use to identify overbought and oversold levels. While RSI above 70 is typically considered an overbought condition, it is also a sign of strong upside momentum that can signal the start of an extended advance. Conversely, RSI below 30 is considered an...
READ MORE
MEMBERS ONLY
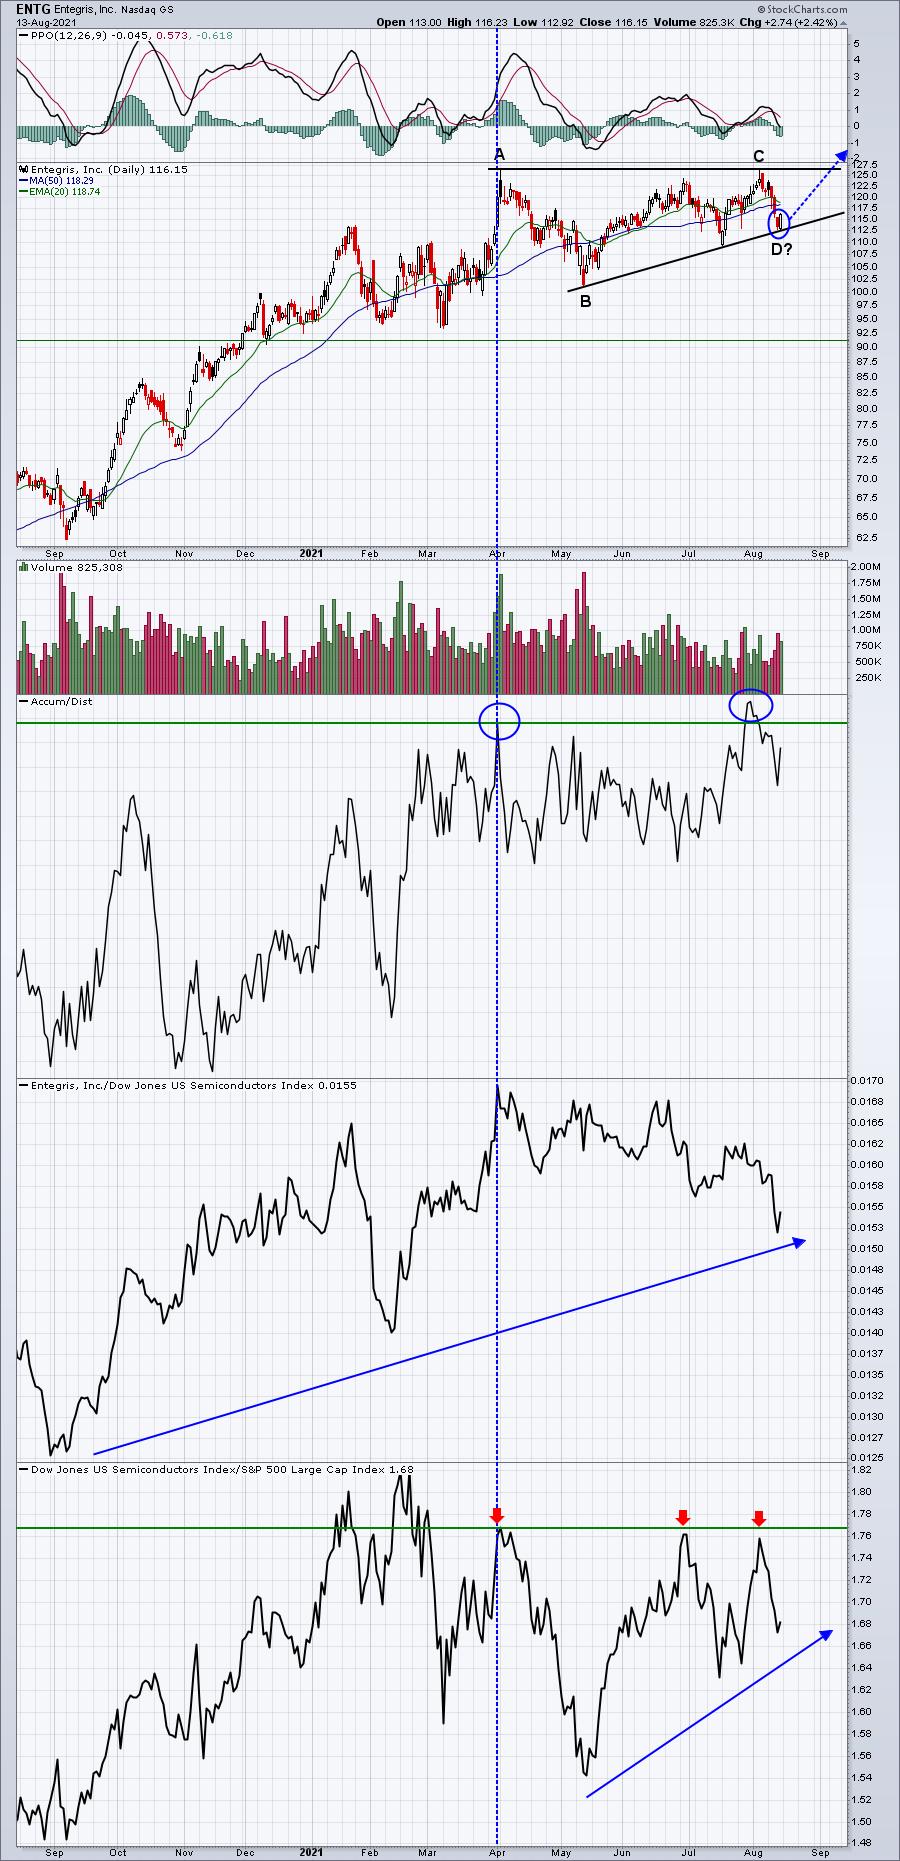
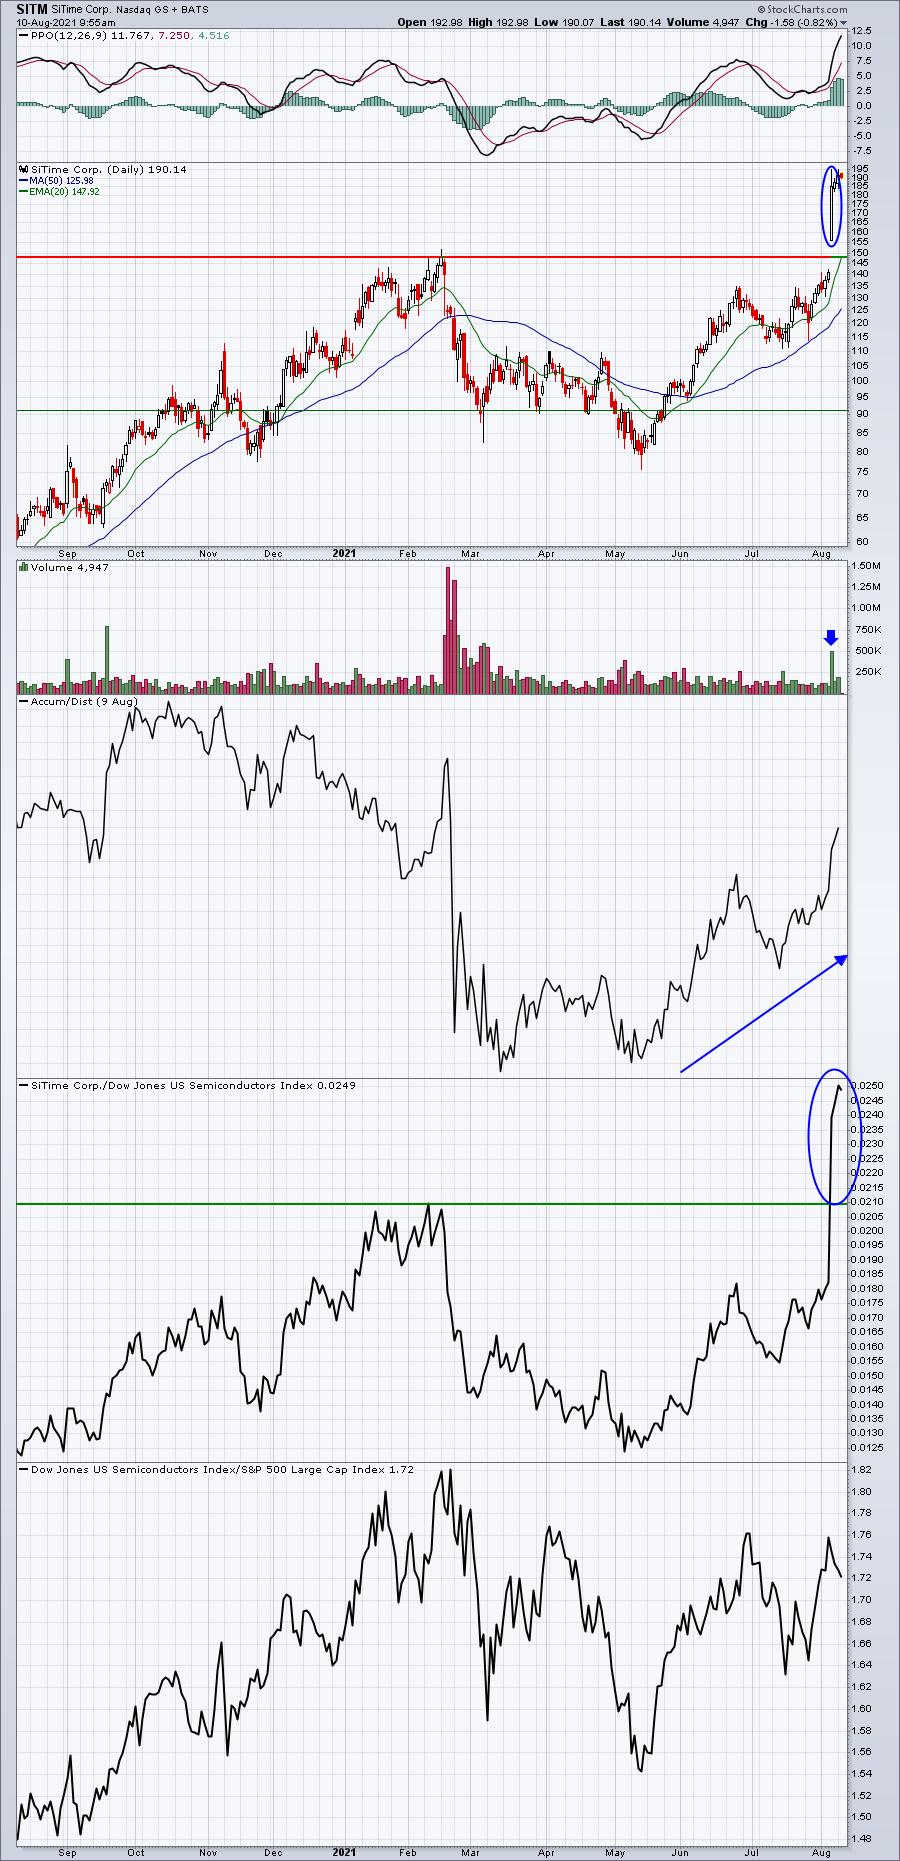
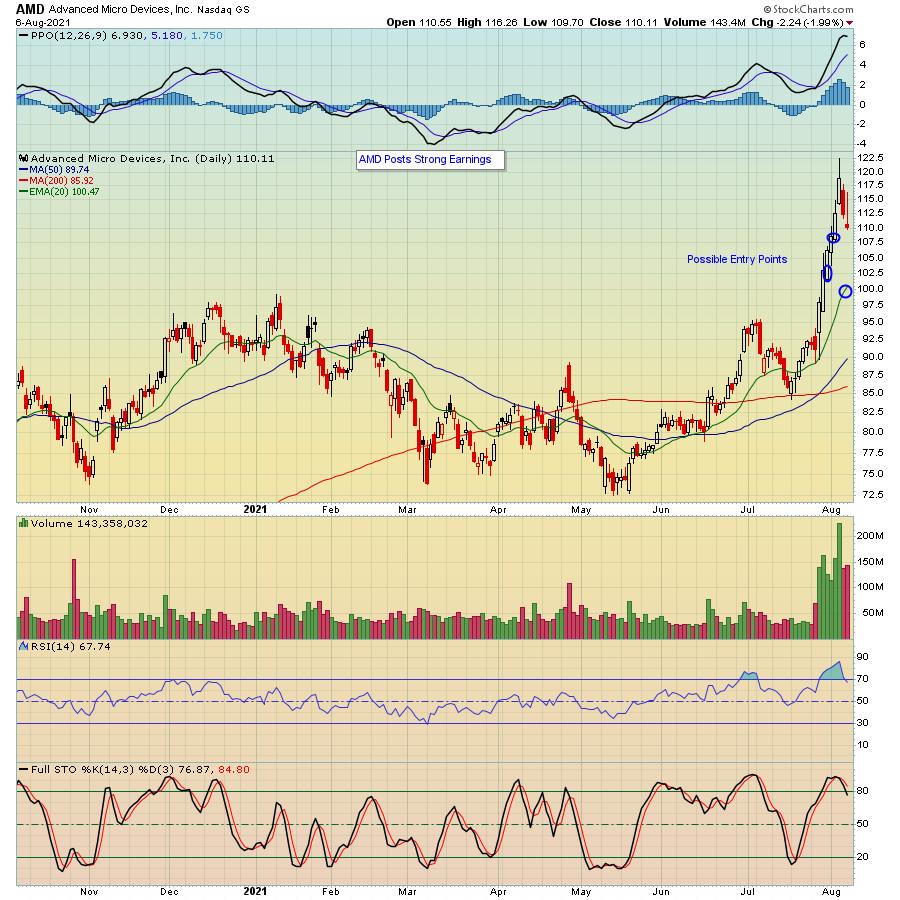
What Will Strong Results and an Ascending Triangle Get You?
by Tom Bowley,
Chief Market Strategist, EarningsBeats.com
It's not at all unusual for a company to see a huge uptrend followed by a lengthy consolidation period. Many traders with short-term time frames will grow increasingly impatient and sell long before they should. But properly-employed capital is vital to a trader, so it makes sense to...
READ MORE
MEMBERS ONLY

Week Ahead: NIFTY Edge Higher If Stays Above This Point; RRG Chart Hints At Leadership From These Sectors

by Milan Vaishnav,
Founder and Technical Analyst, EquityResearch.asia and ChartWizard.ae
In the early weekly note, it was mentioned that the following eight weeks of consolidation, the NIFTY has finally staged a breakout while dragging its support levels considerably higher. Over the past five days, the NIFTY extended its gains while it closed at yet another lifetime high levels. The trading...
READ MORE
MEMBERS ONLY
A New Uptrend Just Posted In This Major Market Index - Here Are Candidates Poised To Benefit

by Mary Ellen McGonagle,
President, MEM Investment Research
The broader markets are at a very positive juncture as recently leading areas are holding their gains while newer areas are coming into their own after reversing their downtrends.
Last week, my MEM Edge Report highlighted the new uptrend in Financials while recommending several Bank stocks which outperformed last week...
READ MORE
MEMBERS ONLY
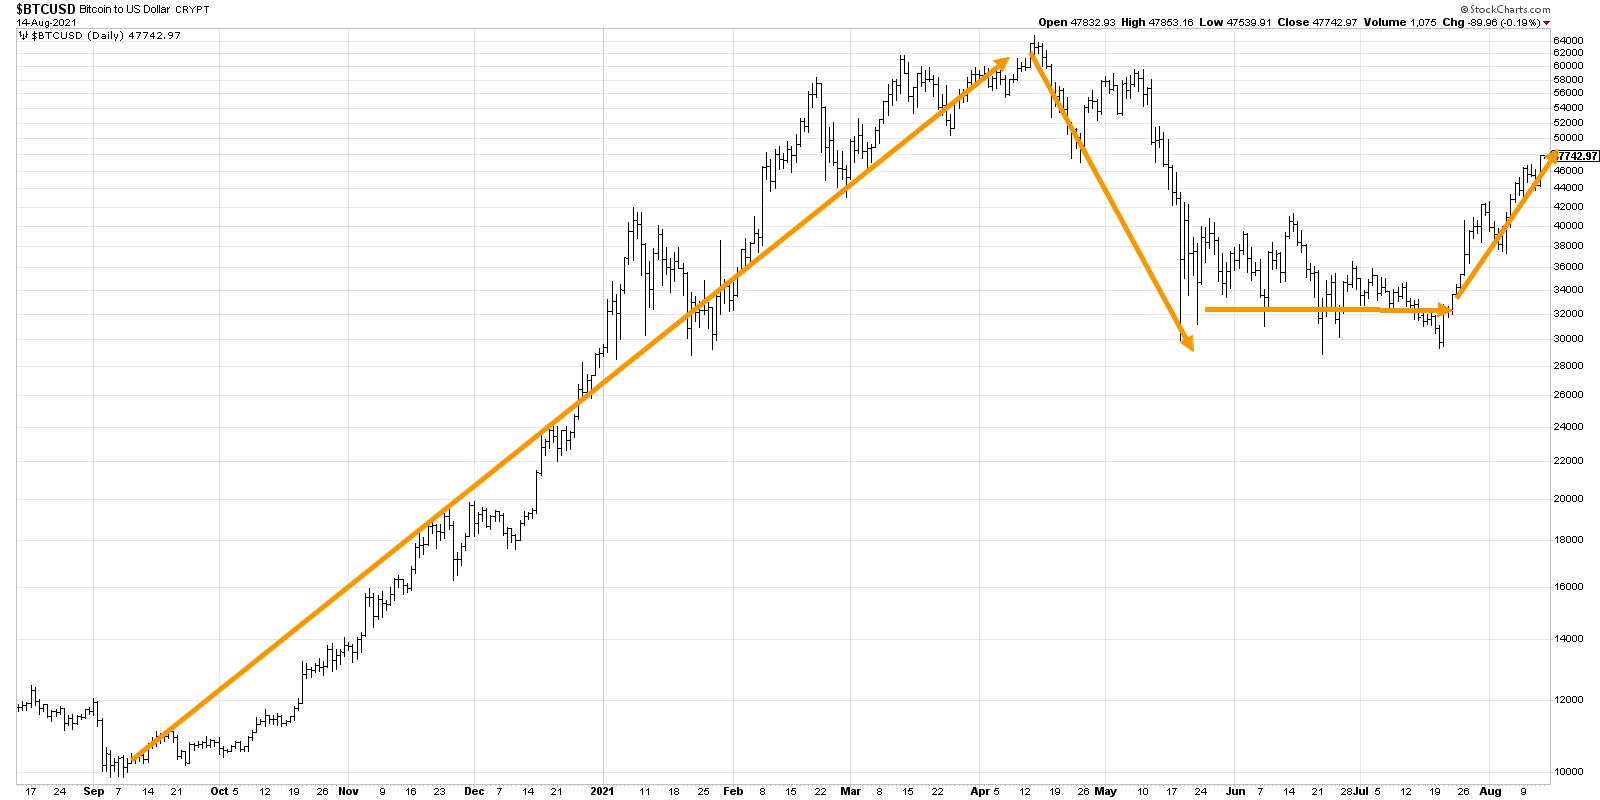
Why Is Bitcoin 42,000 So Important?

by David Keller,
President and Chief Strategist, Sierra Alpha Research
I recently recorded a "Choose Your Own Adventure" style approach to Bitcoin. I laid out four different scenarios for this crypto, from the uber-bullish move to 65,000 to the ultra-bearish scenario down to 24,000.
If you're interested, you can see the original video here...
READ MORE
MEMBERS ONLY
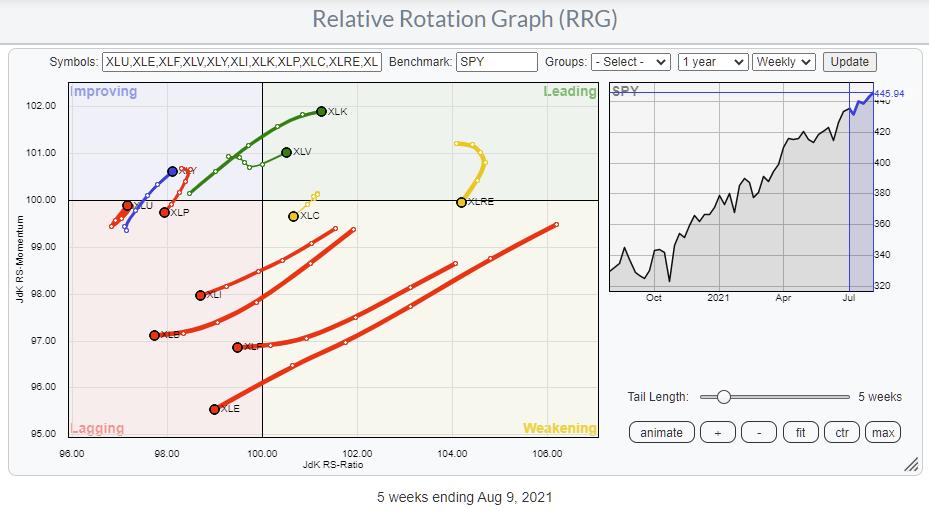
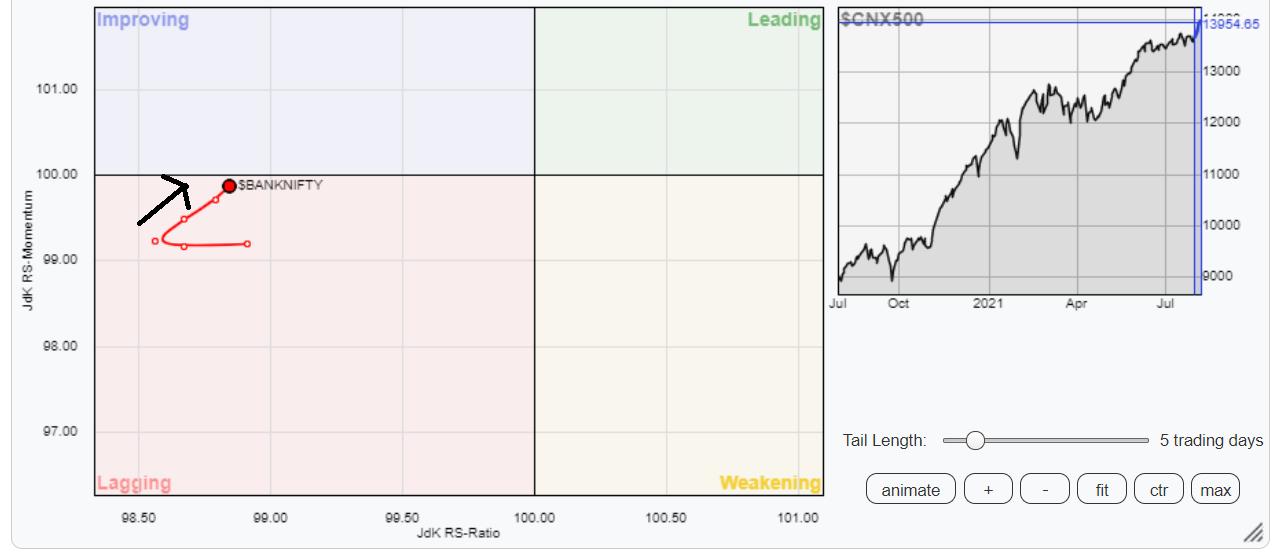
From Sectors to Groups to Stocks to Find One Name That Dominates
by Julius de Kempenaer,
Senior Technical Analyst, StockCharts.com
Relative Rotation Graphs are a great tool to use for a top-down approach. Lots of people look at sectors and trade the sector ETFs. The State Street sector SPDRs range (XLK, XLY, XLP, etc.) is probably the most popular family of ETFs for that purpose. The RRG above shows the...
READ MORE
MEMBERS ONLY

Catch the Move Into This Major Index
by Mary Ellen McGonagle,
President, MEM Investment Research
This week on StockCharts TV'sThe MEM Edge, Mary Ellen shares the reversal of a prominent index that's poised to trade higher after strong earnings from underlying stocks. She also reviews the move into higher yielders as inflation remains elevated.
This video was originally recorded on August...
READ MORE
MEMBERS ONLY

Could Long-Term Bonds (TLT) Help Form a Worrisome Market Trend?
Recently, we talked about the ongoing battle between the Regional Banking Sector (KRE) and the 20+ Year Treasury Bonds ETF (TLT). Each has its 50-day moving average nearby and is looking to use them as potential support. Currently, the 50-DMA is at $145.97 for TLT and $65.09 for...
READ MORE
MEMBERS ONLY
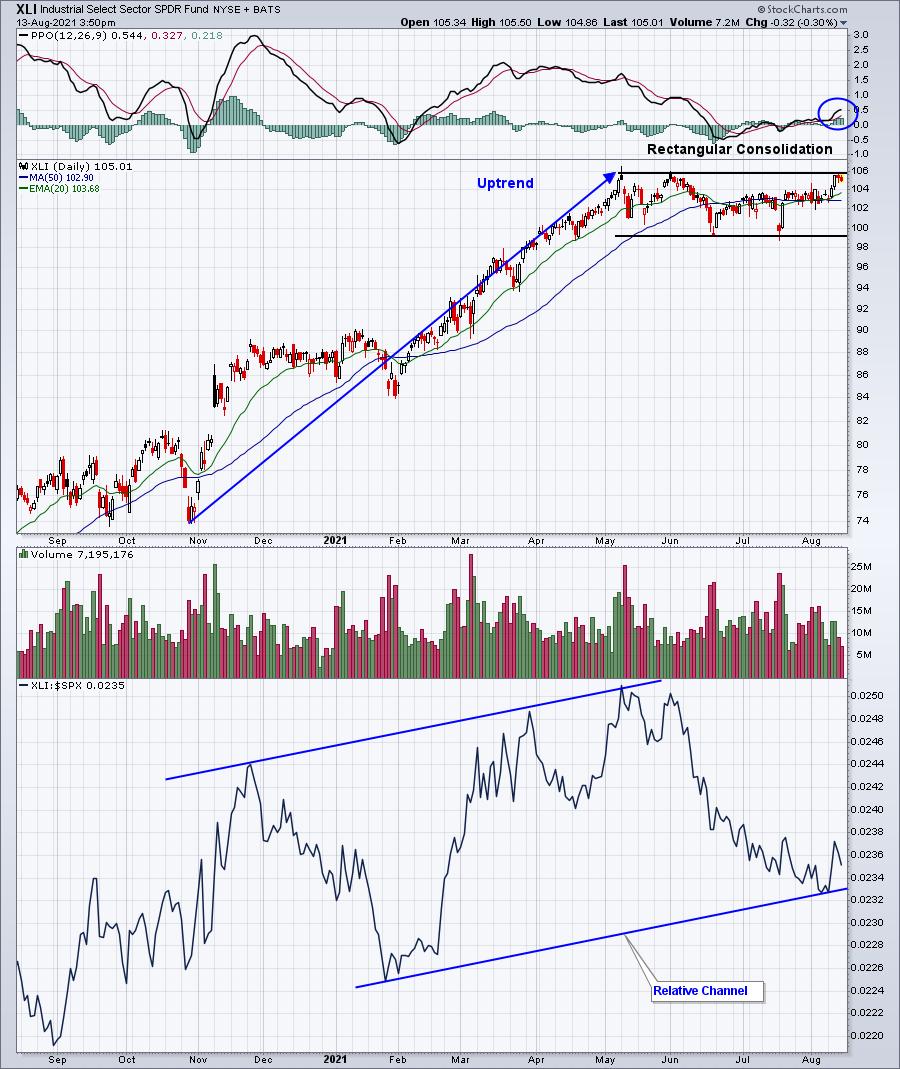
Rotation and Seasonality Point To This Sector As Our Next Leader
by Tom Bowley,
Chief Market Strategist, EarningsBeats.com
Rotation is nothing new during secular bull markets; it's actually what drives bull markets. Rather than money leaving the stock market for another asset class when leading sectors sell off, it simply moves from one sector to another sector. Financials (XLF) recently caught fire as treasury yields rebounded....
READ MORE
MEMBERS ONLY

Key Price Patterns

by Joe Rabil,
President, Rabil Stock Research
In this week's edition of Stock Talk with Joe Rabil, Joe explains how he combines the strategies discussed in recent shows on MACD and ADX with a specific price pattern. He gives the criteria for the price setup and a recent example. Afterwards, he goes through the viewer...
READ MORE
MEMBERS ONLY

Sector Rotation to Discretionary Only in Large Cap Segment, Small Caps Lagging
by Julius de Kempenaer,
Senior Technical Analyst, StockCharts.com
For a few weeks already I am monitoring the rotation between large-, mid-, and small-cap segments.
On the various Relative Rotation Graphs, the deterioration for Small-Caps and, to a lesser degree, Mid-Caps vs Large-Caps is clearly visible.
Over the last 13 weeks, Large Caps have pushed into the leading quadrant...
READ MORE
MEMBERS ONLY

Can the Regional Banking Sector (KRE) Hold its 50-DMA?
From June to late July, Regional Banking ETF (KRE) has been stuck within a downward trend. Coming close to its 200-day moving average, it was able to find some support and, from there, consolidated over the major moving average. With that said, on August 6th, KRE gapped higher and closed...
READ MORE
MEMBERS ONLY
Finding Trading Answers
by Dave Landry,
Founder, Sentive Trading, LLC
In this edition of Trading Simplified, Dave continues the "Finding Trading Answers" series, which is important for how you think about and see the markets. He explains how to find the right mindset to make your trades successful because if you want the right answers, you need to...
READ MORE
MEMBERS ONLY
Sector Spotlight: Watching Healthcare for Defense
by Julius de Kempenaer,
Senior Technical Analyst, StockCharts.com
On this edition of StockCharts TV's Sector Spotlight, I spend the entire show on talking you through the current rotations for Asset Classes and Sectors and how they interact with longer term trends and price charts. Caution remains for the S&P 500, while the Healthcare sector...
READ MORE
MEMBERS ONLY

Why You Need to Watch These 5 Key Sectors and Major Index
One of the best ways to get a quick snapshot of the market is by using Mish's Economic Modern Family. These 5 sectors and 1 index can help guide us through the overall market, as well as reveal potential weak spaces to be cautious of.
Tuesday has seen...
READ MORE
MEMBERS ONLY

Which of These Three Leading Commodity Indicators are Forecasting Higher Prices?
by Martin Pring,
President, Pring Research
We hear a lot about inflation these days and have certainly experienced rising grocery bills, as well as runaway used car and housing prices. Commodity prices are often, but certainly not always, a leading indicator for the CPI, but there are three markets that have a useful, though imperfect, record...
READ MORE
MEMBERS ONLY
Deciphering This Earnings Season - Winners and Losers
by Tom Bowley,
Chief Market Strategist, EarningsBeats.com
I can't help it. I love analyzing quarterly earnings reactions and how the entire stock market is being impacted. So, as of Friday, August 6th, we have an Excel spreadsheet at EarningsBeats.com that incorporates nearly 1700 lines of earnings data that includes:
* Quarterly earnings, both actual and...
READ MORE
MEMBERS ONLY
DP TV: Stealth Correction!
by Erin Swenlin,
Vice President, DecisionPoint.com
by Carl Swenlin,
President and Founder, DecisionPoint.com
In this episode of DecisionPoint, Carl returns to the show and brings an interesting concept to share. Carl examines DP indicators and how they are confirming a stealth correction, as suggested by David Keller. To prove his point, he reviews stocks within the Dow 30 that did not have their...
READ MORE
MEMBERS ONLY

What to Watch if Bitcoin Confirms a Phase Change Over the 200-DMA
On Monday, Bitcoin cleared its major moving average, while Ethereum, the second-largest-cap currency, tested its new support level at $2900. For the moment, this shows the crypto space can hold its weekend progress. Often, the weekend can be pivotal for cryptocurrencies, since they are given more attention when the stock...
READ MORE
MEMBERS ONLY

Week Ahead: NIFTY Likely To Positively Consolidate; These Sectors Are Likely To Put Up Resilient Show
by Milan Vaishnav,
Founder and Technical Analyst, EquityResearch.asia and ChartWizard.ae
After eight weeks of consolidation, the Indian markets gave yet another break out as it surged above the crucial 15900-15950 zone. The past four out of five saw the markets inching relentlessly higher as it not only demonstrated renewed strength but also made the present breakout sustainable. The markets saw...
READ MORE
MEMBERS ONLY
This New Sector Turned Bullish
by Mary Ellen McGonagle,
President, MEM Investment Research
This week on StockCharts TV'sThe MEM Edge, Mary Ellen reviews the bullish reversal in one of the largest sectors as the markets hit another new high. She also shares breakouts on earnings and how to use precedent to trade them from here.
This video was originally recorded on...
READ MORE
MEMBERS ONLY
How to Profit from a Great Earnings Season

by John Hopkins,
President and Co-founder, EarningsBeats.com
Q2 Earnings season is winding down and, based on the record highs on all of the major indexes this past week, traders liked what they heard and saw.
The solid earnings beats by many companies comes as no surprise, with interest rates remaining low while the Fed continues its bullish...
READ MORE
MEMBERS ONLY
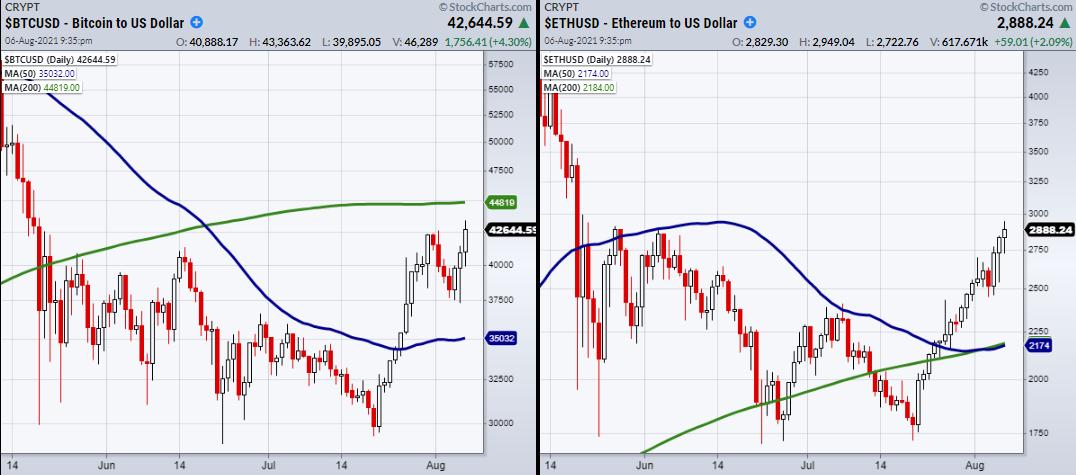
Crypto Companies to Trade Now That Bitcoin Is Looking to Clear Resistance
Two of the major cryptocurrencies, including Ethereum ($ETH) and Bitcoin ($BTC), are looking to clear and hold over resistance; Bitcoin at $40–42k and Ethereum at $2900. Their next test is to hold at or over these price levels through the weekend. If they do, we could see not only...
READ MORE
MEMBERS ONLY
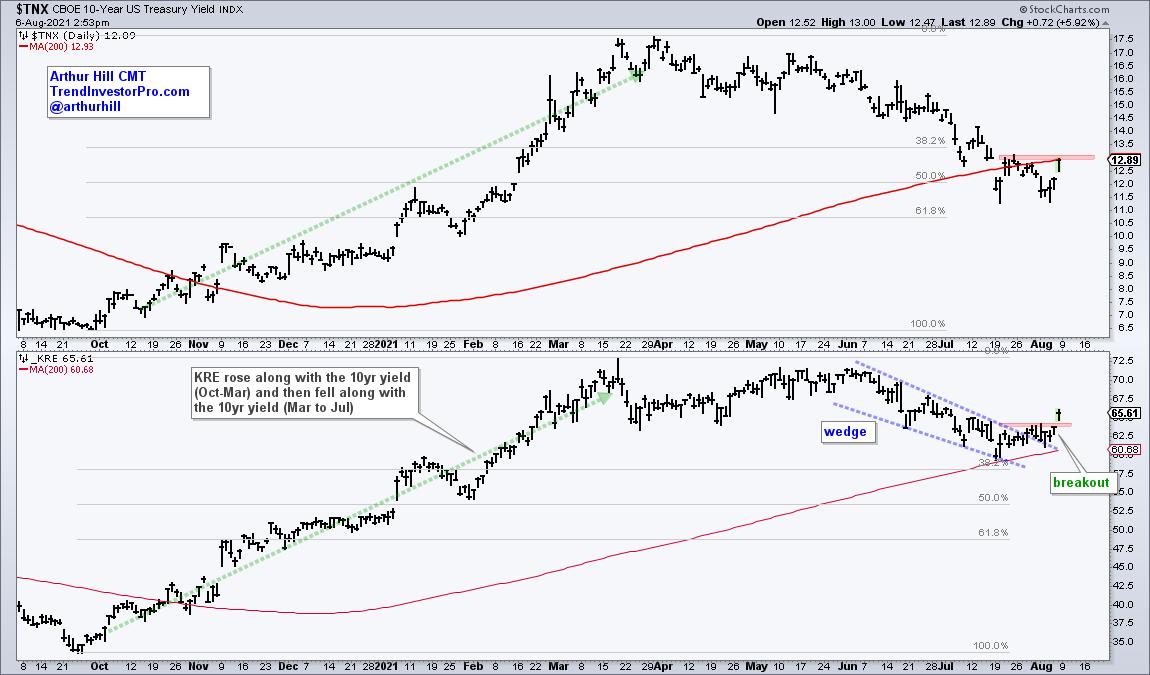
Regional Banks Take Their Cue from the 10-Year Yield
by Arthur Hill,
Chief Technical Strategist, TrendInvestorPro.com
The Regional Bank ETF (KRE) and the 10-yr Treasury Yield are positively correlated and the recent surge in the 10-yr yield led to a breakout in the Regional Bank ETF. More importantly, this breakout signals an end to a corrective period and a resumption of the bigger uptrend. As noted...
READ MORE
MEMBERS ONLY

BOND YIELDS BOUNCE ON STRONG JOBS REPORT -- FINANCIALS ARE HAVING A VERY STRONG DAY -- SO ARE BANKS

by John Murphy,
Chief Technical Analyst, StockCharts.com
10-YEAR TREASURY YIELD REBOUNDS... A strong July jobs report is helping boost bond yields today. Chart 1 shows the 10-Year Treasury yield bouncing 7 basis points to 1.29% on the day. A small double bottom on the daily bars suggests that a bottom may be forming. The TNX is...
READ MORE
MEMBERS ONLY
Is This Key Index Likely To Play A Catch-Up?
by Milan Vaishnav,
Founder and Technical Analyst, EquityResearch.asia and ChartWizard.ae
The frontline NIFTY50 Index staged a strong breakout following eight weeks of strong consolidation. It has marked a fresh lifetime high and presently trades in uncharted territory.
For a bull run to sustain in a meaningful way, there has to be broad-based participation; especially from key sectors like banks and...
READ MORE
MEMBERS ONLY
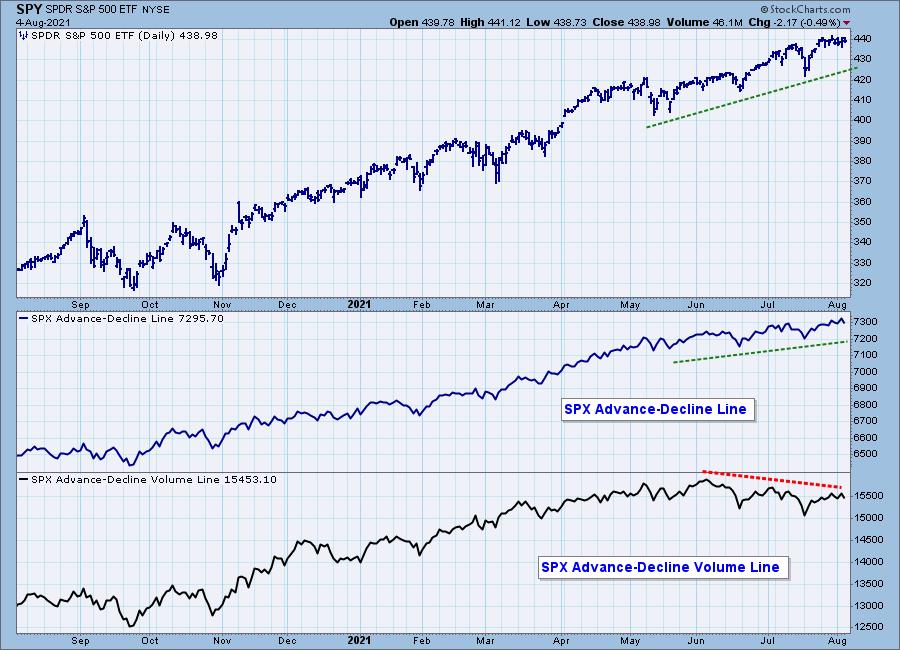
Better Breadth Indicators
by Carl Swenlin,
President and Founder, DecisionPoint.com
The other day, I was looking at the S&P 500 version of the Advance-Decline (A-D) Line, which tracks the cumulative daily advances minus declines for the SPX components. We can see that it has been confirming the market's advance for months, with a steady stream of...
READ MORE
MEMBERS ONLY

Chartwise Women: Lessons from the Pros
by Mary Ellen McGonagle,
President, MEM Investment Research
by Erin Swenlin,
Vice President, DecisionPoint.com
In this week's edition of Chartwise Women, Mary Ellen and Erin share recent presentations where they review how to pinpoint your entry point when a stock pulls back. They also share powerful yet simple technical indicators that can guide your trading.
This video was originally broadcast on August...
READ MORE
MEMBERS ONLY
Combining ADX and MACD
by Joe Rabil,
President, Rabil Stock Research
In this week's edition of Stock Talk with Joe Rabil, Joe follows up his past lessons on ADX and MACD to show how he uses these two indicators together. He explains the difference in the calculations and their implications. Joe then shows which indicators he uses to answer...
READ MORE
MEMBERS ONLY
Why These 3 Sectors Are Leading the Market Trend
In the past couple of weeks, the market has shown to have higher volatility paired with scattered daily price action. With the recent discovery of yet another COVID-19 variant (lambda) and with the spread of the highly contagious delta variant, we could be seeing the market begin to rotate into...
READ MORE
MEMBERS ONLY
Are You Asking the Right Questions?
by Dave Landry,
Founder, Sentive Trading, LLC
If you want answers to your trading questions, then you must make sure that you are asking the right questions. In this edition of Trading Simplified, Dave kicks off a new series on asking the right questions to become a successful trader and how to find those answers. Dave also...
READ MORE
