MEMBERS ONLY

Sector Spotlight: Monthly Trends Intact

by Julius de Kempenaer,
Senior Technical Analyst, StockCharts.com
On this edition of StockCharts TV's Sector Spotlight, I go over the completed monthly charts for July, highlighting the major trends and pointing out the areas of support and resistance to watch. Before the break, I give a quick overview of last week's rotations for sectors...
READ MORE
MEMBERS ONLY
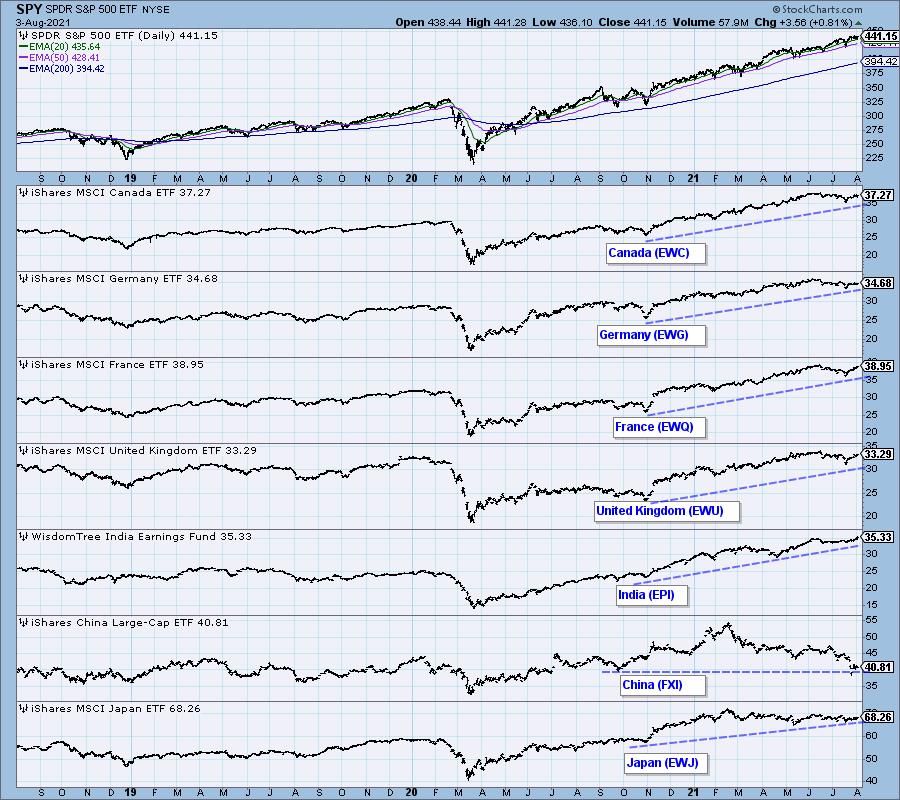
The Decimation of China's Market

by Erin Swenlin,
Vice President, DecisionPoint.com
China has been in the news often as many of the Chinese companies are experiencing a crack down by the government on the "private" sector. We, of course know that there really isn't a "private" sector in China as the government controls all. This...
READ MORE
MEMBERS ONLY

The Indicators are Mixed. What Does this Contradiction Mean for the Market?

by Martin Pring,
President, Pring Research
This morning, an interesting chart of the S&P Composite authored by Ed Clissold of NDR Research crossed my desk. It can be seen at @NDR_Research. It is a composite of 3 historic cycles: 1-year, 4-year (post-election) and 10-year decennial cycle with an average of years ending in...
READ MORE
MEMBERS ONLY
How to Properly Manage Risk in a Choppy Market Environment
For the past week, the major indices have been very choppy. Without clear direction in the indices, volatility has increased making price swings faster and, thus, tougher to time. However, times like this prove how important risk management is and, if done correctly, can help preserve trader's capital....
READ MORE
MEMBERS ONLY

In Healthcare, Focus on Supplies and Equipment; Avoid Providers
by Julius de Kempenaer,
Senior Technical Analyst, StockCharts.com
After slowly rolling over while inside the improving quadrant, the tail on XLV (Health Care) picked up again at the start of this week and is now moving into the leading quadrant.
This move follows the recent rotation on the daily RRG, which started out in the leading quadrant, rolled...
READ MORE
MEMBERS ONLY

DP TV: Trading Room Gems
by Erin Swenlin,
Vice President, DecisionPoint.com
In this episode of DecisionPoint, Erin, flying solo, gives her unique insight into current market conditions and indicators. Short-term, the SPY is suspect. See why! She then brings in three stocks from the free DecisionPoint Trading Room (sign up on the decisionpoint.com homepage) that she believes are "Diamond&...
READ MORE
MEMBERS ONLY

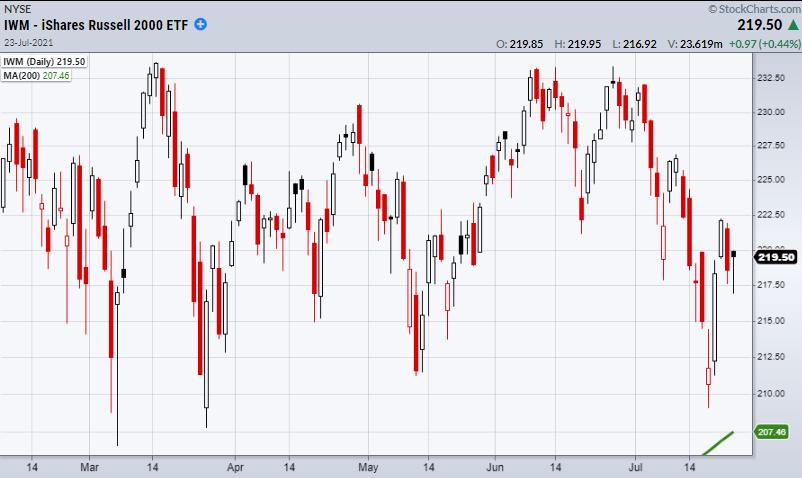
When the Market Trades Sideways, This Sector Pushes to New Highs
The small-cap Russell 2000 index (IWM) cannot make up its mind.
For the past three trading days, IWM has not been able to clear a pivotal resistance area created from the 50-day moving average at $225. Other key sectors, including Transportation (IYT) and Retail (XRT), have also been under pressure...
READ MORE
MEMBERS ONLY

Week Ahead: NIFTY Stays Crucially Poised; RRG Charts Hints At Markets Turning Defensive

by Milan Vaishnav,
Founder and Technical Analyst, EquityResearch.asia and ChartWizard.ae
It was one more consolidating week for the Indian equity markets, as the NIFTY continued to consolidate over the past five days. Despite a couple of attempts, it failed to clear the important resistance zone of 15900-15950 and suffered violent profit-taking twice from those levels. On the short-term daily charts,...
READ MORE
MEMBERS ONLY
Stocks Setting Up for Big Moves Next Week!

by Mary Ellen McGonagle,
President, MEM Investment Research
Over the past couple of weeks, over 50% of the companies in the S&P 500 have reported results for Q2 2021. Of those, 88% have reported EPS results above estimates. This is well above the average over the past five years.
The markets are all about future growth,...
READ MORE
MEMBERS ONLY
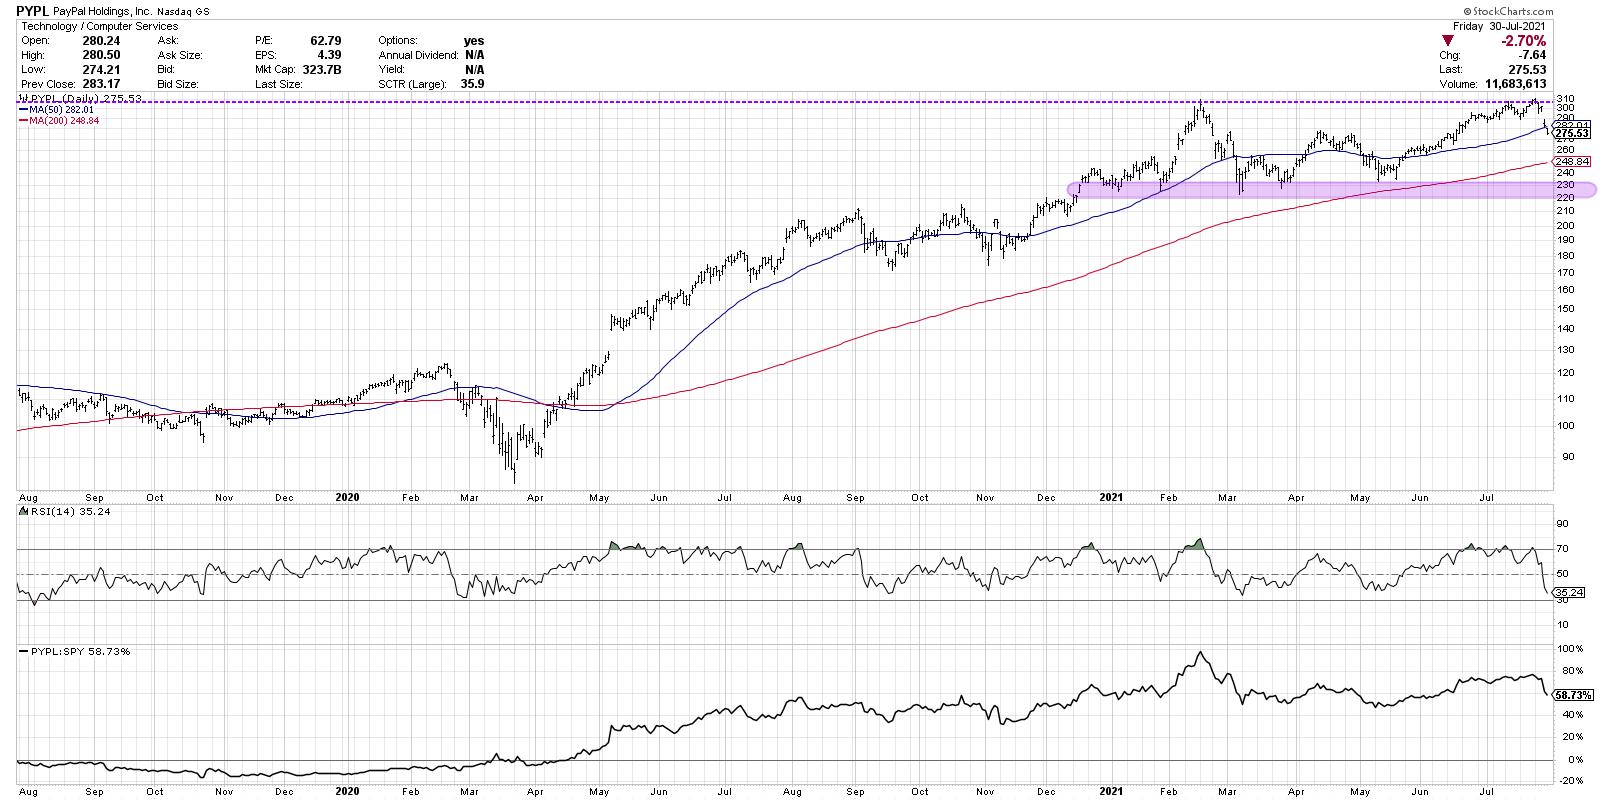
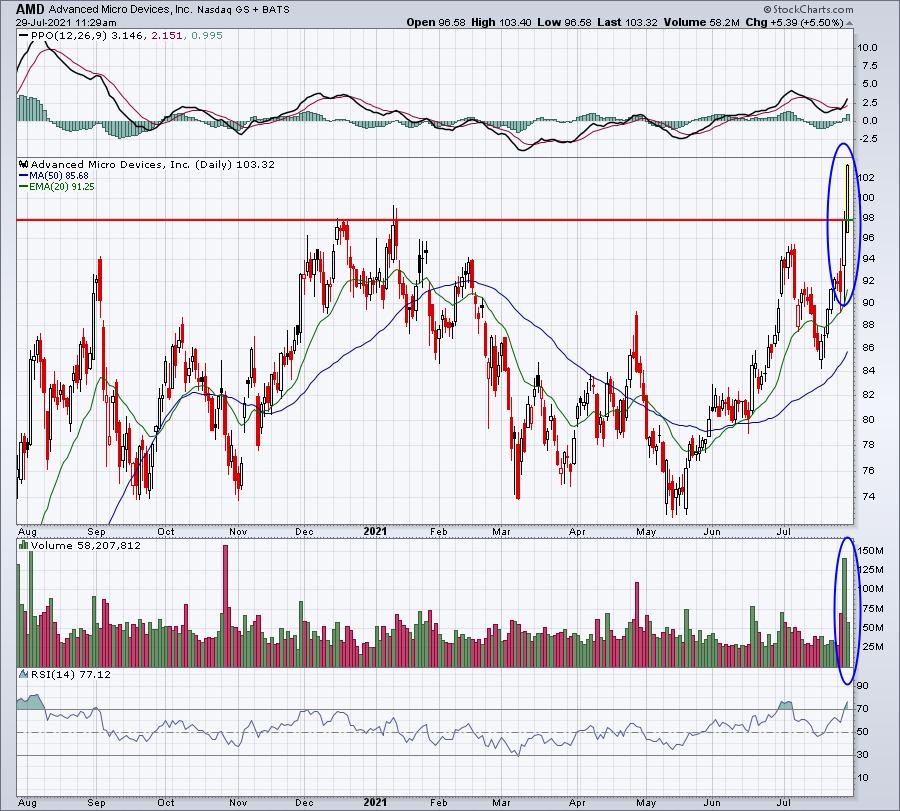
PayPal's Pullback May Be a Broader Signal

by David Keller,
President and Chief Strategist, Sierra Alpha Research
Markets in healthy uptrends, with improving bullish characteristics, see price breakouts follow through to further upside. Stocks like AAPL and AMZN and PYPL and others break above previous resistance levels and continue to push onward and ever upward.
Except that was not the upside follow through scenario that the markets...
READ MORE
MEMBERS ONLY

What's Driving These Markets?
by Mary Ellen McGonagle,
President, MEM Investment Research
This week on StockCharts TV'sThe MEM Edge, Mary Ellen reviews last week's market dynamics and uncovers what's supporting the continued uptrend in the broader markets. She also shares how to capitalize on the strength in 2nd-quarter GDP.
This video was originally broadcast on July...
READ MORE
MEMBERS ONLY

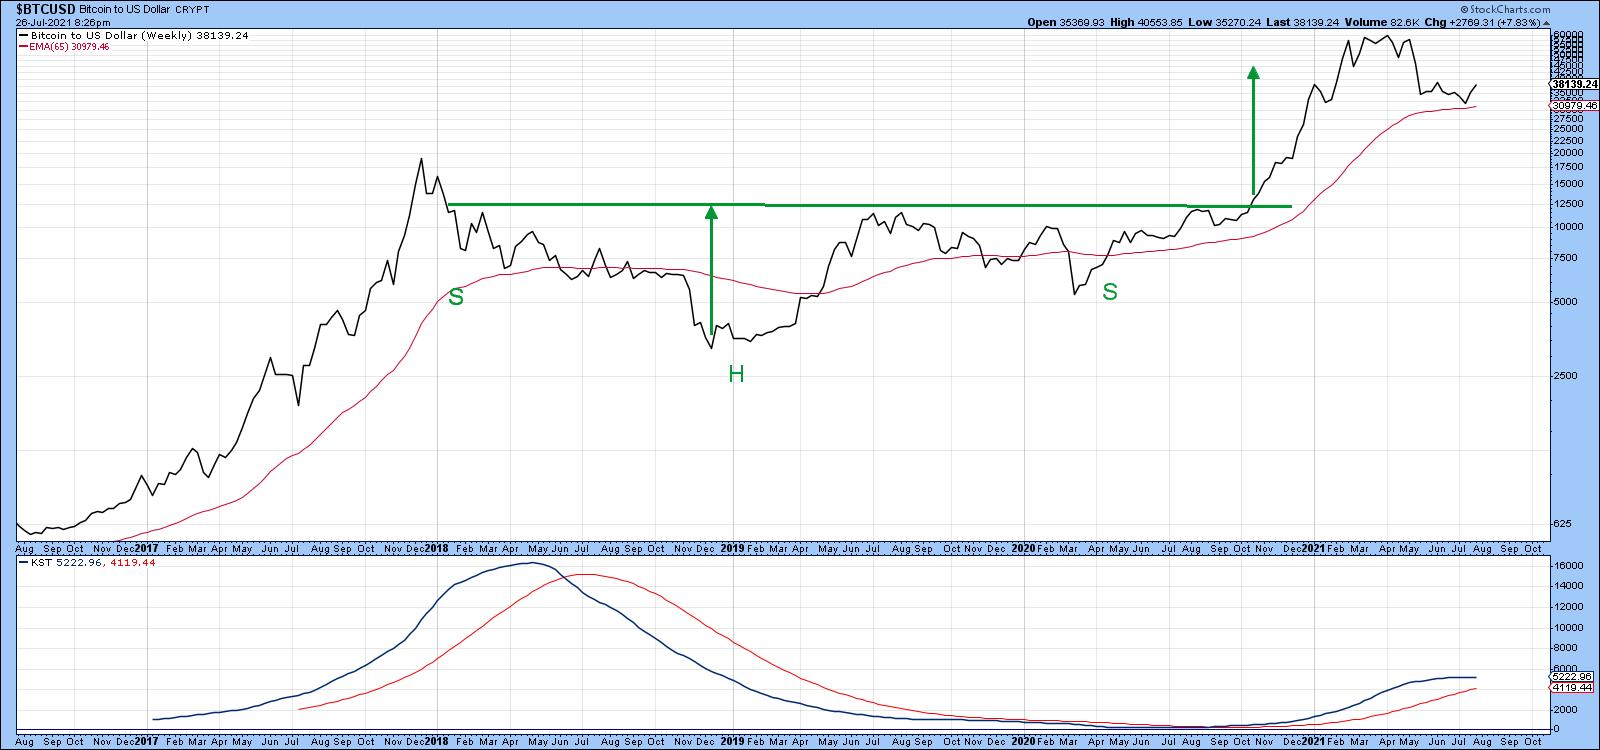
Bitcoin and Chinese Equities Go their Separate Ways
by Martin Pring,
President, Pring Research
After months of quiet frustrating trading, Bitcoin finally broke out to the upside this week. It's too early to say whether this is the beginning of a move to new all-time highs, as lots more backing and filling is probably necessary in order for it to form a...
READ MORE
MEMBERS ONLY
Pivotal Price Levels the Market Must Hold or Clear Next Week
The past week's earnings have set the market stage, with large tech companies such as Apple (AAPL), Google (GOOG/GOOGL) and Microsoft (MSFT) beating earnings estimates. With that said, prices look to be waning not only in the large tech companies, but in the overall market. This could...
READ MORE
MEMBERS ONLY
Hottest Stocks in The Hottest Industries

by Tom Bowley,
Chief Market Strategist, EarningsBeats.com
It's no secret that I'm a fan of leading stocks in leading industries. So, as we move through yet another earnings season -- and there's still plenty left in it -- I thought I'd review what I consider to be the best...
READ MORE
MEMBERS ONLY
A Warning From Small Caps Weakness Across The Board
by Julius de Kempenaer,
Senior Technical Analyst, StockCharts.com
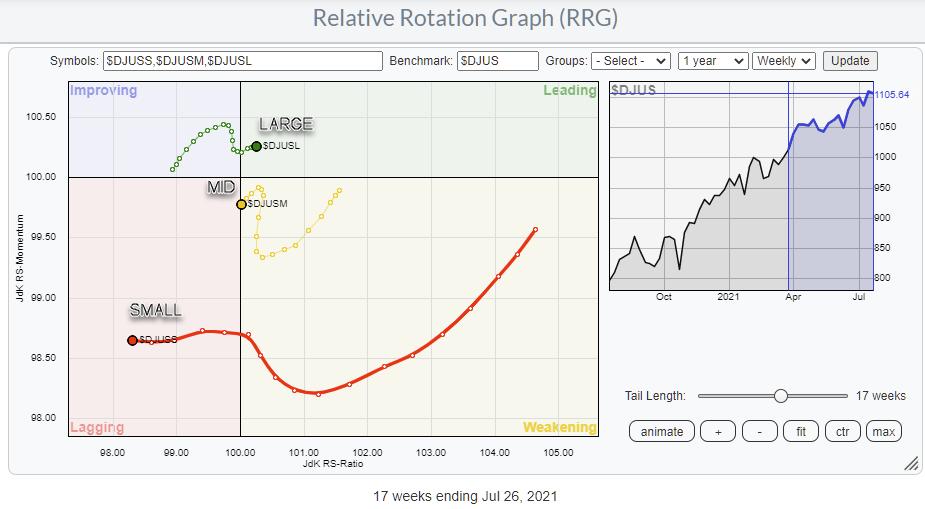
The Relative Rotation Graph showing the rotations for Large-, Mid- and Small-Cap indexes is sending a very clear message: Avoid Small-Caps. (And also Mid-Caps.)
The large-cap segment pushes further into the leading quadrant, while small-caps are on a very long tail moving deeper into negative territory. It looked as if...
READ MORE
MEMBERS ONLY

Using MACD in Multiple Timeframes

by Joe Rabil,
President, Rabil Stock Research
In this week's edition of Stock Talk with Joe Rabil, gives a few examples of how he uses MACD in multiple time frame. He explains 2 MACD patterns from his book, the Zero Line Reversal Pattern and the Pinch. He then goes through and analyzes the stock requests...
READ MORE
MEMBERS ONLY

Chartwise Women: Have You Ever...
by Mary Ellen McGonagle,
President, MEM Investment Research
by Erin Swenlin,
Vice President, DecisionPoint.com
In this week's edition of Chartwise Women, Erin and Mary Ellen play "Never Have I Ever" with the markets, looking at stocks in the news based on these 'revealing' questions. Play along as they not only share their answers to the questions, but also...
READ MORE
MEMBERS ONLY
RRG Identifies 2 Interesting Semiconductor Stocks
by Julius de Kempenaer,
Senior Technical Analyst, StockCharts.com
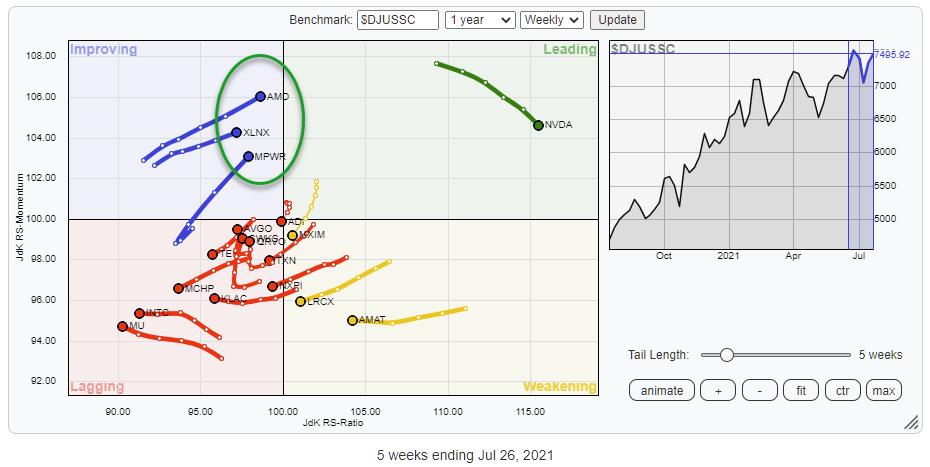
The Relative Rotation Graph above shows the rotation for the members of the Semiconductor group against the DJ US Semiconductor index. Clearly, NVDA is the main component of this group, and it has been leading the group higher recently. Over the last few weeks, however, NVDA has started to lose...
READ MORE
MEMBERS ONLY

S&P 500 TOUCHES NEW RECORD -- SMALL AND MIDSIZE STOCKS ARE LOOKING STRONGER

by John Murphy,
Chief Technical Analyst, StockCharts.com
S&P 500 TOUCHES NEW RECORD... Stocks continue to rise with major stock indexes at or near record highs. Chart 1 shows the S&P 500 touching new record territory. Smaller stocks have been lagging behind the large cap rally. But are starting to look stronger. That includes...
READ MORE
MEMBERS ONLY
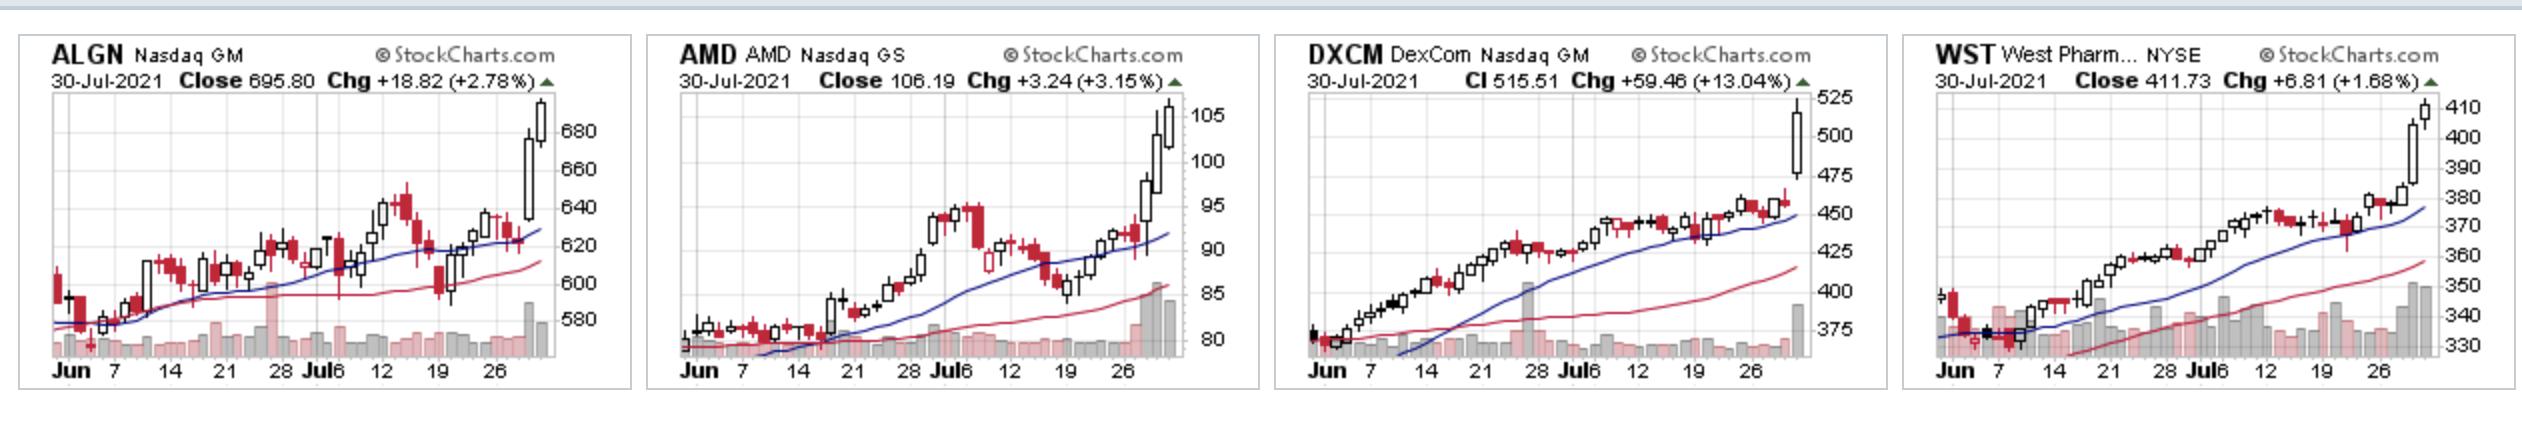
Major Breakouts Are Continuing In A Big Way
by Tom Bowley,
Chief Market Strategist, EarningsBeats.com
Months of consolidation is now resulting in key breakouts for a number of growth stocks. Amazon.com (AMZN), which will report quarterly results later today, was a high-profile breakout after nearly a year of consolidation. But that's simply set the beginning of a trend. Here are two more...
READ MORE
MEMBERS ONLY
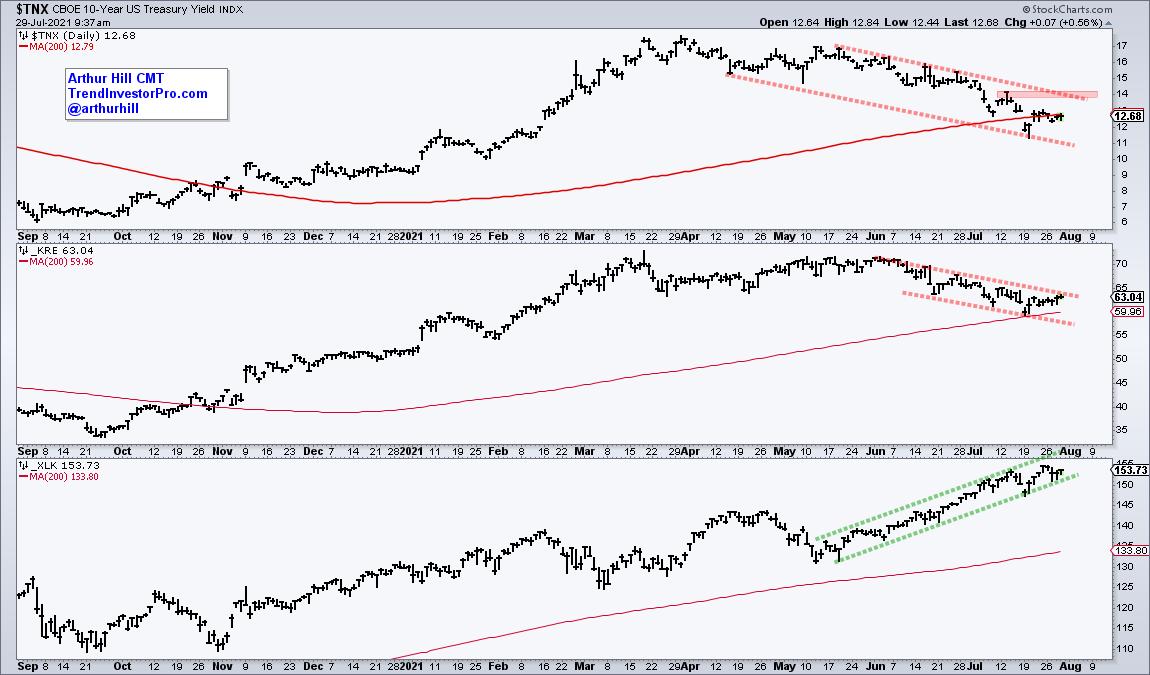
The 10-yr Yield, Banks, Techs and Rotation

by Arthur Hill,
Chief Technical Strategist, TrendInvestorPro.com
The decline in the 10-yr yield is not the only factor at work in the markets, but there is clearly a correlation at work recently, especially with banks. The chart below shows the 10-yr Yield ($TNX) and Regional Bank ETF (KRE) falling from mid May to July. Meanwhile, the Technology...
READ MORE
MEMBERS ONLY
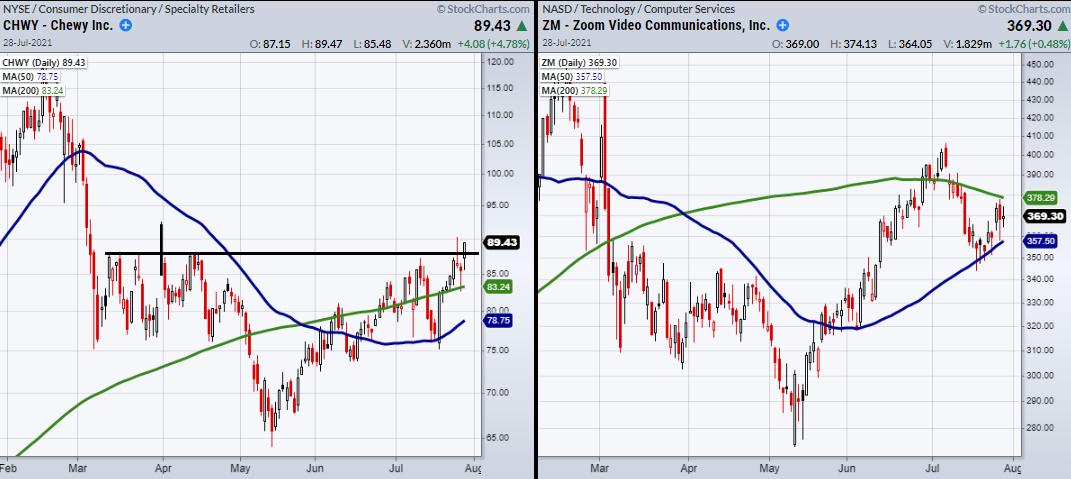
Symbols to Watch as the Stay-at-Home Trend Continues
Google recently joined the list of growing companies to postpone their back-to-work plans as the COVID-19 delta variant continues to spread. Along with Google, Apple has previously extended working from home for the same reason. As large corporations postpone back-to-office mandates, many other companies are giving their employees the option...
READ MORE
MEMBERS ONLY

What are the Key Support Levels in the Major Indices?
As the COVID-19 delta variant spreads across the United States, the CDC continues to update its guidelines to mitigate further spread. Although we don't know if there will be any nationwide lockdowns or reduced travel restrictions in the immediate future, it has become abundantly clear that COVID issues...
READ MORE
MEMBERS ONLY
Sector Spotlight: Tech is Back, But...
by Julius de Kempenaer,
Senior Technical Analyst, StockCharts.com
On this edition of StockCharts TV's Sector Spotlight, I highlight interesting seasonal patterns for various sectors and explore if they are aligning with the current rotations on the Relative Rotation Graph. It looks like August has some interesting seasonal anomalies that are worth exploring. 7 out of the...
READ MORE
MEMBERS ONLY
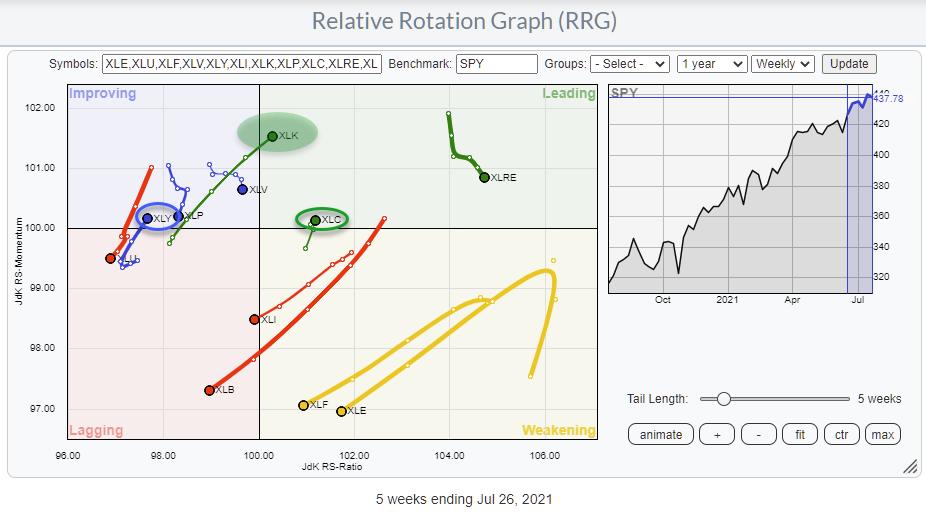
Technology Rotating Into Leading Quadrant on RRG, But Will It Be Enough?
by Julius de Kempenaer,
Senior Technical Analyst, StockCharts.com
At the start of this week, the technology sector is rotating into the leading quadrant on the weekly RRG. Clearly, the endpoint of the tail is not fixed until Friday's close. Still, the improvement is visible and follows the improvement that was already visible for a few weeks...
READ MORE
MEMBERS ONLY
DP TV: Measuring Market Bias
by Erin Swenlin,
Vice President, DecisionPoint.com
In this episode of DecisionPoint, Erin, flying solo, taked an in-depth view of the SPX and Swenlin Trading Oscillators (STOs) and covers the rally in Bitcoin, as well as a look at the prospects of Crude Oil moving forward. She then introduces DecisionPoint's "Bias Assessment" technique;...
READ MORE
MEMBERS ONLY
Bitcoin and Chinese Equities Go their Separate Ways
by Martin Pring,
President, Pring Research
After months of quiet frustrating trading, Bitcoin finally broke out to the upside this week. It's too early to say whether this is the beginning of a move to new all-time highs, as lots more backing and filling is probably necessary in order for it to form a...
READ MORE
MEMBERS ONLY
Is the Market Gaining or Losing Momentum?
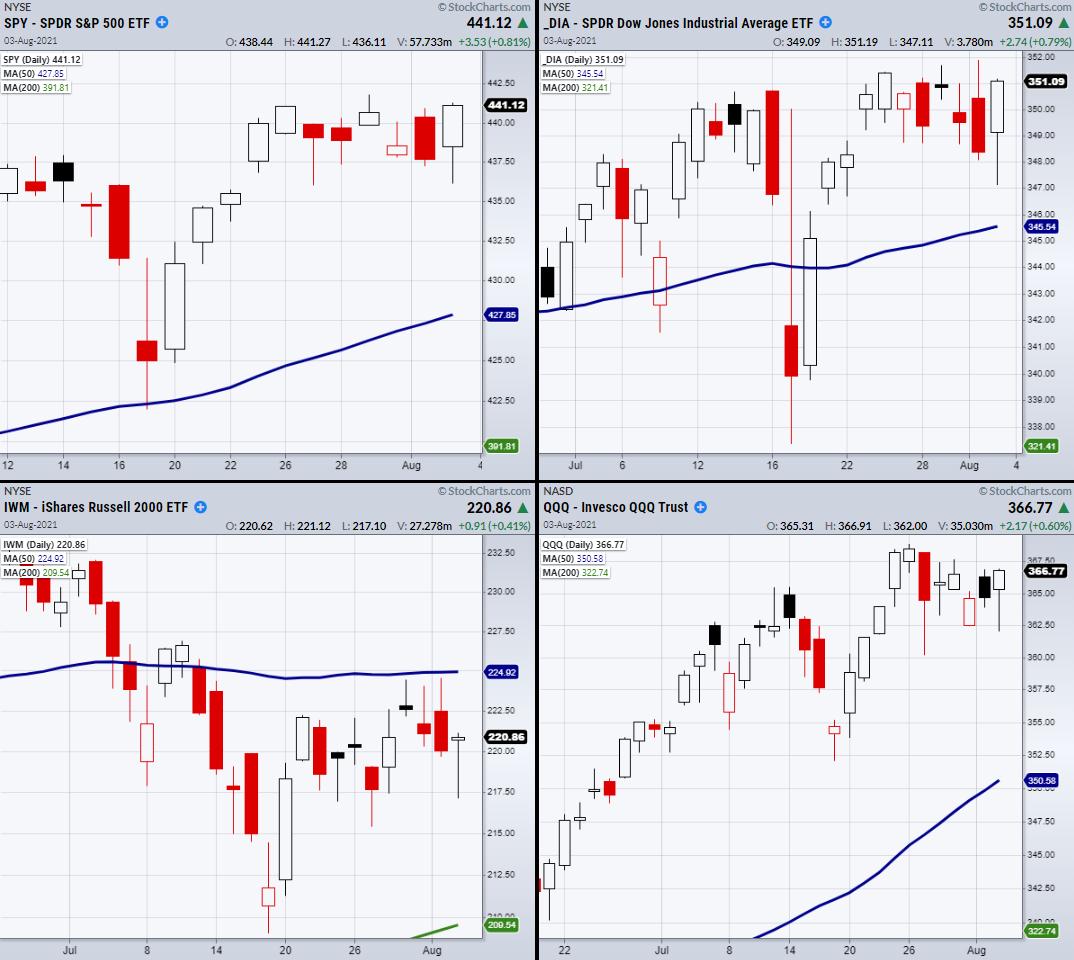
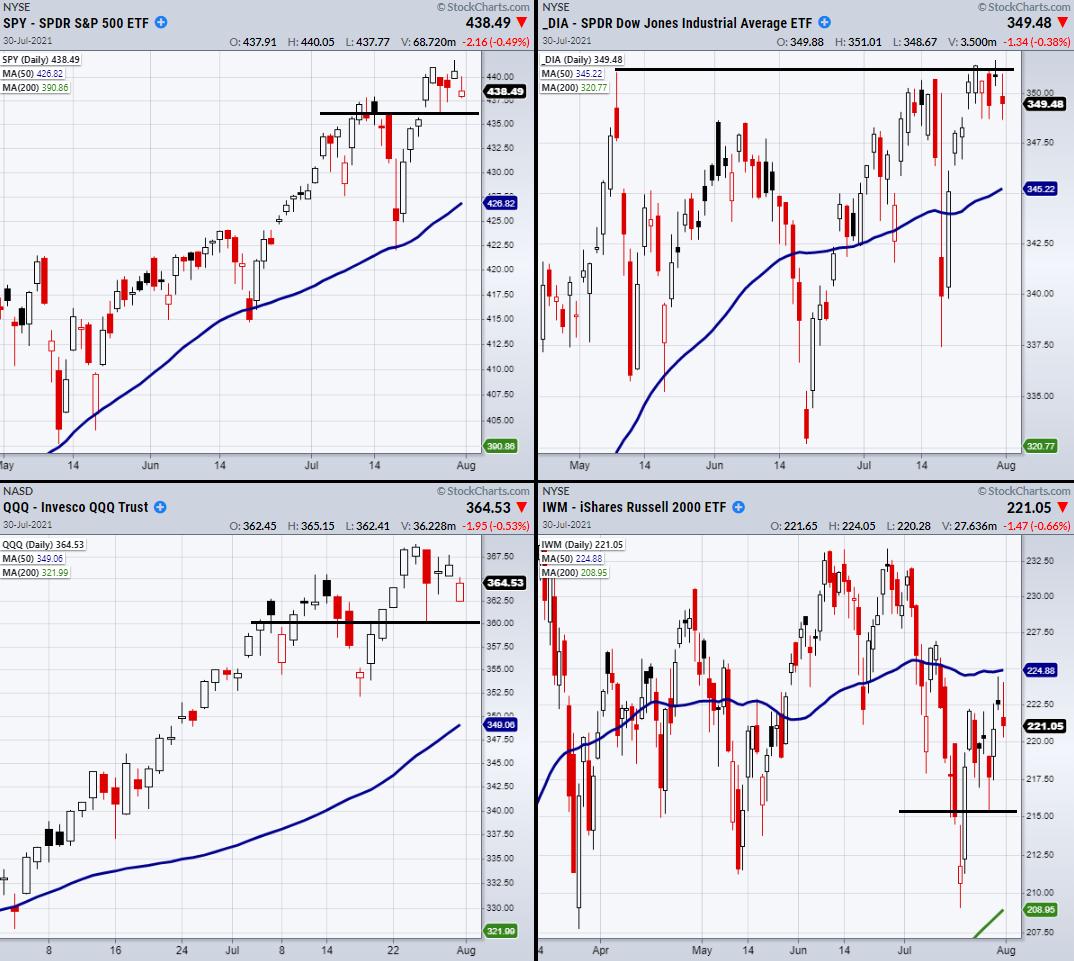
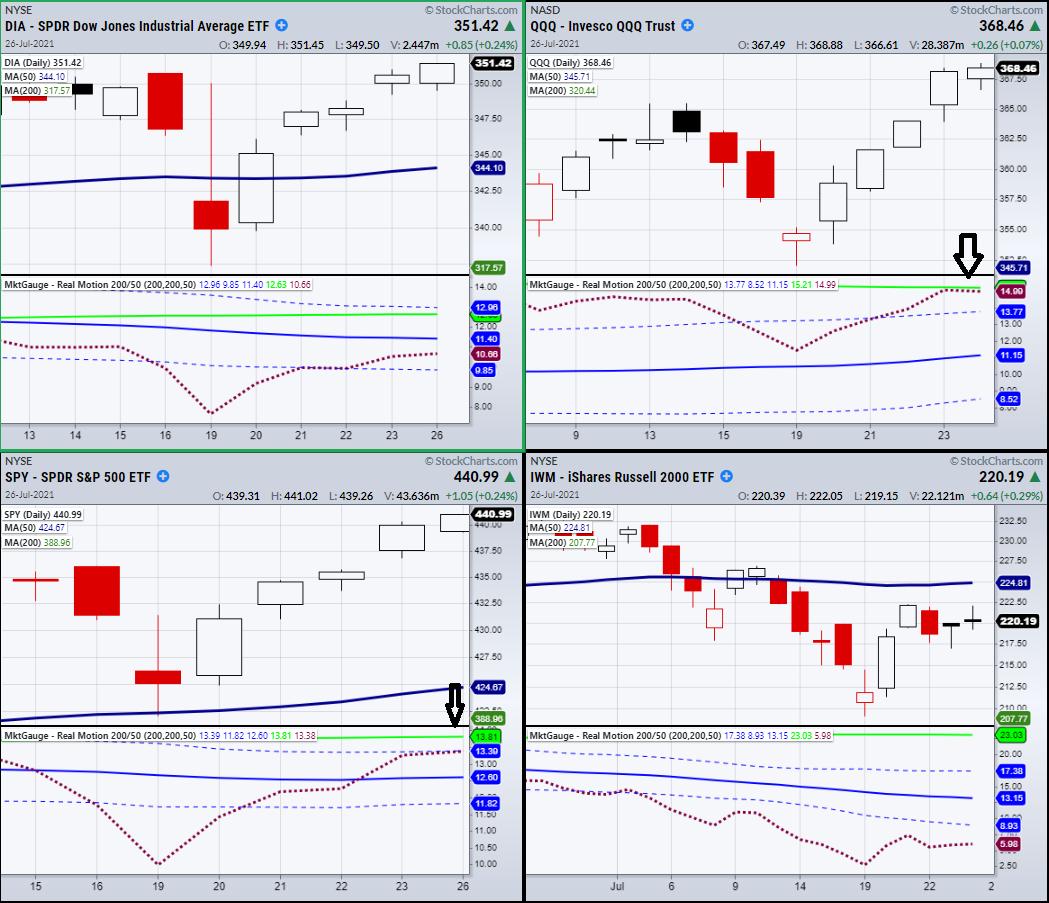
Three of the four major indices, including the S&P 500 (SPY), Nasdaq 100 (QQQ) and the Dow Jones (DIA), inched to new highs, while the Russell 2000 (IWM) is struggling in its current price range. It is important for IWM to keep pace with the other indices, for...
READ MORE
MEMBERS ONLY
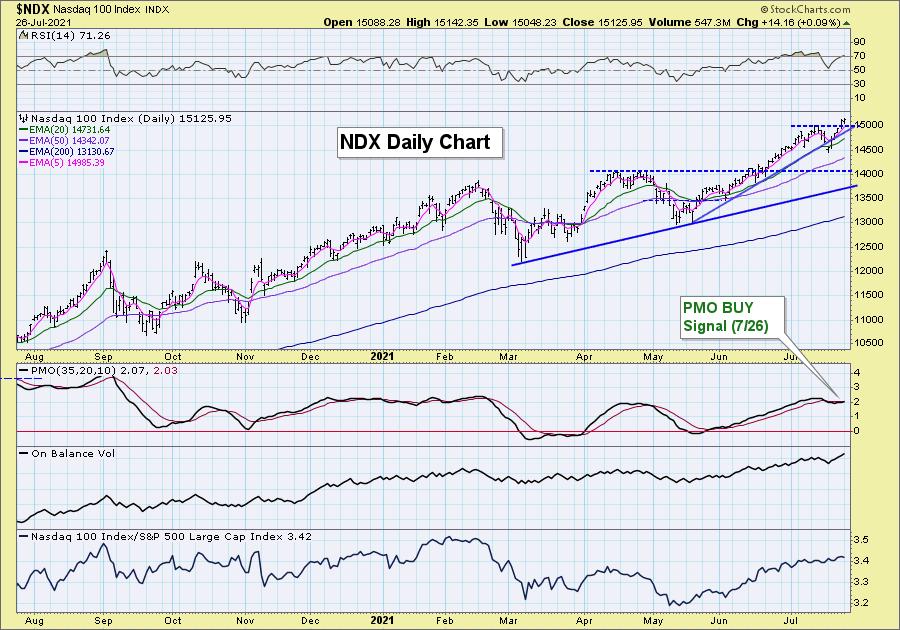
Nasdaq 100 ($NDX) Triggers Price Momentum Oscillator (PMO) BUY Signal
by Erin Swenlin,
Vice President, DecisionPoint.com
The market is continuing to see follow-through on the bounce that began last week. Charts and indicators that once looked very bearish are now turning around. Today both the SPX and NDX generated PMO crossover BUY signals. I'm going to focus in on the NDX, but I will...
READ MORE
MEMBERS ONLY
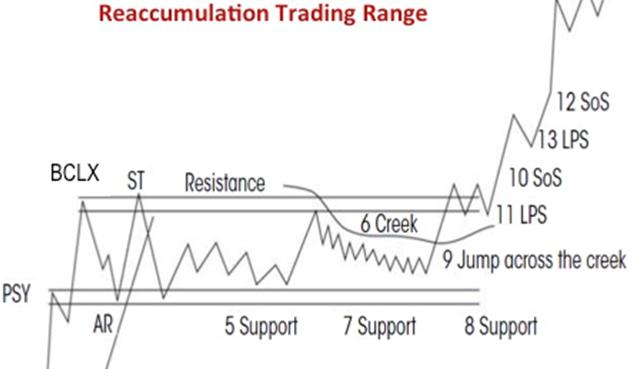
Is the DJIA Completing a Wyckoff Reaccumulation?

by Bruce Fraser,
Industry-leading "Wyckoffian"
On the most recent episode of Power Charting on Stock Charts TV (link below) an analysis of the Dow Jones Industrial Average was considered. A sudden and sharp reaction occurred earlier this week. The index returned to the Oversold Trendline and found good support. Is the DJIA completing a Reaccumulation...
READ MORE
MEMBERS ONLY
It May Be The Boring Summertime, But Don't Tell These Stocks
by Tom Bowley,
Chief Market Strategist, EarningsBeats.com
It's 2021, but it's beginning to feel like it's 2020 again. I know, I know. Who wants to relive 2020 all over again, right? Well, thankfully, I'm just referring to the stock market. Many of the stocks that soared during 2020, and...
READ MORE
MEMBERS ONLY
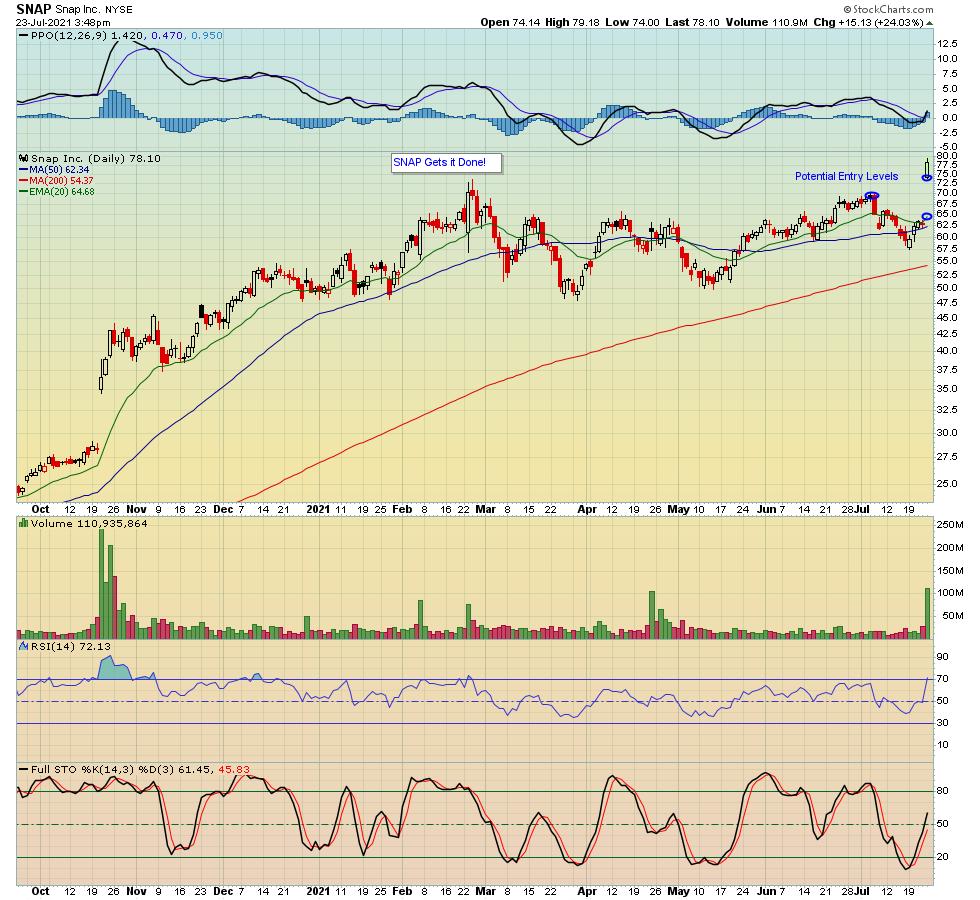
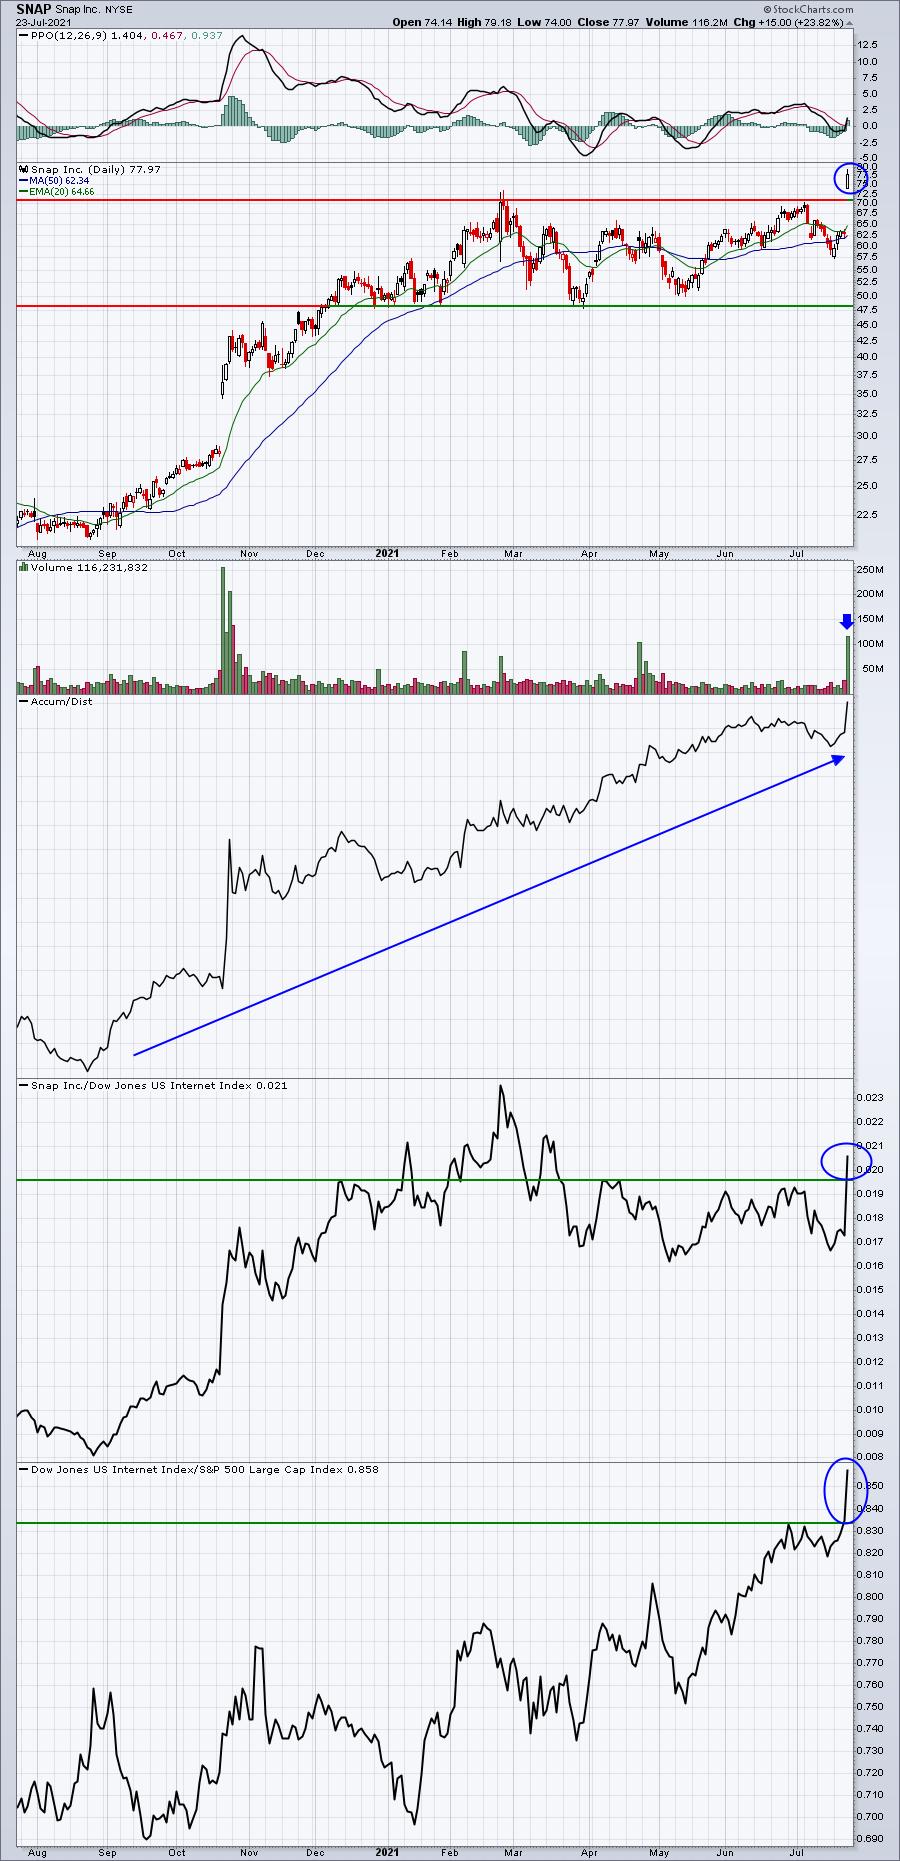
This is Why You MUST Follow Relative Strength Heading into Earnings

by John Hopkins,
President and Co-founder, EarningsBeats.com
If you have been paying attention to earnings, you would have seen that SNAP reported their numbers on Thursday and crushed all expectations. As a result, the stock was higher by over 25% at its peak the day after the numbers were released.
While you might not have benefited from...
READ MORE
MEMBERS ONLY
Explosive Moves Following Earnings
by Mary Ellen McGonagle,
President, MEM Investment Research
This week on StockCharts TV'sThe MEM Edge, Mary Ellen reviews how quarterly earnings reports drove market action this week. She also shares how to trade stocks after big gaps up in price. Lastly, she presents a deep dive into the rebound in Consumer stocks.
This video was originally...
READ MORE
MEMBERS ONLY
Why Everyone Should be Watching IWM and IYT Through Next Week
The week started with a large rally and is now ending with the Nasdaq 100 (QQQ) and the S&P 500 (SPY) at all-time highs.
Though the Dow Jones (DIA) is not far behind, the small-cap index Russell 2000 (IWM) struggles in the middle of its trading range. The...
READ MORE
MEMBERS ONLY

Watch This Sector and Industry Group Next Week!
by Erin Swenlin,
Vice President, DecisionPoint.com
On Fridays, as part of my subscriber-only DecisionPoint Diamonds Report, I give readers insight on how the Sectors did for the week, what our Sector Scoreboard and daily RRG look like and, most importantly, what sector and industry group to watch going into next week.
I decided to share an...
READ MORE
MEMBERS ONLY
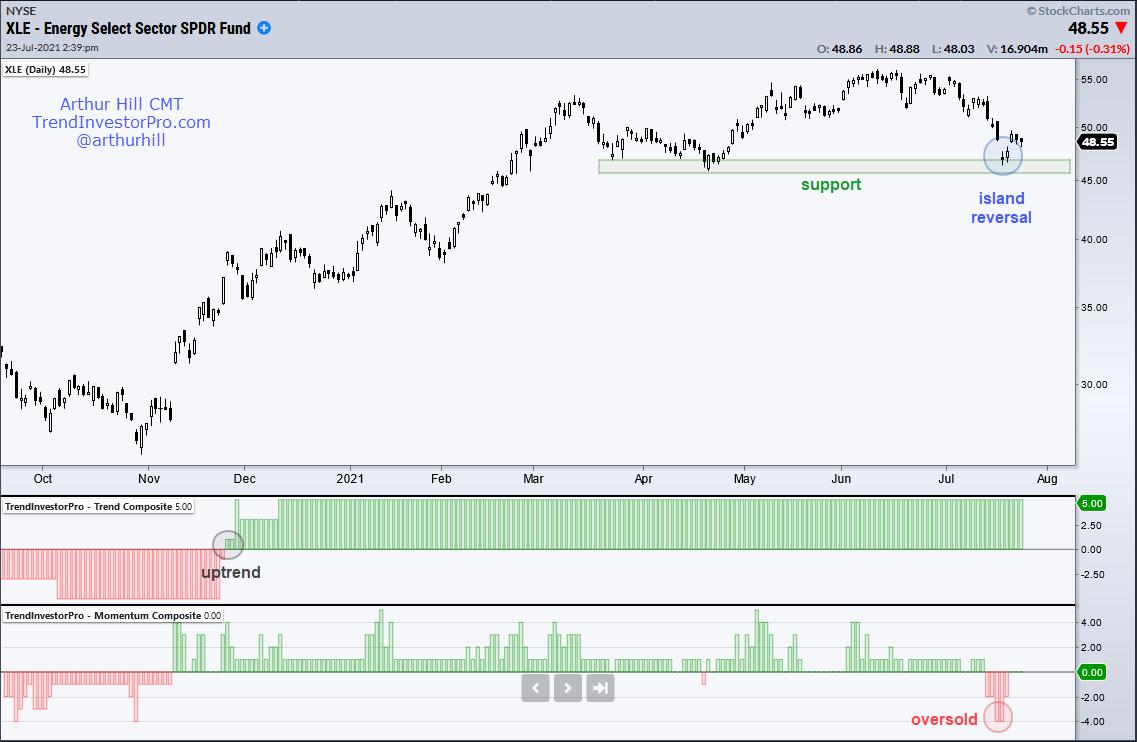
XLE Bids to End Correction and Resume Uptrend
by Arthur Hill,
Chief Technical Strategist, TrendInvestorPro.com
The Energy SPDR (XLE) is setting up to end its correction and resume its bigger uptrend.
First and foremost, the long-term trend is up because the Trend Composite signaled an uptrend (gray circle) in late November when the majority of indicators turned bullish. There are five trend-following indicators in the...
READ MORE
MEMBERS ONLY
Chartwise Women: Profit from a Pullback!
by Mary Ellen McGonagle,
President, MEM Investment Research
by Erin Swenlin,
Vice President, DecisionPoint.com
In this week's edition of Chartwise Women, Mary Ellen and Erin review this week's pullback in the market and identify signals that it's time to buy. They also cover how to tell when the pullback in Cyclical Stocks is over and end with a...
READ MORE
MEMBERS ONLY
Delving into StockChartsACP
by Joe Rabil,
President, Rabil Stock Research
In this week's edition of Stock Talk with Joe Rabil, Joe shows his favorite aspects of StockChartsACP, explaining the convenience of getting at stock and market summary information through ACP. He also shows one of the scans he uses to find the pullback trade. Then, he goes through...
READ MORE
MEMBERS ONLY
Evaluating Early Earnings Results: 3 Big Winners Thus Far
by Tom Bowley,
Chief Market Strategist, EarningsBeats.com
A great post-earnings set up needs to check several boxes. The first box I need to check is the "beat revenue and earnings estimates" box, followed closely by the "raised guidance" box. When a company beats top and bottom line estimates and raises guidance, it results...
READ MORE
MEMBERS ONLY

Trend-Following Methodology

by Dave Landry,
Founder, Sentive Trading, LLC
In this edition of Trading Simplified, Dave teaches you to think like a trader. Trend following is easy if you follow a system; the hard part is sticking to it. Dave walks you though simple setups and simple systems.
This video was originally broadcast on July 21, 2021. Click anywhere...
READ MORE
